Ripple Labs has settled with the U.S. Securities and Exchange Commission (SEC) over their ongoing lawsuit. As part of the agreement, Ripple will pay a reduced fine of $50 million and drop its cross-appeal. Additionally, the SEC will return $75 million of the original $125 million fine. The SEC is now set to request the lifting of the injunction on Ripple, marking a significant step forward in resolving the case.
Welcome to the US Crypto News Morning Briefing—your essential rundown of the most important developments in crypto for the day ahead.
Grab a coffee as we analyze Standard Chartered’s Bitcoin (BTC) price projections. According to the bank, Bitcoin price could hit $500,000 as global institutions accumulate Strategy’s MSTR stock for indirect exposure to Bitcoin.
Crypto News of the Day: Standard Chartered’s Bold Bitcoin Prediction
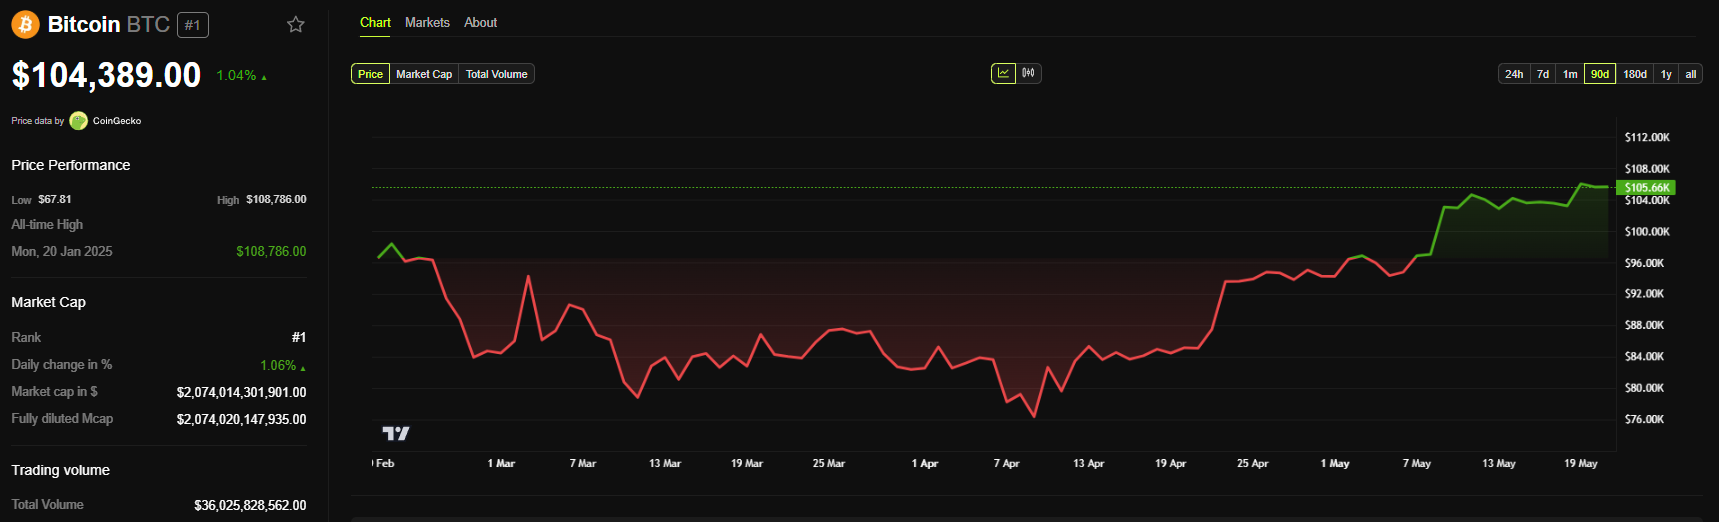
Bitcoin was trading for $105,178, up by a modest 2.27% in the last 24 hours. In recent developments, the pioneer crypto market capitalization has ascended to an all-time high of $2.09 trillion.
However, analysts hold that institutional interest has much to do with Bitcoin’s value surge. Firstly, Bitcoin ETFs (exchange-traded funds), which offer Traditional Finance (TradFi) players indirect exposure to BTC, drive institutional interest.
In the same way, institutions are gaining indirect exposure to Bitcoin via Strategy’s MSTR stock. A recent US Crypto News publication indicated that Strategy (formerly MicroStrategy) held 576,230 BTC as of May 19.
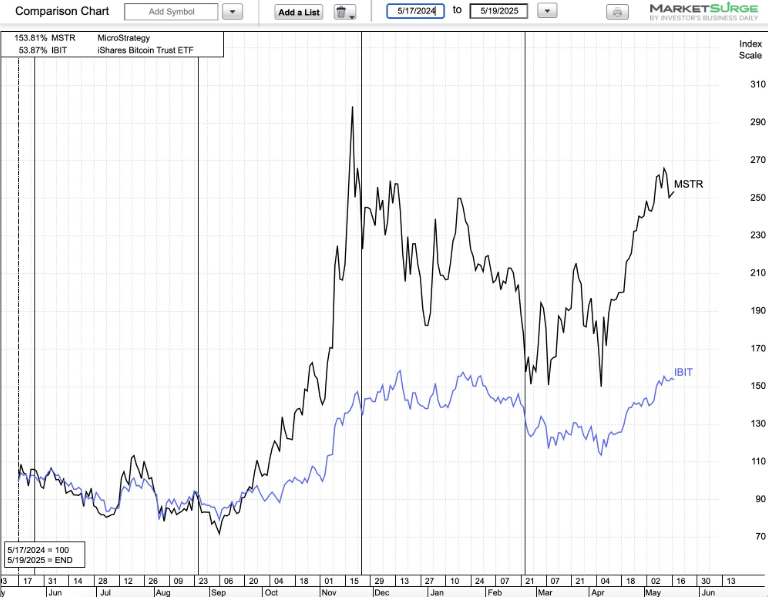
Holding a significant amount of Bitcoin on its balance sheet, Strategy’s MSTR stock price correlates closely with Bitcoin’s price movements.
MSTR vs. BTC performance in the past year. Source: ivanhoff.com on X
Analysts ascribe this correlation to a dynamic where Bitcoin is the base layer while MSTR operates as a vehicle with different risks, mechanics, and rewards.
Against this backdrop, BeInCrypto contacted Geoff Kendrick, Head of Digital Assets Research at Standard Chartered. According to Kendrick, Bitcoin is still on course to hit $500,000 before the end of Trump’s second administration.
Kendrick ascribes this to deepening institutional adoption, particularly through indirect exposure via MicroStrategy’s MSTR shares.
Standard Chartered Says Increasing Allocations to MSTR Is Bullish for Bitcoin
Newly released Q1 2025 13F filings from the US SEC (Securities and Exchange Commission) support the bank’s bullish thesis. Specifically, Strategy saw increasing allocations to MSTR by a range of global sovereign and quasi-sovereign entities.
“As more investors gain access to the asset and as volatility falls, we believe portfolios will migrate towards their optimal level from an underweight starting position in Bitcoin,” Kendrick said in an email to BeInCrypto.
While direct holdings of Bitcoin ETFs declined slightly overall, largely due to the State of Wisconsin Investment Board selling its entire 3,400 BTC-equivalent position in BlackRock’s IBIT ETF, other entities quietly increased exposure via MSTR, which Kendrick described as a “Bitcoin proxy.”
“Government entities increased their holdings of Strategy Incorporated (MSTR), which typically trades like a Bitcoin proxy. Entities in Norway, Switzerland, and South Korea reported significant MSTR increases, and Saudi Arabia added a very small position for the first time,” Kendrick told BeInCrypto.
The Standard Chartered executive emphasized that while Bitcoin ETF flows were “unexciting,” the MSTR accumulation trend was the real story this quarter.
“The MSTR ownership detail was where the excitement was,” he added.
Geoff Kendrick went further, detailing Standard Chartered’s analysis of the filings. Based on their analysis:
Norway added 700 BTC-equivalent via MSTR, now holding 6,300 BTC-equivalent.
Switzerland also added 700 BTC-equivalent, reaching 2,300 BTC-equivalent.
South Korea added 700 BTC-equivalent, bringing its total to 1,300 BTC-equivalent.
US state funds (California, New York, North Carolina, Kentucky) added 1,000 BTC-equivalent collectively, now at 3,300 BTC-equivalent.
Saudi Arabia’s Central Bank opened a small MSTR position—its first.
Meanwhile, Abu Dhabi’s quasi-sovereign wealth fund Mubadala added 300 BTC equivalent via ETF holdings, increasing its position to 5,000 BTC equivalent.
“SEC 13F data for Q1 supports our thesis that Bitcoin is attracting a wider range of buyers. While data on Bitcoin ETF holdings was disappointing, MSTR – a Bitcoin proxy – saw increased buying. Overall sovereign positions were unchanged due to the Wisconsin pension fund selling its ETF holdings,” Kendrick concluded.
The data reinforce Standard Chartered’s outlook that institutional and sovereign flows—both direct and indirect—will be a key driver of Bitcoin’s ascent to $500,000 in the coming years.
Chart of the Day
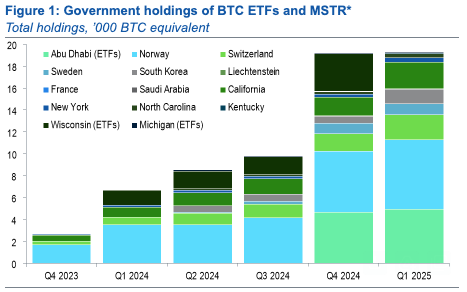
Governement holdings of BTC ETFs and MSTR. Source: Standard Chartered
This chart illustrates the total government holdings of Bitcoin ETFs and MicroStrategy’s MSTR stock from Q4 2023 to Q1 2025, measured in ‘000 (thousands) BTC equivalents. Based on the chart, holdings have grown steadily, peaking in Q1 2025 at around 18,000 BTC.
The chart shows that key contributors include Abu Dhabi (ETFs), Norway, Sweden, South Korea, France, New York, Wisconsin (ETFs), Michigan (ETFs), Switzerland, Liechtenstein, California, North Carolina, Saudi Arabia, and Kentucky, with varying contributions across quarters.
Byte-Sized Alpha
Here’s a summary of more US crypto news to follow today:
The U.S. government has long held a significant Bitcoin stash, mostly from criminal seizures and civil forfeitures. President Donald Trump has officially signed an Executive Order to establish a Strategic Bitcoin Reserve. This reserve will be funded using seized BTC, ensuring taxpayers won’t bear any costs. Trump’s crypto czar, David Sacks, compared this move to creating a “digital Fort Knox” to solidify America’s dominance in the crypto economy.
The Big Question: How Much BTC Does the U.S. Hold?
Estimates of U.S. government Bitcoin holdings vary widely. David Sacks claims the government holds close to 200,000 BTC, and an audit has been ordered to determine the exact amount.
Just a few minutes ago, President Trump signed an Executive Order to establish a Strategic Bitcoin Reserve.
The Reserve will be capitalized with Bitcoin owned by the federal government that was forfeited as part of criminal or civil asset forfeiture proceedings. This means it…
Crypto analyst Conor Grogan estimates the figure at 198,109 BTC, worth around $18 billion at current prices. However, analyst Alex Thorn argues that only 86,000 BTC is available for use, as 112,000 BTC was seized from the Bitfinex hack and is expected to be returned.
The government will not sell BTC stored in reserve.
An official audit has been ordered to verify holdings.
The Treasury and Commerce Departments will explore budget-neutral strategies.
A separate Digital Asset Stockpile has been created for non-Bitcoin assets acquired through forfeitures.
Legal Confusion: Seized vs. Forfeited BTC
In response to Thorn, Miles Deutscher adds more clarity, explaining that while the U.S. government technically holds 198,000 BTC, only 88,000 BTC (43%) is available for use. The rest is caught up in legal battles, particularly regarding Bitfinex’s hacked funds. This distinction between “seized” and “forfeited” assets could impact how much BTC the government can leverage for the Strategic Reserve.
Samson Mow, CEO of JAN3, emphasizes that the U.S. Strategic Bitcoin Reserve (SBR) is more than just seized assets—it marks the beginning of nation-state Bitcoin adoption. While some argue there’s no actual buying, he assures that “budget-neutral” methods like Bitcoin bonds or selling gold will come into play. He highlights that with the SBR, Bitcoin is now officially treated like gold, creating a “digital Fort Knox.” The move also triggers an official audit of U.S. Bitcoin holdings, challenging inflated estimates of 207k-220k BTC, as 95k BTC will be returned to Bitfinex. With China holding 194k BTC, Mow suggests the U.S. won’t settle for second place and will eventually acquire more Bitcoin, fueling a global race for strategic BTC reserves.
Market Impact
The crypto market has reacted strongly to Trump’s Bitcoin Reserve announcement. Prices of ADA, XRP, and SOL jumped following the news, while Bitcoin itself faced a brief sell-off amid funding confusion. Historically, when the U.S. government has offloaded Bitcoin, the market has suffered. However, Sacks’ assurance that the government will not sell BTC from the reserve has given investors hope for stability.
Never Miss a Beat in the Crypto World!
Stay ahead with breaking news, expert analysis, and real-time updates on the latest trends in Bitcoin, altcoins, DeFi, NFTs, and more.
The post U.S. Government Establishes Strategic Bitcoin Reserve: Key Insights & Market Impact appeared first on Coinpedia Fintech News
The U.S. government has long held a significant Bitcoin stash, mostly from criminal seizures and civil forfeitures. President Donald Trump has officially signed an Executive Order to establish a Strategic Bitcoin Reserve. This reserve will be funded using seized BTC, ensuring taxpayers won’t bear any costs. Trump’s crypto czar, David Sacks, compared this move to …
Defunct cryptocurrency exchange FTX has filed lawsuits against NFT Stars Limited and Kurosemi Inc., the operator of the Delysium platform, as part of its ongoing efforts to recover assets for creditor payouts.
The legal actions announced by FTX and its recovery trust are in response to the companies’ alleged failure to deliver tokens as stipulated in prior contractual agreements.
In addition to the current legal actions, FTX revealed that it is also engaging with several other token issuers to recover assets. The company added that further lawsuits will be filed against those who fail to cooperate.
“We urge token and coin issuers to return assets that rightfully belong to FTX, and are willing to initiate litigation barring adequate engagement. Our team continues to work tirelessly to maximize recoveries for the FTX Estate and return funds to creditors, including by filing two complaints against issuers who have repeatedly ignored our attempts to engage,” The FTX Estate’s statement read.
On February 18, 2025, FTX started its initial distributions of recovered funds. The initial round of payments was made to holders of approved claims in FTX’s Convenience Class. FTX also announced that the next distribution record date will be April 11, with payments expected to begin on May 30.
This second round of payments will include Class 5 Customer Entitlement Claims, Class 6 General Unsecured Claims, and additional Convenience Claims approved since the initial record date. This distribution is part of a broader plan to repay creditors.
Last month, FTX suffered another setback as Three Arrows Capital’s (3AC) claim was raised from $120 million to $1.5 billion. The amendment followed new findings about 3AC’s extensive dealings with FTX. It was approved despite objections from FTX.
Meanwhile, FTX’s collapse serves as a reminder of the systemic risks in the crypto industry. To avoid similar situations, US Senators have proposed the PROOF Act earlier this month.
The bill mandates that crypto exchanges keep customer funds separate from institutional assets. It also requires exchanges to submit monthly audits, called “Proof of Reserves,” conducted by neutral third-party firms. This aims to ensure transparency, verify asset availability, and enhance consumer protection.