The PUMP Price has climbed higher following a new liquidity initiative from Pump.fun. This aims at strengthening Solana’s memecoin ecosystem. The launch of the Glass Full Foundation (GFF) promises to inject significant liquidity into select projects. Why is the PUMP Price Up Today? According to CoinMarketCap data, the PUMP price spiked 7% to $0.003568 before
Ethereum price surged by 5% on Wednesday, reaching $2,050 for the first time in ten days. With mutiple news catalysts alligning with massive short liquidations, how high can ETH prices go?
Ethereum (ETH) retakes $2,000 after 10-days amid Fed rate pause and SEC news on Ripple
Ethereum’s price surged by 5% on Wednesday, reaching $2,050 for the first time in ten days. This uptick coincided with the U.S. Federal Reserve’s recent policy decision and the conclusion of Ripple’s legal battle with the Securities and Exchange Commission (SEC), events that have significantly impacted the cryptocurrency market.
The Federal Reserve announced a pause in interest rate hikes, maintaining the current rates amid stable economic indicators. This decision has been perceived positively by investors, leading to increased confidence in riskier assets, including cryptocurrencies like Ethereum.
Ethereum Price Action | CoinMarketCap
In a parallel development, Ripple’s CEO, Brad Garlinghouse, confirmed that the SEC has dropped its case against the company. The lawsuit, initiated in December 2020, alleged that Ripple’s XRP token was an unregistered security. The dismissal of this case has been viewed as a significant win for the broader cryptocurrency industry, alleviating regulatory uncertainties that have previously hindered market growth.
More Bullish Signals Appear as ETH Short Traders Emerge Biggest Losers
Aside from the latest Federal Reserve decision and Ripple’s SEC victory boosting altcoin market demand, Ethereum has formed internal bullish catalysts. Over the past week, the Ethereum network successfully implemented two key upgrades: the Pectra Upgrade and the Hoodi Update.
These technical improvements have strengthened investor confidence, helping ETH surpass the $2,000 resistance level on Wednesday.
Crypto market liquidation heatmap, March 19, 2025 | Source: Coinglass
According Coinglass’ latest derivatives crytpocurrency market data suggest further upside potential.
According to the liquidation heatmap, Ethereum saw $86.58 million in total liquidations over the past 24 hours, with short traders suffering the most at $72.62 million. This accounted for a significant 25% of total market-wide liquidations, indicating a short squeeze that fueled ETH’s breakout.
With ETH short traders emerging as the biggest losers, it signals that short sellers are closing their positions at a rapid pace. This has two key implications. First, it suggests that bears are conceding the $2,000 resistance level, reducing downward pressure on ETH.
Second, as ETH advances above $2,050 and stabilizes at $2,067 at press time, many traders who previously placed short positions around key resistance levels have exited. With weaker resistance ahead, ETH could rise rapidly if positive macro sentiment surrounding the Fed’s rate pause persists.
Ethereum Price Forecast: Bulls Need $2,100 Breakout to Confirm Next Move
ETH price surged past $2,036, gaining 5.43% as bullish momentum accelerated following positive macroeconomic swings and successful network updates. Ethereum price forecast indicators on the daily chart reveals that ETH is trading above the 20-day moving average, signaling a potential short-term bullish reversal. The recent price action also aligns with the VWAP level of $2,009, further validating the strength of this rebound. A decisive close above $2,100 could open the door for a continuation toward the next resistance level at $2,373, as indicated by the upper Keltner Channel boundary.
Ethereum Price Forecast
However, despite the bullish momentum, Ethereum remains under a looming “death cross” overhang, where the 50-day moving average trends below the 200-day moving average, signaling a long-term bearish risk. Additionally, while short-term resistance may have weakened due to the massive $72 million in ETH short liquidations recorded Wednesday, the broader trend remains uncertain. If ETH fails to break and hold above $2,100, a rejection could trigger a retest of lower support around $1,927, potentially extending losses toward $1,801.
For now, bulls need to establish control above $2,100 to confirm sustained upside potential. A breakout beyond this level could drive ETH into a new uptrend, while failure may see renewed selling pressure in the coming days.
Today, March 5, 2025, Uniswap (UNI) has registered an 8% price gain. However, it appears bearish and is poised for a decline, potentially due to a crypto whale dumping UNI tokens.
Whale Dump $40.60 Million Worth of UNI Tokens
Today, blockchain-based transaction tracker Lookonchain posted on X (formerly Twitter) that a prominent crypto whale, Galaxy Digital, deposited 600K UNI tokens worth $4.37 million onto Binance, the world’s largest cryptocurrency exchange.
Galaxy Digital deposited another 600K $UNI($4.37M) to #Binance and #OKX 30 minutes ago.
However, the main concern driving fears of a price drop is that Galaxy has already deposited a significant 5.29 million UNI tokens worth $40.60 million on Binance and OKX over the past week.
Current Price Momentum
With all this, the asset is trading near $7.37, gaining 8% in the past 24 hours. However, during the same period, its trading volume dropped by 35%, indicating lower participation from traders and investors compared to the previous day. This decline was potentially caused by the sell-off and ongoing price fluctuations.
Uniswap (UNI) Price Action and Upcoming Levels
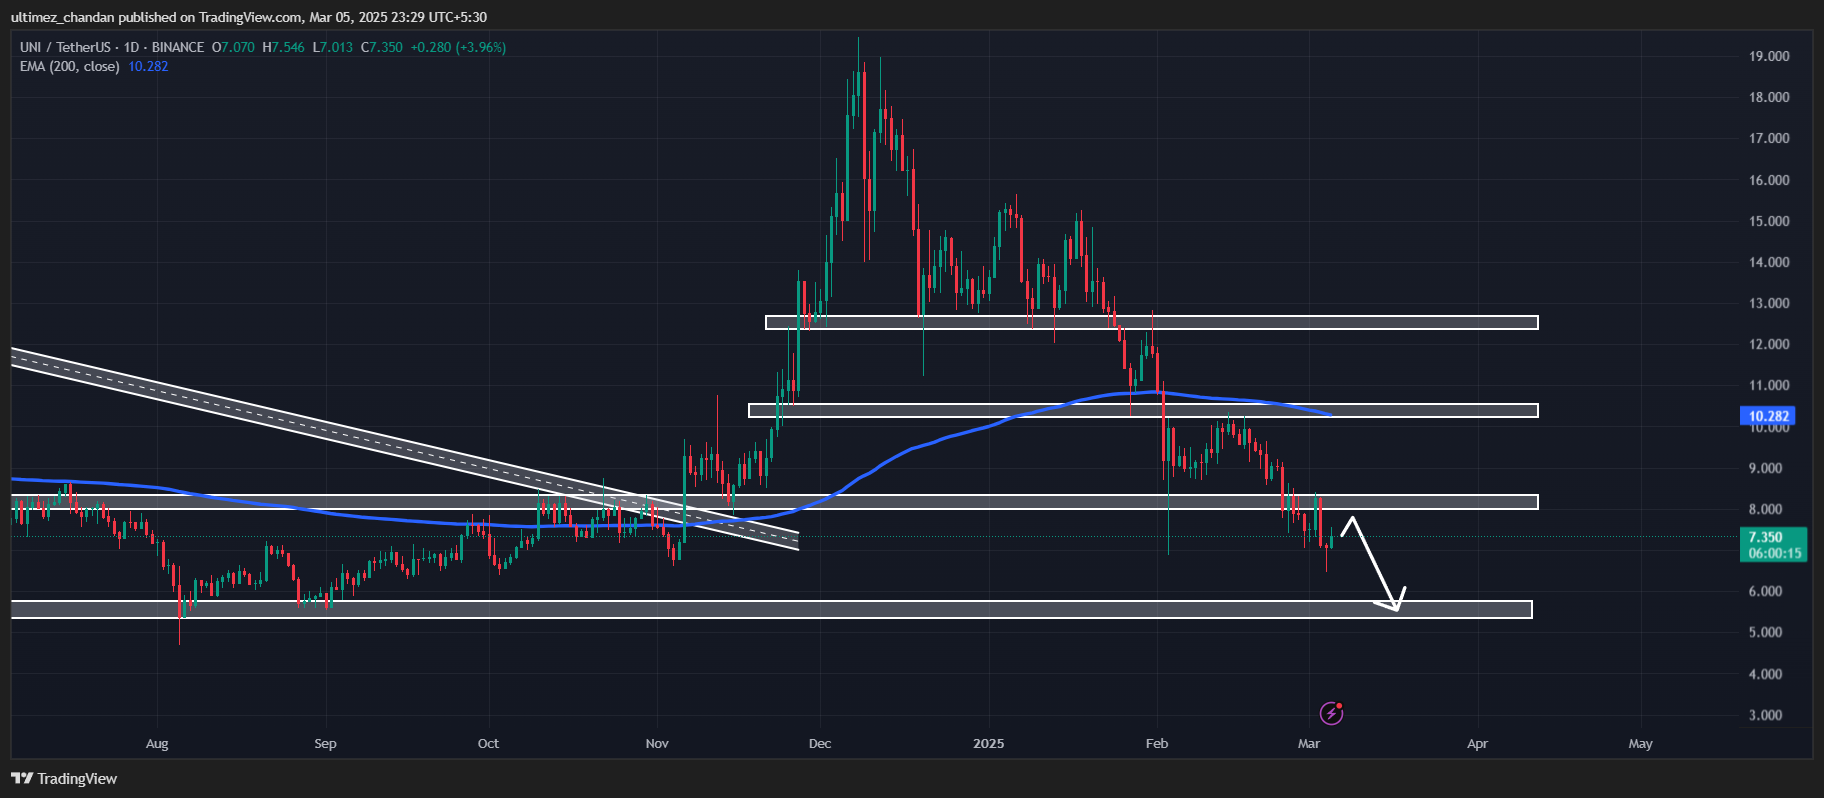
According to expert technical analysis, UNI appears bearish as it is already trading below the crucial support level of $8. With recent price fluctuations, it has retested this level and seems to be consolidating. Based on recent price action and historical patterns, if UNI fails to climb above the $8 level, it could drop by 25% to reach $5.50 in the coming days.
Source: Trading View
As of now, the asset is trading below the 200 Exponential Moving Average (EMA) on the daily timeframe, indicating a bearish trend. This technical indicator helps traders and investors determine whether the asset is in an uptrend or downtrend, allowing them to build their positions accordingly, either on the long or short side.
This ongoing dump by Galaxy Digital has the potential to increase selling pressure, further reinforcing the bearish outlook.
The post Time To Sell Uniswap? Whale Dumps $40 Million Worth UNI appeared first on Coinpedia Fintech News
Today, March 5, 2025, Uniswap (UNI) has registered an 8% price gain. However, it appears bearish and is poised for a decline, potentially due to a crypto whale dumping UNI tokens. Whale Dump $40.60 Million Worth of UNI Tokens Today, blockchain-based transaction tracker Lookonchain posted on X (formerly Twitter) that a prominent crypto whale, Galaxy …
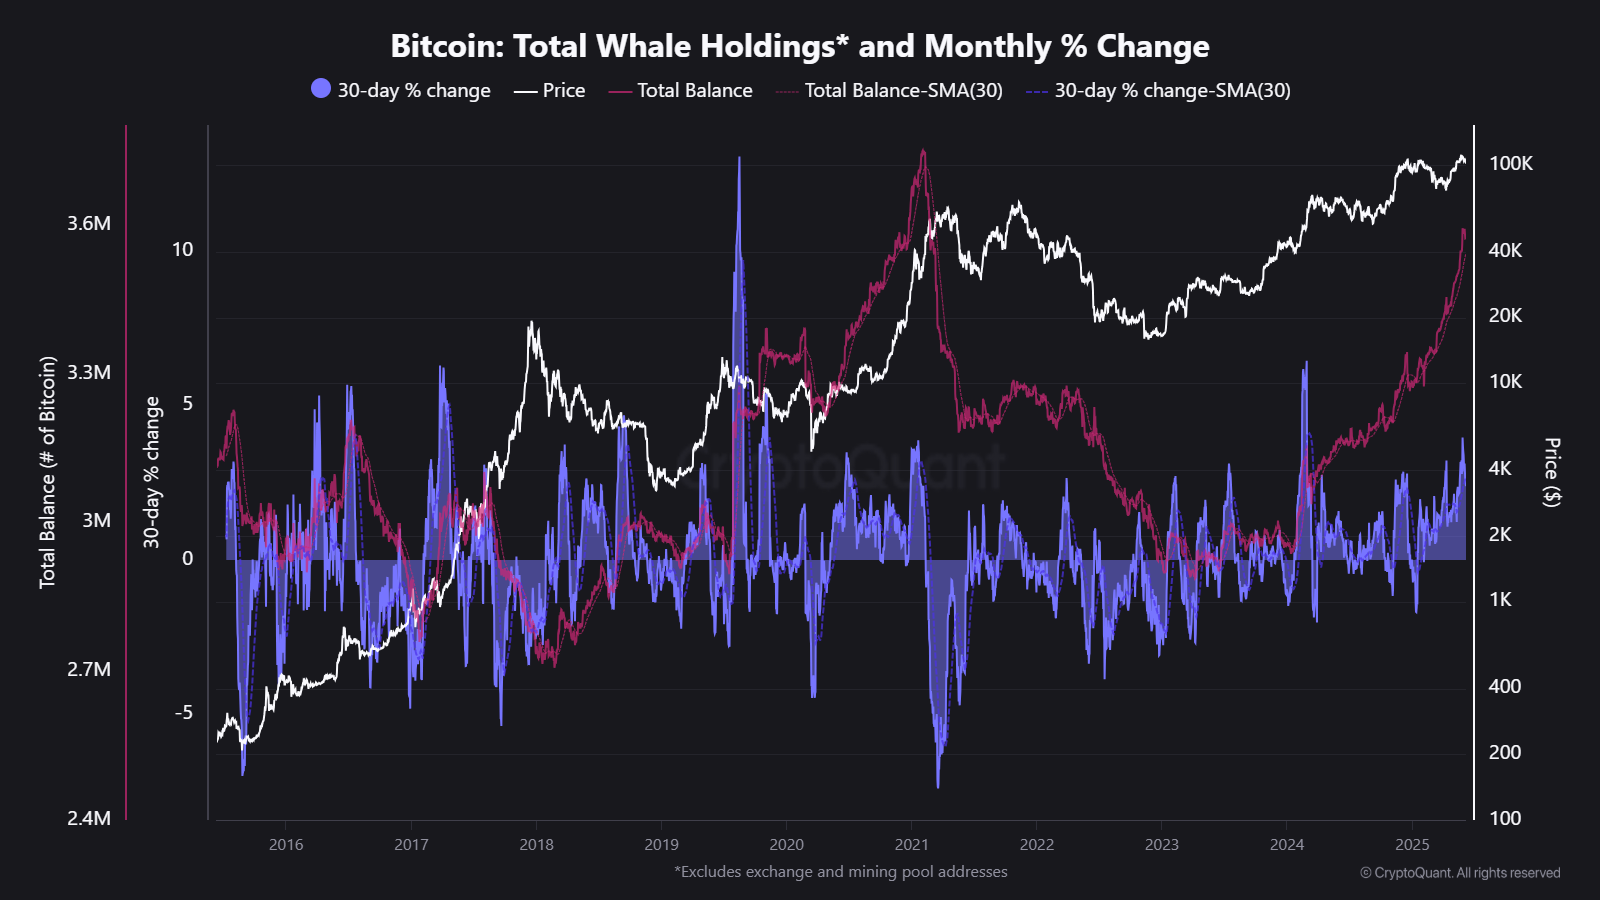
Signals from Bitcoin whales and miners hint at a potential rally on the horizon. New data from CryptoQuant reveals that large Bitcoin holders now hold a balance of 3.57 million BTC.
This approaches the previous high of 3.74 million BTC set in early 2021.
The current uptrend in whale holdings suggests that institutions and high-net-worth investors view dips as buying opportunities and anticipate higher prices ahead.
Total Bitcoin Whale Holdings. Source: CryptoQuant
“This metric reflects the true balances of large holders by excluding exchange and mining pool addresses. This offers a clearer view of strategic accumulation by large investors. Remained growth in whale holdings often signals institutional confidence and strong underlying demand, which are key drivers of longer-term bull cycles,” CryptoQuant analyst JA Maartunn told BeInCyprto.
But not all indicators point upward. According to CryptoQuant, the Hash Ribbons metric—tracking miner stress—recently flashed a buy signal.
This typically reflects short-term turbulence as miners face profitability issues, forcing some to sell Bitcoin to stay operational.
Technical analysts are also optimistic. They highlight a “cup-and-handle” formation on Bitcoin’s daily chart, suggesting a bullish breakout if prices surpass $108,000.
A Buy Signal From the Hash Ribbons!
“We recently got a new buy signal from the Hash Ribbons indicator. This metric helps us assess the level of stress in the Bitcoin mining ecosystem.” – By @Darkfost_Cocpic.twitter.com/O6jrwfXfHq
Moreover, institutional activity supports this bullish outlook. Bitcoin futures open interest rose by more than $2 billion in recent days, while funding rates stayed low.
This scenario creates fertile ground for a potential short squeeze.
Will BTC Hold the $100,000 Psychological Support?
For now, the whale accumulation and miner stress data identify a clear trading range. Strong support sits between $100,000 and $102,000.
This means BTC will likely maintain its $100,000 psychological level even during short-term corrections.
Meanwhile, resistance awaits at the $108,000–$110,000 zone, where a breakout could accelerate prices toward $120,000.
Traders should watch closely for catalysts, such as further miner selling, as these could swiftly influence price action.
Additionally, macroeconomic headlines involving the Fed and global trade dynamics will likely keep volatility elevated.