The push to advance the digital currency ecosystem has taken a new twist. Reps. Tom Emmer and Ritchie Torres have introduced a new blockchain and crypto regulation bill directed at developers. Dubbed the Blockchain Regulatory Certainty Act (BRCA), this bill is the second time it will be introduced in Congress and clarifies the definition of money transmitters, which concerns developers. The BRCA Blockchain Bill: Key Highlight This bill aims to establish that developers who do not custody user funds are not money transmitters. Notably, it provides the necessary legal clarity to position the United States as the top hub for developers. “If you don’t custody consumer funds, you aren’t a money transmitter. Plain and simple,” Congressman Emmer said in an official statement. “The longer we delay this commonsense clarification, the greater the risk that this transformative technology is pushed overseas, harming American investors and innovators.” Providing more context, the lawmaker… Read More at Coingape.com
Pi Network (PI) has seen a modest 5% gain over the past week, despite being down more than 17% in the last 30 days. This bounce has brought some relief but hasn’t yet translated into a clear bullish reversal.
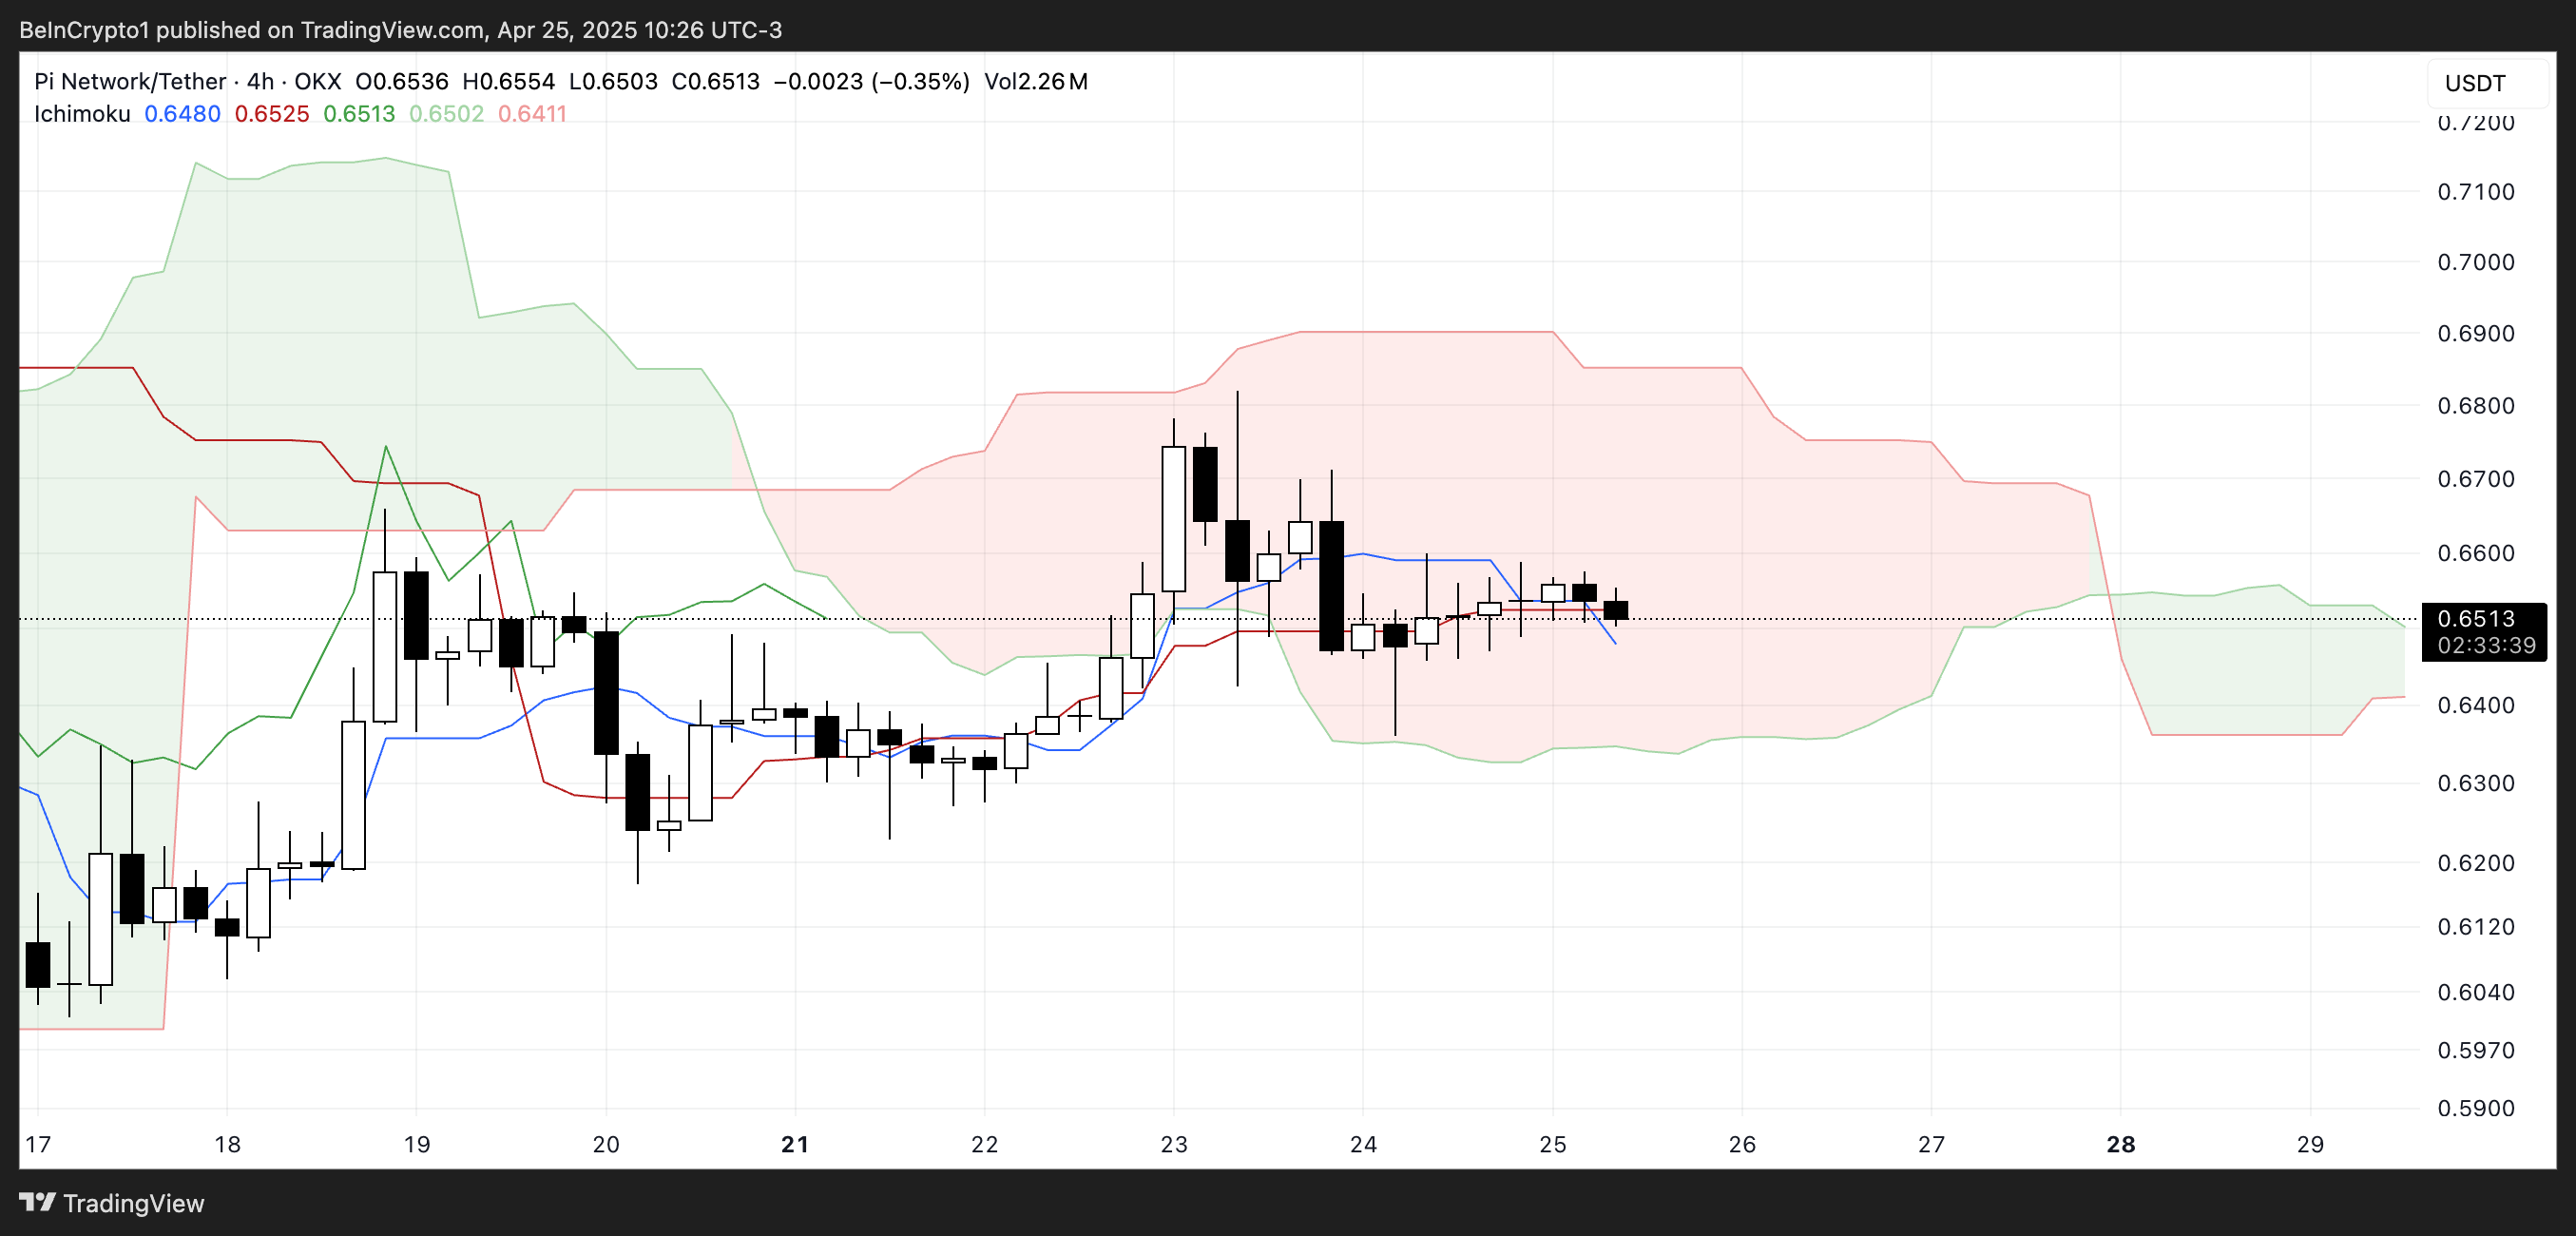
The price is currently consolidating between key levels, with technical indicators like the Ichimoku Cloud, RSI, and EMA lines all pointing to indecision. Whether this consolidation leads to a breakout or further downside could depend on how PI reacts to resistance at $0.68 and support at $0.617 in the coming sessions.
Ichimoku Signals Uncertainty for PI
Pi Network trades inside the red Ichimoku Cloud, reflecting indecision and a lack of strong directional bias.
The price sits between the red baseline (Kijun-sen) and just above the blue conversion line (Tenkan-sen), indicating weak short-term momentum but no clear breakdown.
The presence of the red cloud shows that the prevailing trend is still slightly bearish, and price action within the cloud generally signals consolidation or neutrality.
A green cloud in the future points to a potential bullish transition, but only if the price manages to break above the cloud with strong follow-through.
A decisive move above the cloud would support a trend reversal, while a rejection and move below the Tenkan-sen and Kijun-sen would reinforce bearish pressure.
PI RSI Cools Off: What Comes Next?
Pi Network’s Relative Strength Index (RSI) is currently sitting at 51.41, falling from a high of 70 just two days ago.
This drop reflects a noticeable momentum cooling, as the asset moved from near-overbought territory to more neutral levels.
The RSI measures the speed and magnitude of recent price changes to evaluate overbought or oversold conditions. Values above 70 are generally considered overbought, and those below 30 are considered oversold.
An RSI at 51.41 places PI right in the middle of the range, suggesting that neither buyers nor sellers currently have a clear advantage.
This neutral reading often coincides with a consolidation phase, where the price stabilizes before deciding its next direction. If the RSI trends again, it could point to renewed bullish momentum.
On the other hand, continued decline toward 40 or below may signal growing weakness and open the door for a deeper pullback.
PI Consolidates—Is a Breakout Coming?
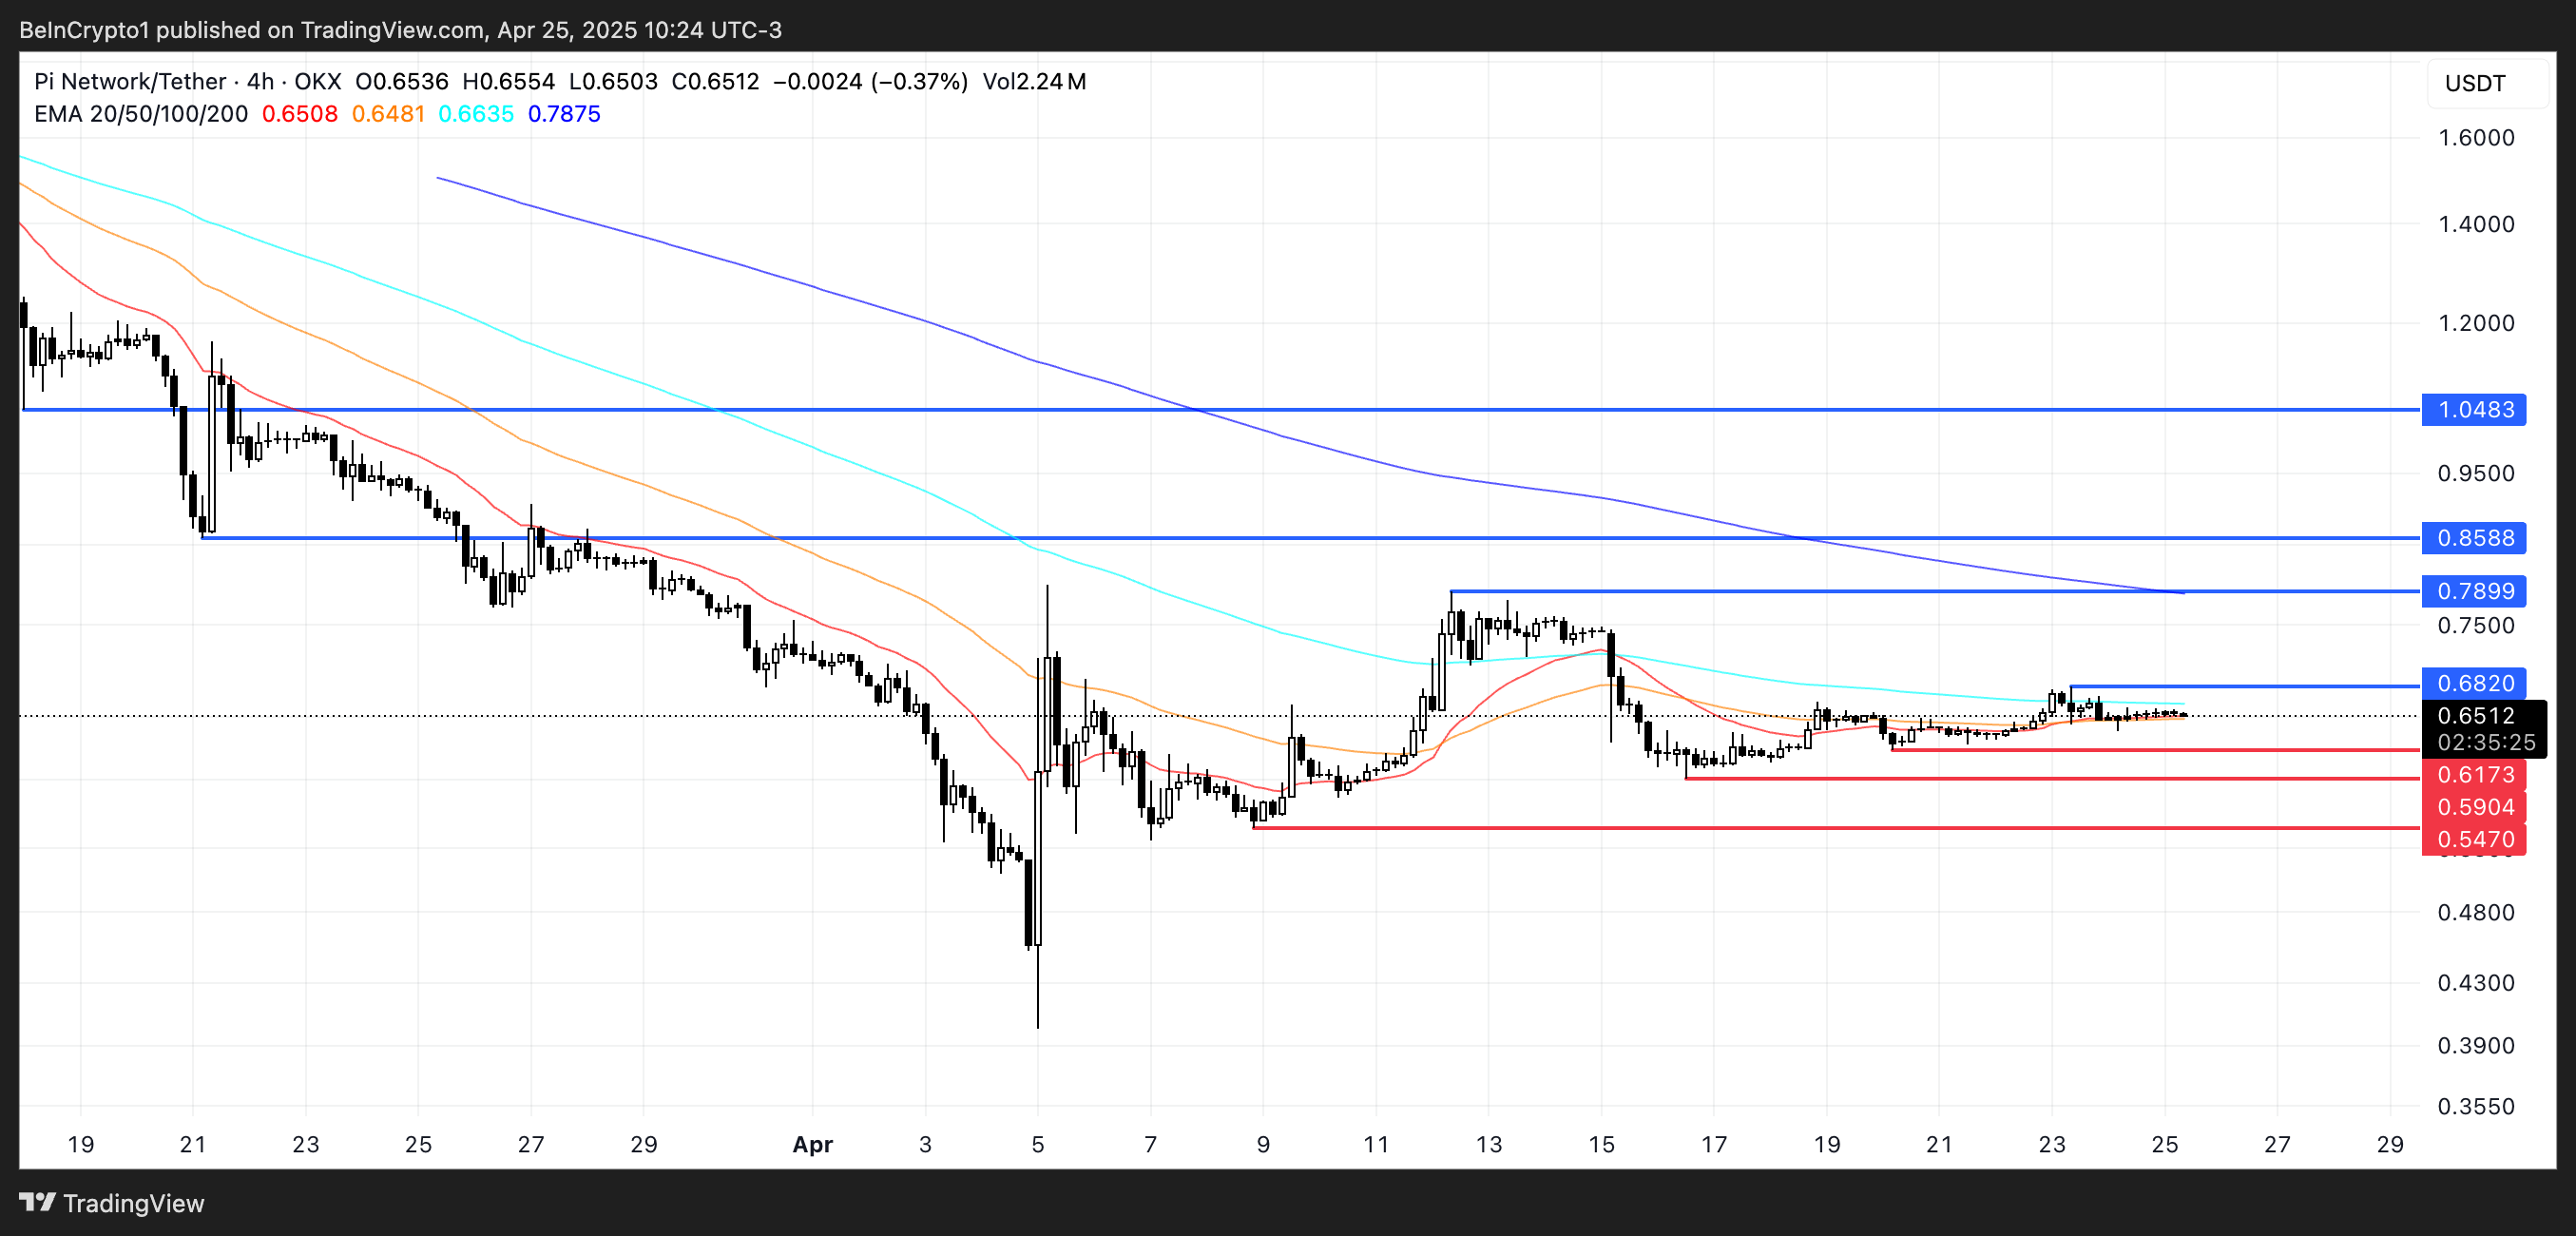
Pi Network price has been consolidating over the past few days, currently trading within a range defined by resistance at $0.68 and support at $0.61.
This sideways movement is reflected in the EMA lines, which are clustered closely together—a classic sign of low volatility and a lack of strong directional momentum.
If bullish momentum returns, a breakout above $0.68 could signal the start of a fresh rally.
In that case, the next resistance levels to watch are $0.789 and $0.85. If the uptrend strengthens further, PI could target $1.04—marking its first move above $1 since March 23.
However, a breakdown below the $0.617 support could lead to renewed bearish pressure, with $0.59 and $0.54 as the next potential downside targets.
US Treasury Secretary Scott Bessent was sharply questioned today by the House Financial Services Committee about Trump-affiliated World Liberty Financial (WLFI) and its new USD1 stablecoin. Congressional Democrats questioned Bessent whether no-interest stablecoins linked to Trump’s crypto ventures could mask hidden subsidies.
Bessent Scrutinized Over President Trump’s World Liberty Financial
World Liberty Financial, founded in 2024 with close Trump‑family ties, raised about $550 million in late 2024 by selling its governance token. The Trump family is entitled to roughly 75% of net revenues.
In March, WLFI launched USD1, a dollar‑pegged token backed by US Treasuries and cash equivalents.
Within weeks, Abu Dhabi’s state‑backed MGX agreed to deploy $2 billion of USD1 on Binance, instantly pushing USD1 into the top tier of stablecoins by market cap.
Rep. Brad Sherman noted that at a 4% market rate, the deal effectively grants WLFI and its Trump owners an $80 million annual subsidy. He asked whether this “interest‑free loan” should count as hidden support.
“Abu Dhabi just announced that they were going to give $2 billion to a stablecoin put forward by World Liberty Financial, and it pays no interest. So you and I are both finance people. Just want to check my math, assuming a 4% rate of return. Is this interest‑free loan of $2 billion worth $80 million every year to WLFI and its Trump owners?” Sherman said.
To his knowledge, Bessent said he had not reviewed the token’s expense ratio and maintained that no stablecoins pay interest. He added that no regulator has formally labeled such purchases as hidden subsidies.
Lawmakers warned this structure could mask political favors. They urged the Treasury to clarify when stablecoin deals cross into improper support.
The hearing drew on a New York Times investigation. That report revealed secret multimillion‑dollar “endorsement” pitches under the Trump name, sales to foreign firms, and policy shifts benefiting WLFI.
It said WLFI crossed the boundary between private enterprise and government policy without precedent.
“In a statement, a spokeswoman for President Trump noted that his assets are in a trust managed by his children. And as a result, there are no conflicts of interest. The trust still benefits President Trump directly,” the NY Times report claimed.
Democrats on the committee said they will pursue legislation that requires full expense‑ratio disclosures for stablecoins. They also want to ban no‑interest structures that serve as de facto subsidies.
Such rules, they argue, are vital to ensure transparency and prevent conflicts when politically connected firms enter crypto markets.
BeInCrypto has reached out to World Liberty Financial to understand their stance on such allegations and scrutiny.
Bitcoin (BTC) and most of the top altcoins have made significant gains this week as global financial markets show signs of a recovery despite the ongoing fears of the US and China not reaching a trade deal. Most importantly, the S&P500 index is repeating a 1998 pattern where a V-shaped recovery ensued after a sharp market decline. As risk assets rebound, here is what traders should expect from BTC, ETH, XRP and SOL price.
S&P500 Index Mirrors 1998 Cycle
Analyst Julien Bittel on X noted that the S&P500 index underwent a correction that mirrors what happened in 1998 when financial markets crashed after Russia defaulted on debt. This crash caused the market sentiment to become overly bearish before a rally ensued to form a V-shaped recovery.
S&P 500
Bittel noted that this pattern appears to be in play again as the stock and crypto markets record price gains. After hitting lows in April following fear around the US-China trade war, the S&P500 has bounced by 12%, the Nasdaq 100 is up 15%, while the BTC price has surged by 26%.
If this pattern plays out like it did nearly three decades ago, it would mean that a parabolic rally for risk assets. However, the US dollar continues to struggle after the recent DXY decline to a four-year low, indicating that tariffs remain a major risk to US economic growth. This may cause investors to adopt a risk-off stance, which will impact Bitcoin and altcoins.
The risk of the US economy falling into a recession this year also remains high, with data from Polymarket showing that 63% of traders anticipate this event to happen in 2025. At the same time, the lack of any breakthrough in the ongoing China-US trade war suggests that investor confidence remains low, and this may have an effect on the S&P500 and how crypto prices perform in the short term.
Bitcoin Price Technical Analysis as Bulls Eye $115,000
The Bitcoin daily price chart shows that the bullish momentum is strong after the RSI broke out from a falling wedge pattern, and eyes a 21% surge to $115,000. The RSI further supports the bullish Bitcoin price prediction after soaring to 70, marking its highest level in 2025.
As BTC rallies, it first needs to overcome resistance at $99,689. Doing so will confirm the momentum and the breakout from the falling wedge, and if it crosses the psychological level of $100,000, a new all-time high will be in sight.
Ethereum’s weekly price chart shows that the largest altcoin remains under bearish pressure despite its bounce from the recent lows below $1,400 after the S&P500 fueled financial market recovery. If it can sustain the upward momentum, it may surge past $2,120 before aiming for the next resistance of $2,800.
However, the RSI and the MACD show a grim outlook. The RSI has plunged to 38, suggesting that ETH is under a bearish momentum, while the MACD is also negative, confirming this bearish thesis. To confirm a bullish Ethereum price prediction, both the RSI and MACD need to cross into bull territory.
ETH/USDT: 1-Week Chart
XRP Price Technical Analysis as Ripple Eyes $3
The daily XRP price chart also shows that an upward trend may be what’s next for this top altcoin after breaking out of a symmetrical triangle pattern. This breakout hints towards an 11% rally to resistance at $2.50. If Ripple flips this resistance level, it may form the next bullish break past $2.93 to potentially create new highs, with this formation supporting a bullish XRP price forecast.
XRP/USDT: 1-day Chart
Solana Price Technical Analysis
Solana price also eyes massive gains alongside the S&P500, with the monthly chart indicating that a parabolic 2,440% rally is looming that may push SOL past $400. This upswing is seen in the rounding bottom pattern, where a breakout to these highs will be confirmed if SOL overcomes resistance at the neckline of $208.
SOL/USDT: 1M Chart
Summary of Impact of S&P500 on Crypto Prices
The S&P500 is mirroring the 1998 cycle, where the index rebounded with a V-shaped recovery after experiencing a sharp decline. If history rhymes, this index may be on the verge of an upswing that may bode well for other risk assets, including BTC, ETH, XRP, and SOL, as these altcoins anticipate gains.