A $160 million crypto prediction market on Polymarket has sparked wide criticism after a dispute over whether Ukrainian President Volodymyr Zelenskyy wore a suit at a NATO summit in June 2025. The market, which asked users to bet on whether Zelenskyy would wear a suit before July, is now facing backlash from users and observers
Airdrop activity continues to heat up, with three newly launched tokens—SXT, RIZE, and DOOD—drawing investor attention in the fourth week of May. Space and Time launched its SXT token with an airdrop as a part of the new Chainlink rewards program.
Meanwhile, RIZE powers the Rizenet ecosystem, which is focused on tokenization and decentralized AI. DOOD, the native token of the Doodles NFT collection, joins the wave of NFT projects following the footsteps of APE and PENGU.
Space and Time (SXT)
The latest Space and Time (SXT) airdrop launched on May 8, 2025, as part of its official token generation event (TGE). The airdrop is integrated with Binance Launchpool and Chainlink’s new Rewards program.
The project is distributing 200 million SXT tokens into two batches, representing 4% of the total supply. Eligible users include participants in the Chainlink ecosystem, including LINK stakers, users who engaged in Space and Time’s testnet, and held Community NFTs.
Also, the SXT airdrop claim will be live until June 22.
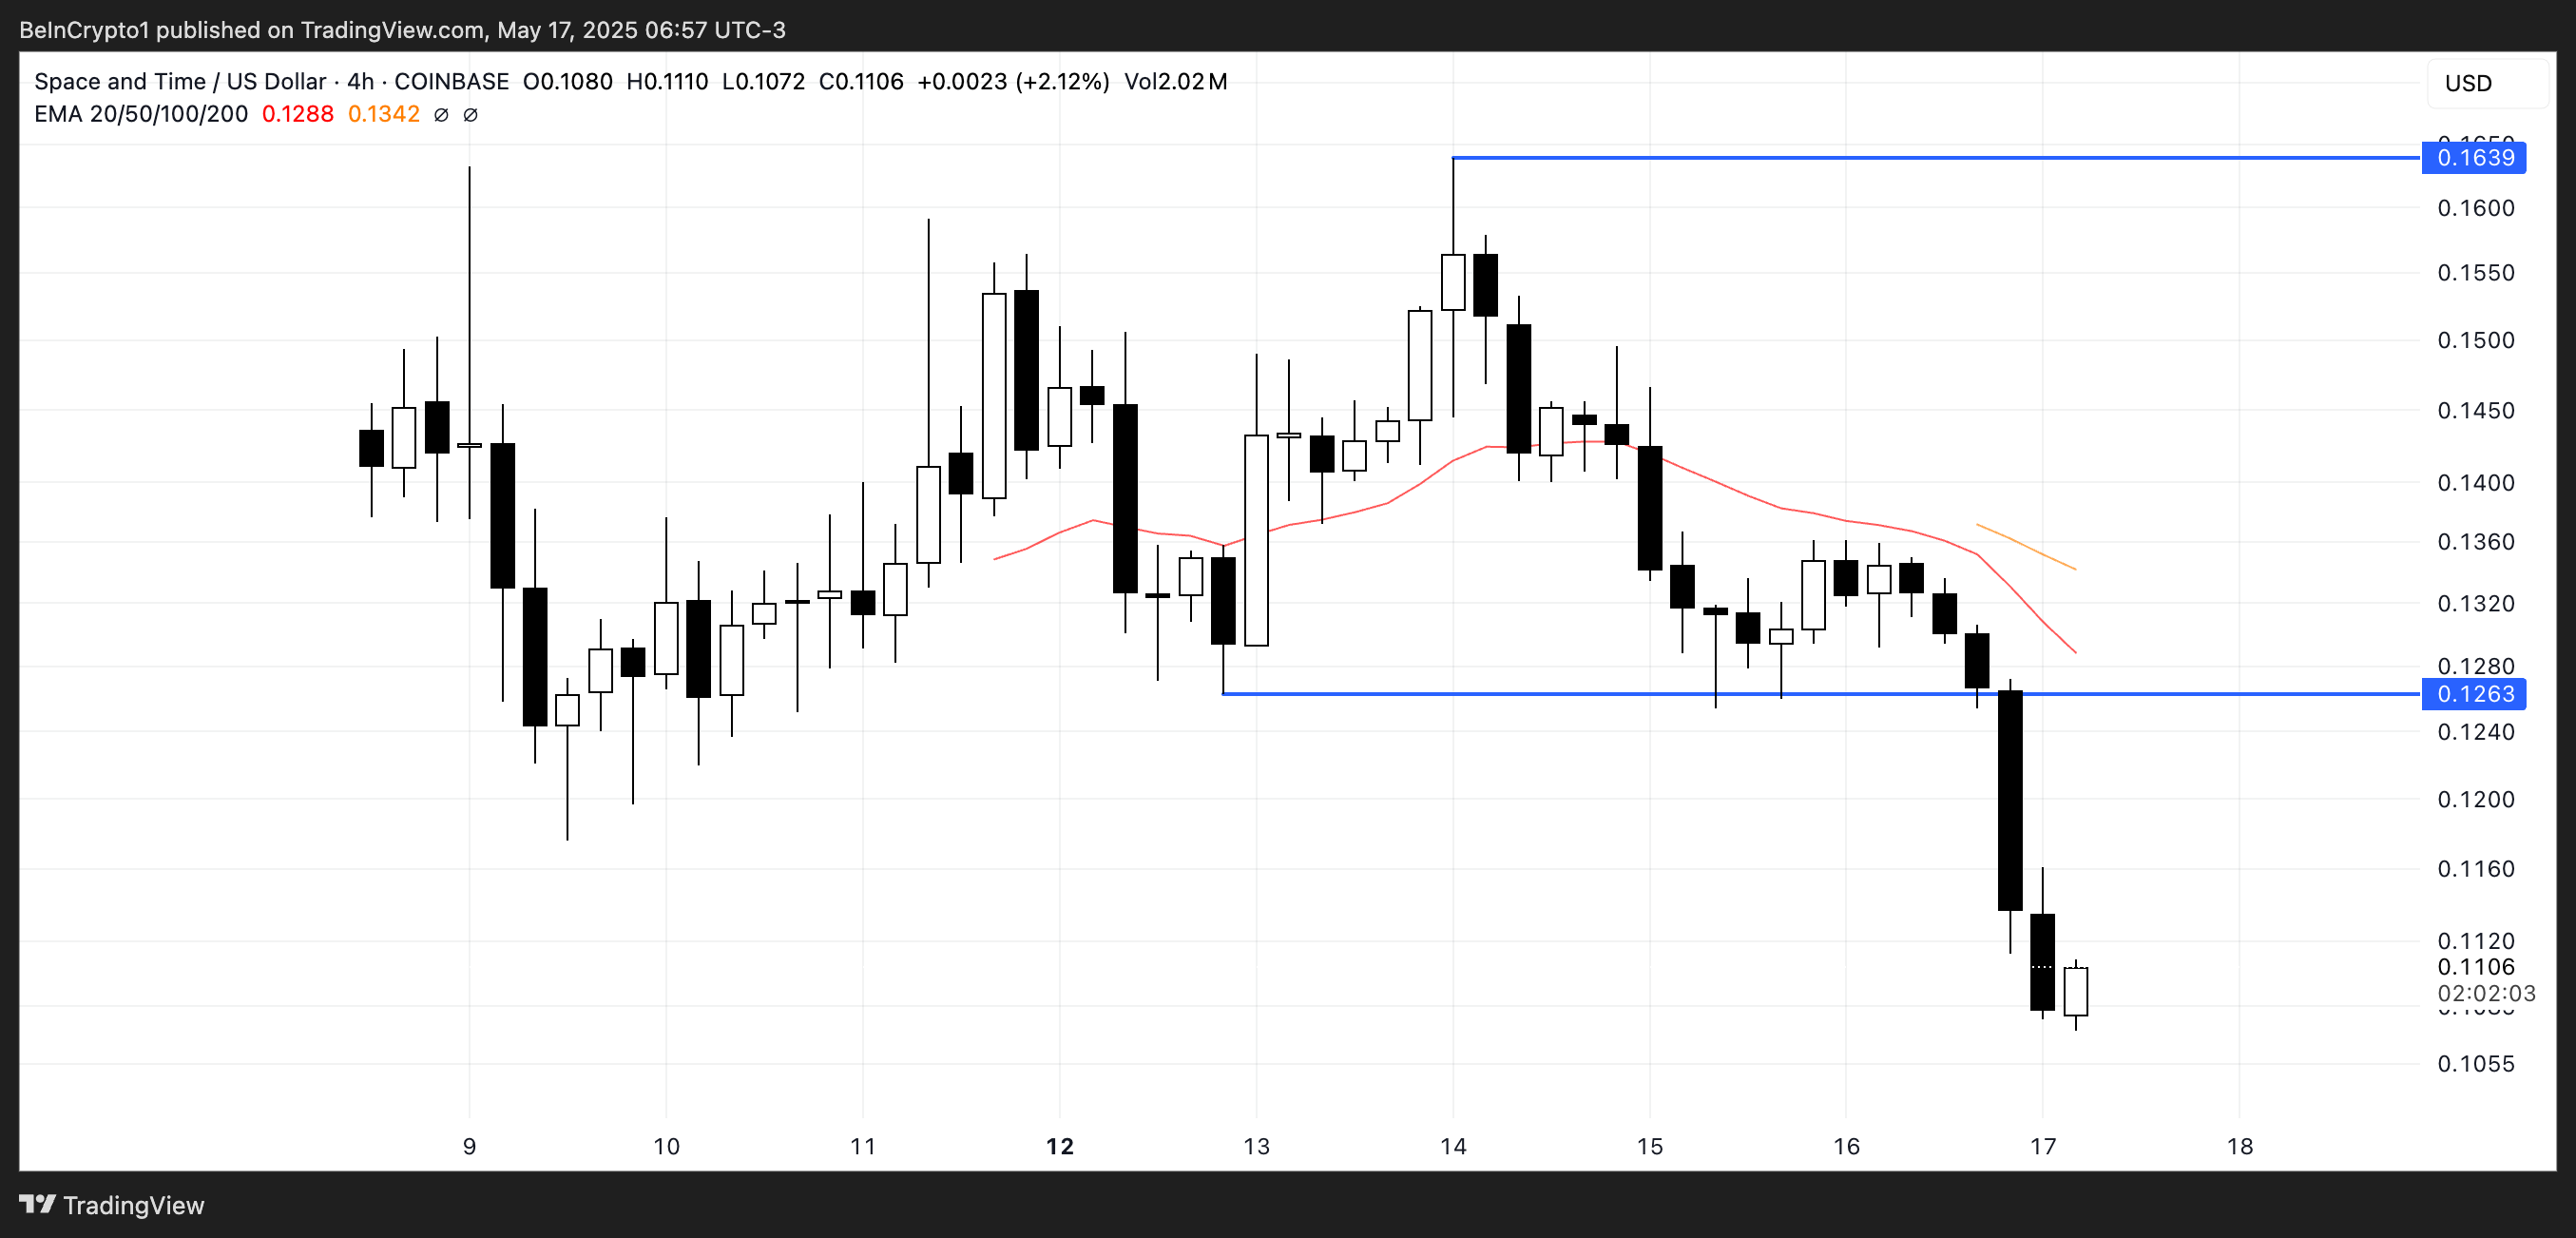
SXT has been down since its airdrop, and if the correction continues, it could soon start trading below $0.10.
It needs a strong buying pressure to return to levels around $0.126, and if that one is broken, it could rise back to test the resistance around $0.163.
RIZE
RIZE is the native utility token of Rizenet, a decentralized platform for tokenizing real-world assets (RWAs), decentralized AI (DeAI), and DeFi.
The $RIZE token has multiple uses. It pays for tokenization services, grants access to tokenized assets, enables governance through token locking, and rewards contributions to decentralized AI models. RIZE is currently live on Kraken and Aerodrome.
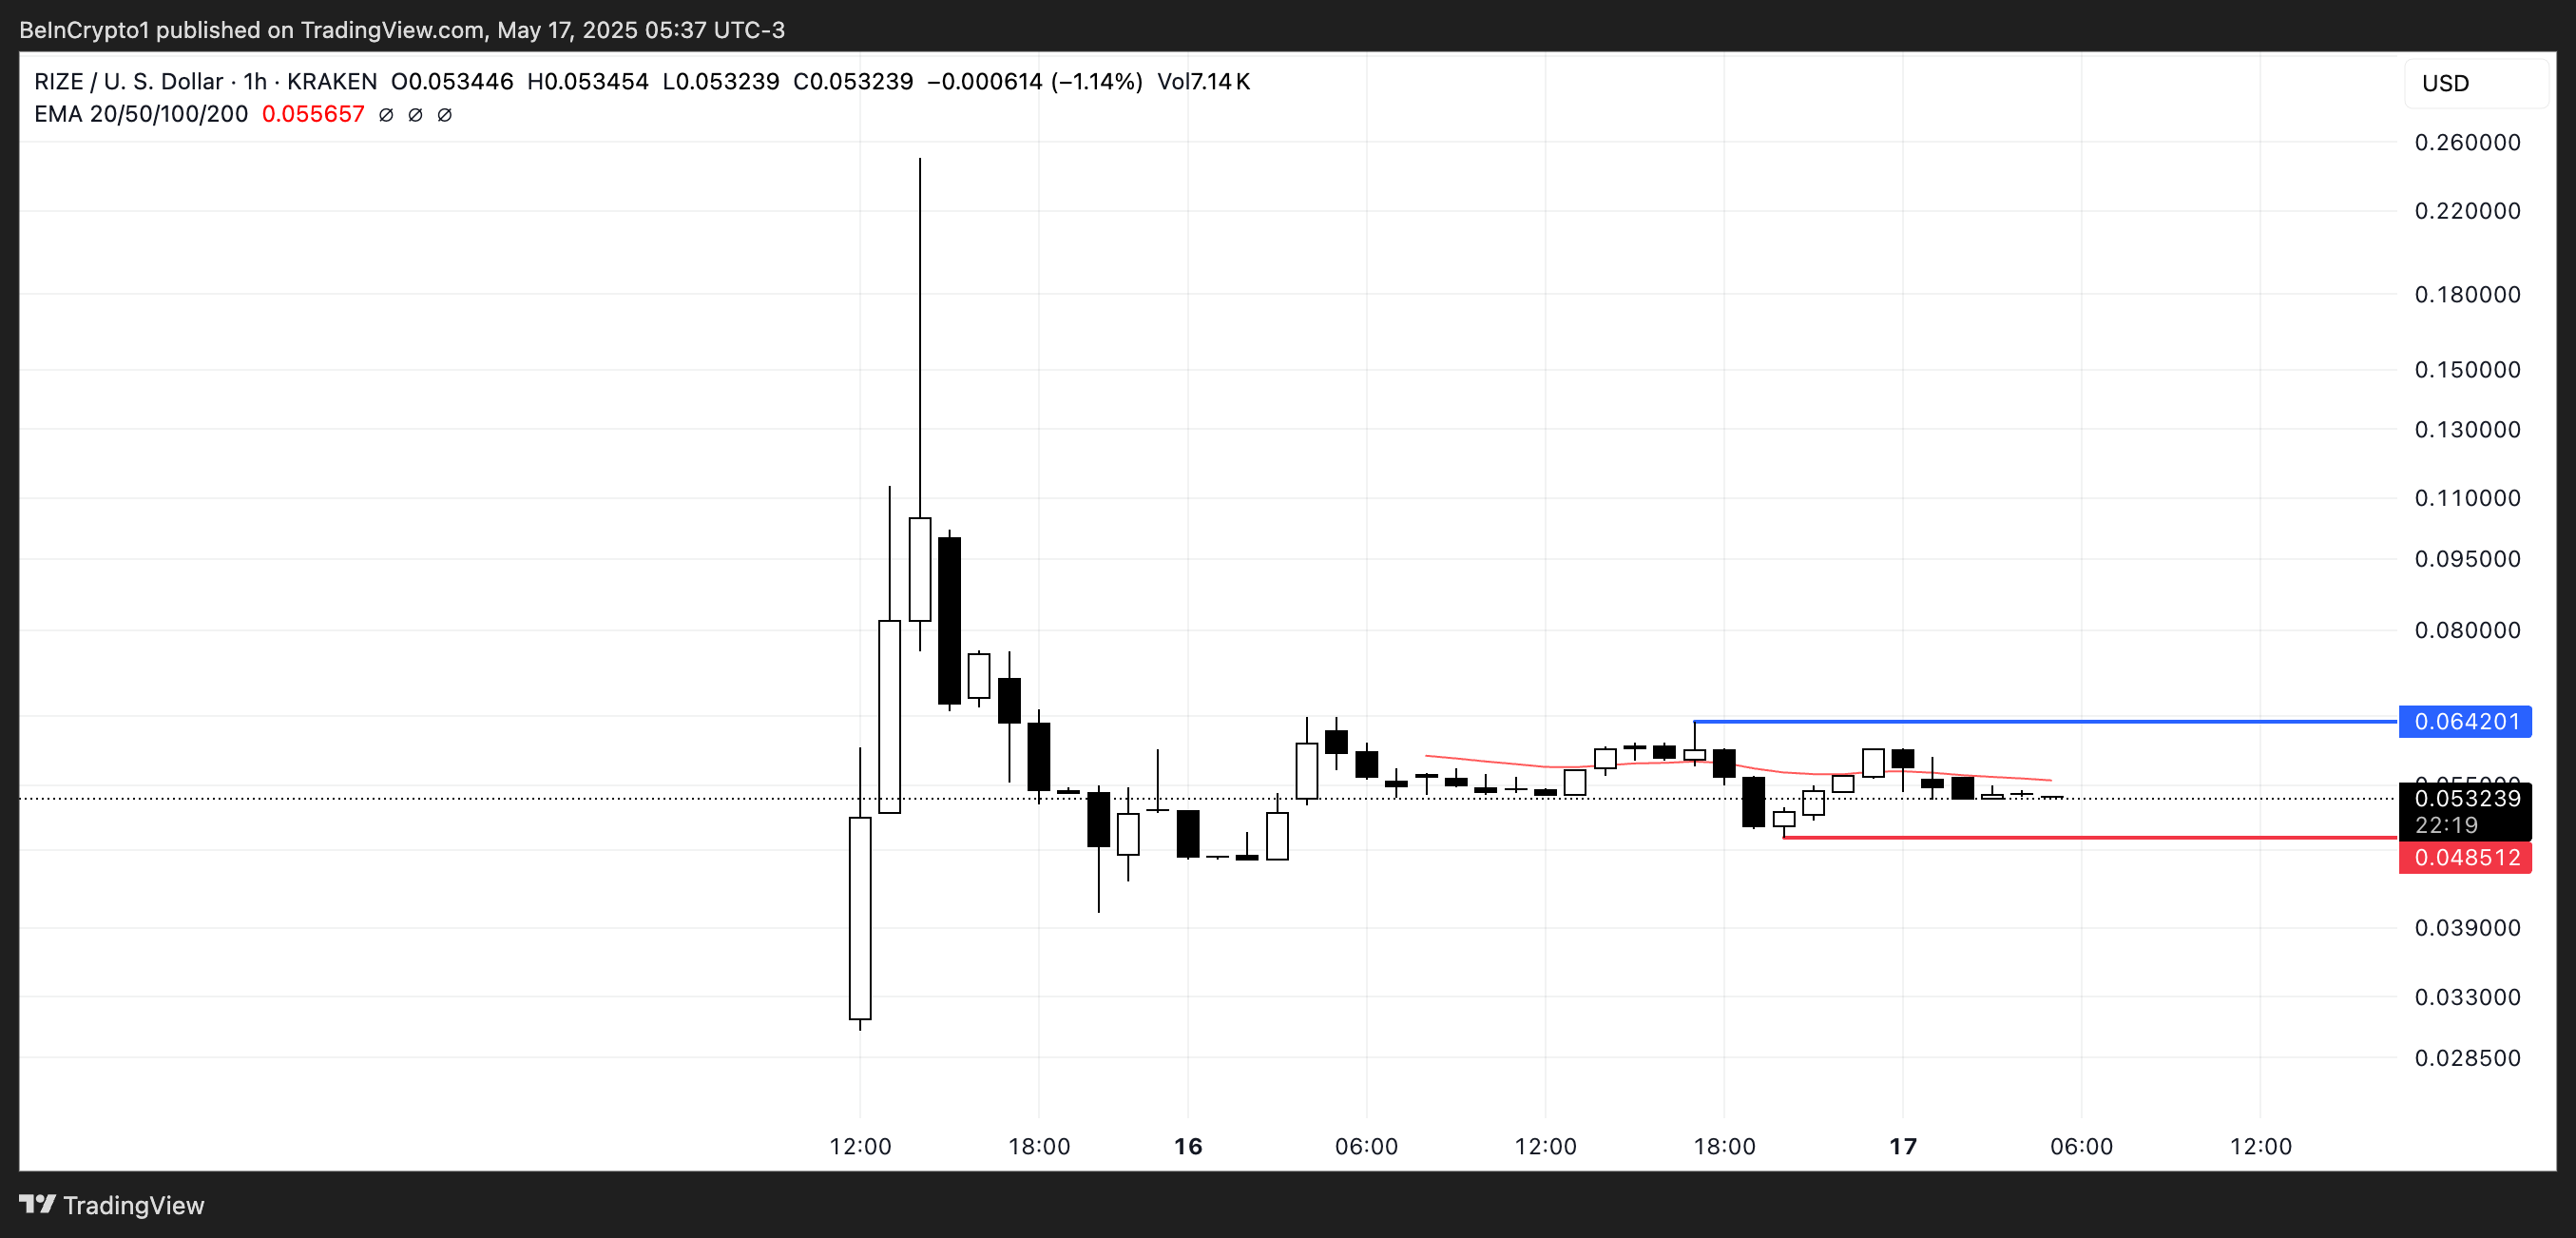
From a technical standpoint, the RIZE token is at a critical point. If it manages to break through the resistance level at $0.064, bullish momentum could drive the price back toward the $0.10 region.
However, failure to maintain its current support at $0.0485 may trigger a downside move, with potential losses extending below the $0.040 mark.
Doodles
Doodles is a well-known NFT collection that originally gained popularity for its colorful, hand-drawn characters and strong community engagement.
It recently launched its own token, DOOD, marking its entry into the growing trend of NFT-native tokens—a path first carved out by Bored Ape Yacht Club with APE and later followed by Pudgy Penguins with the PENGU token in 2024.
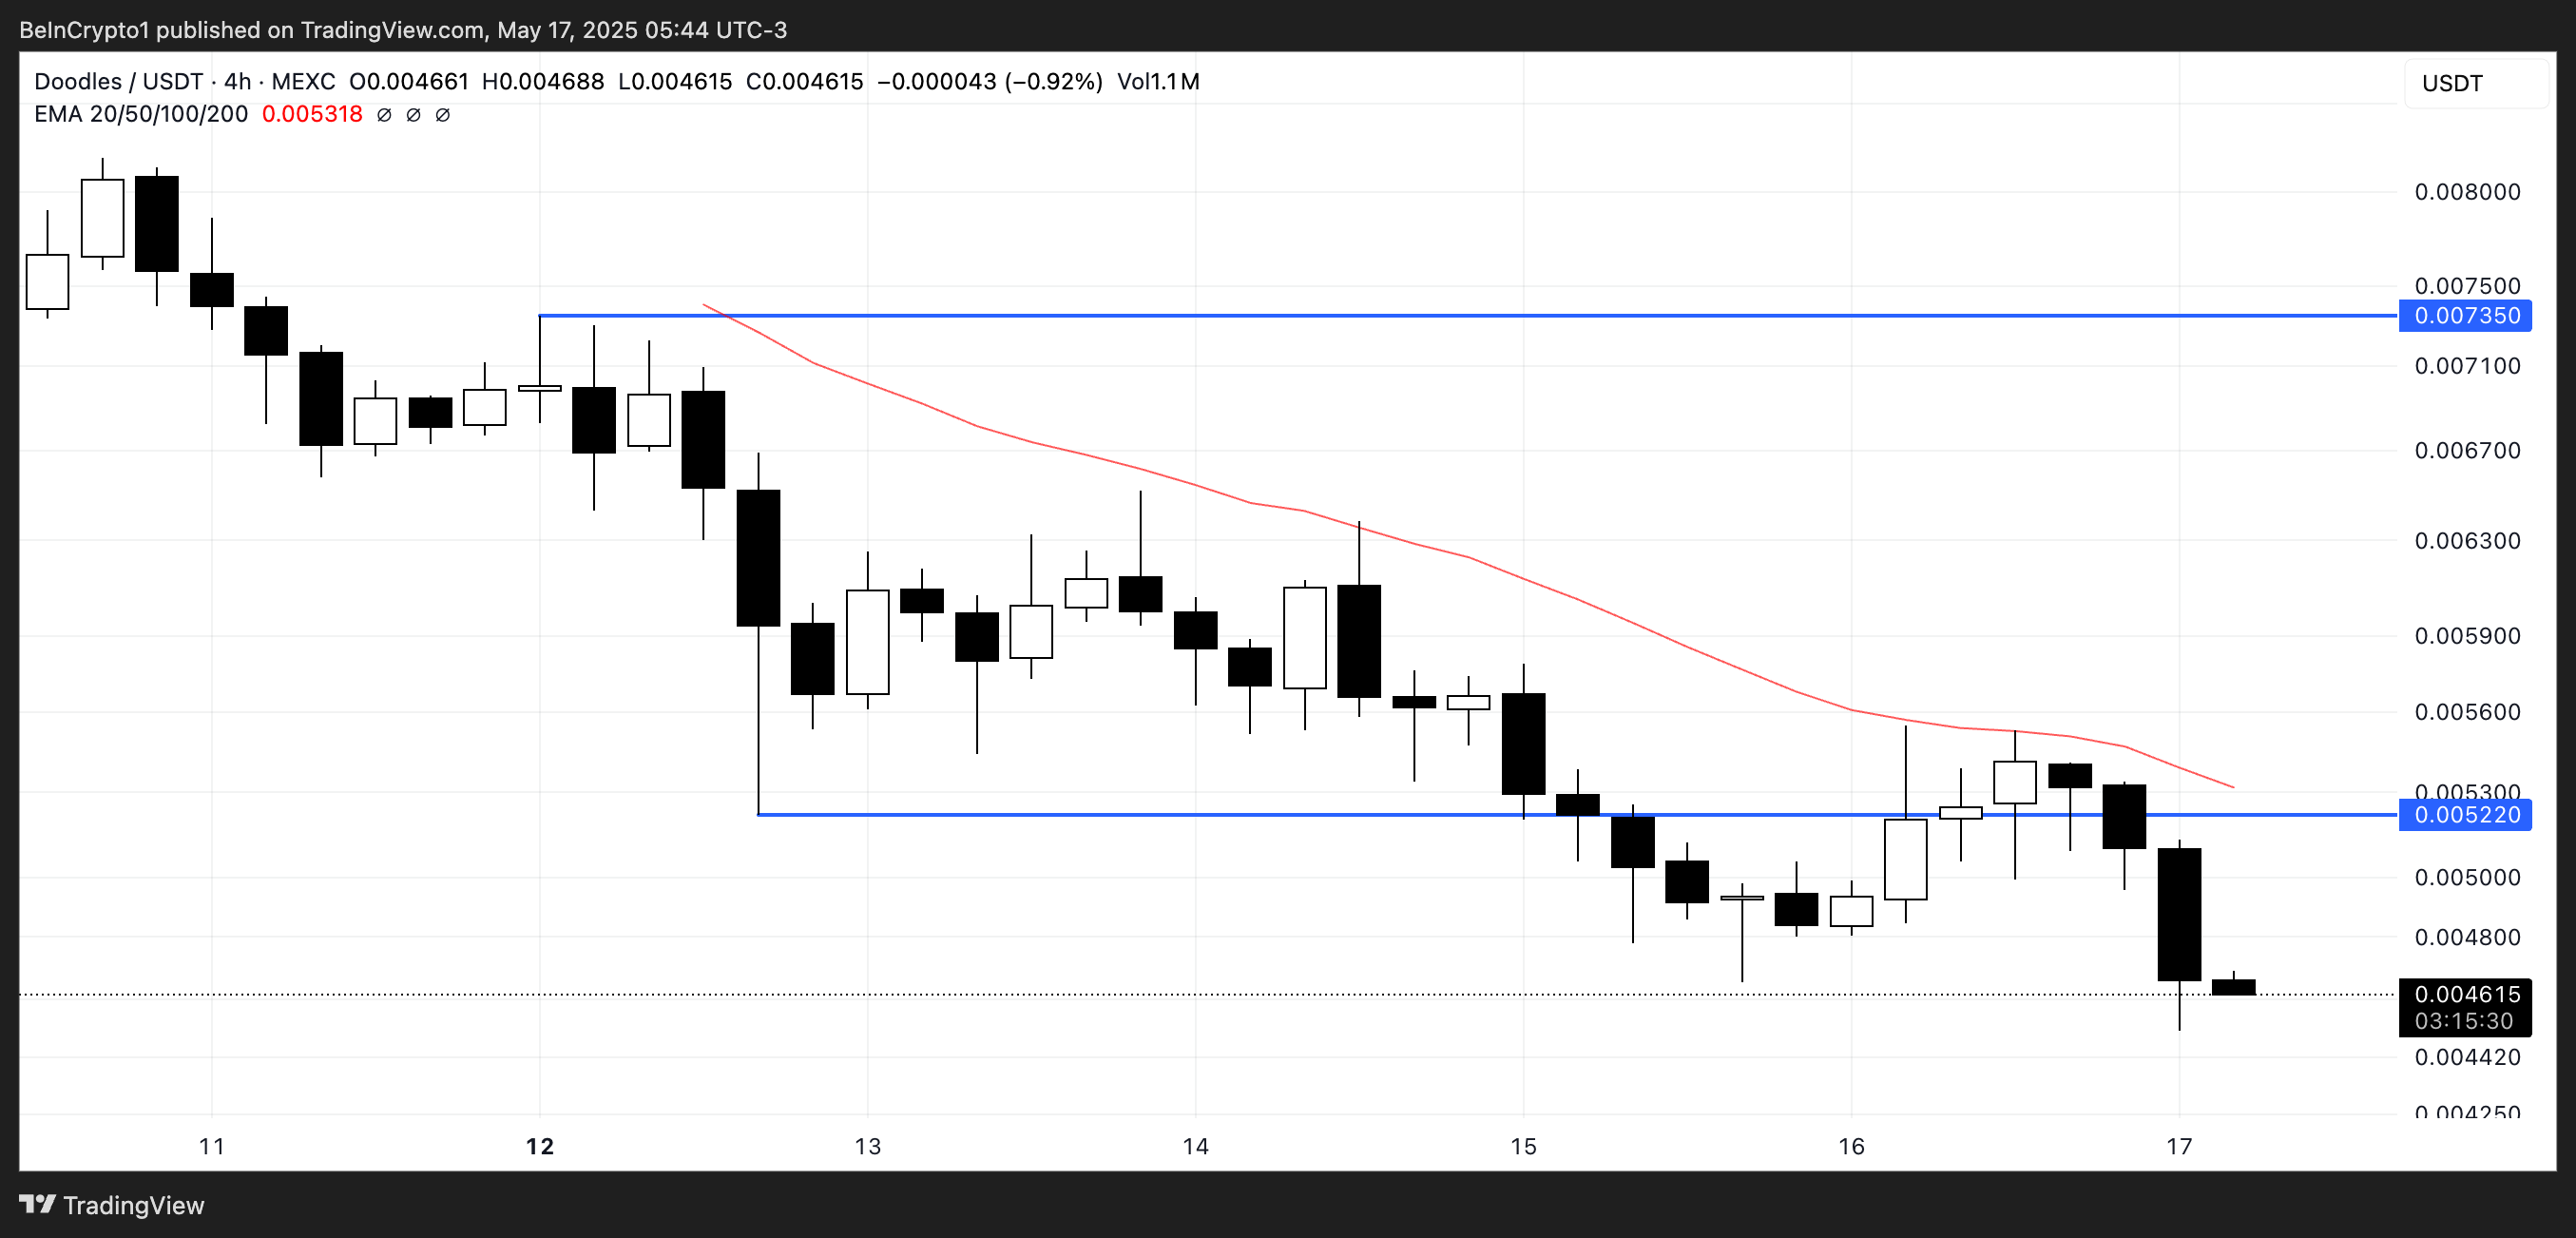
Despite the initial excitement surrounding the DOOD airdrop, the token has struggled to maintain upward momentum, falling 35% over the last five days.
The price now faces a key resistance at $0.0052—breaking above this level would be necessary to signal a potential recovery and open the door for a move toward $0.00735.
However, continued bearish pressure could push DOOD below the $0.0040 support, marking new lows and further eroding market confidence.