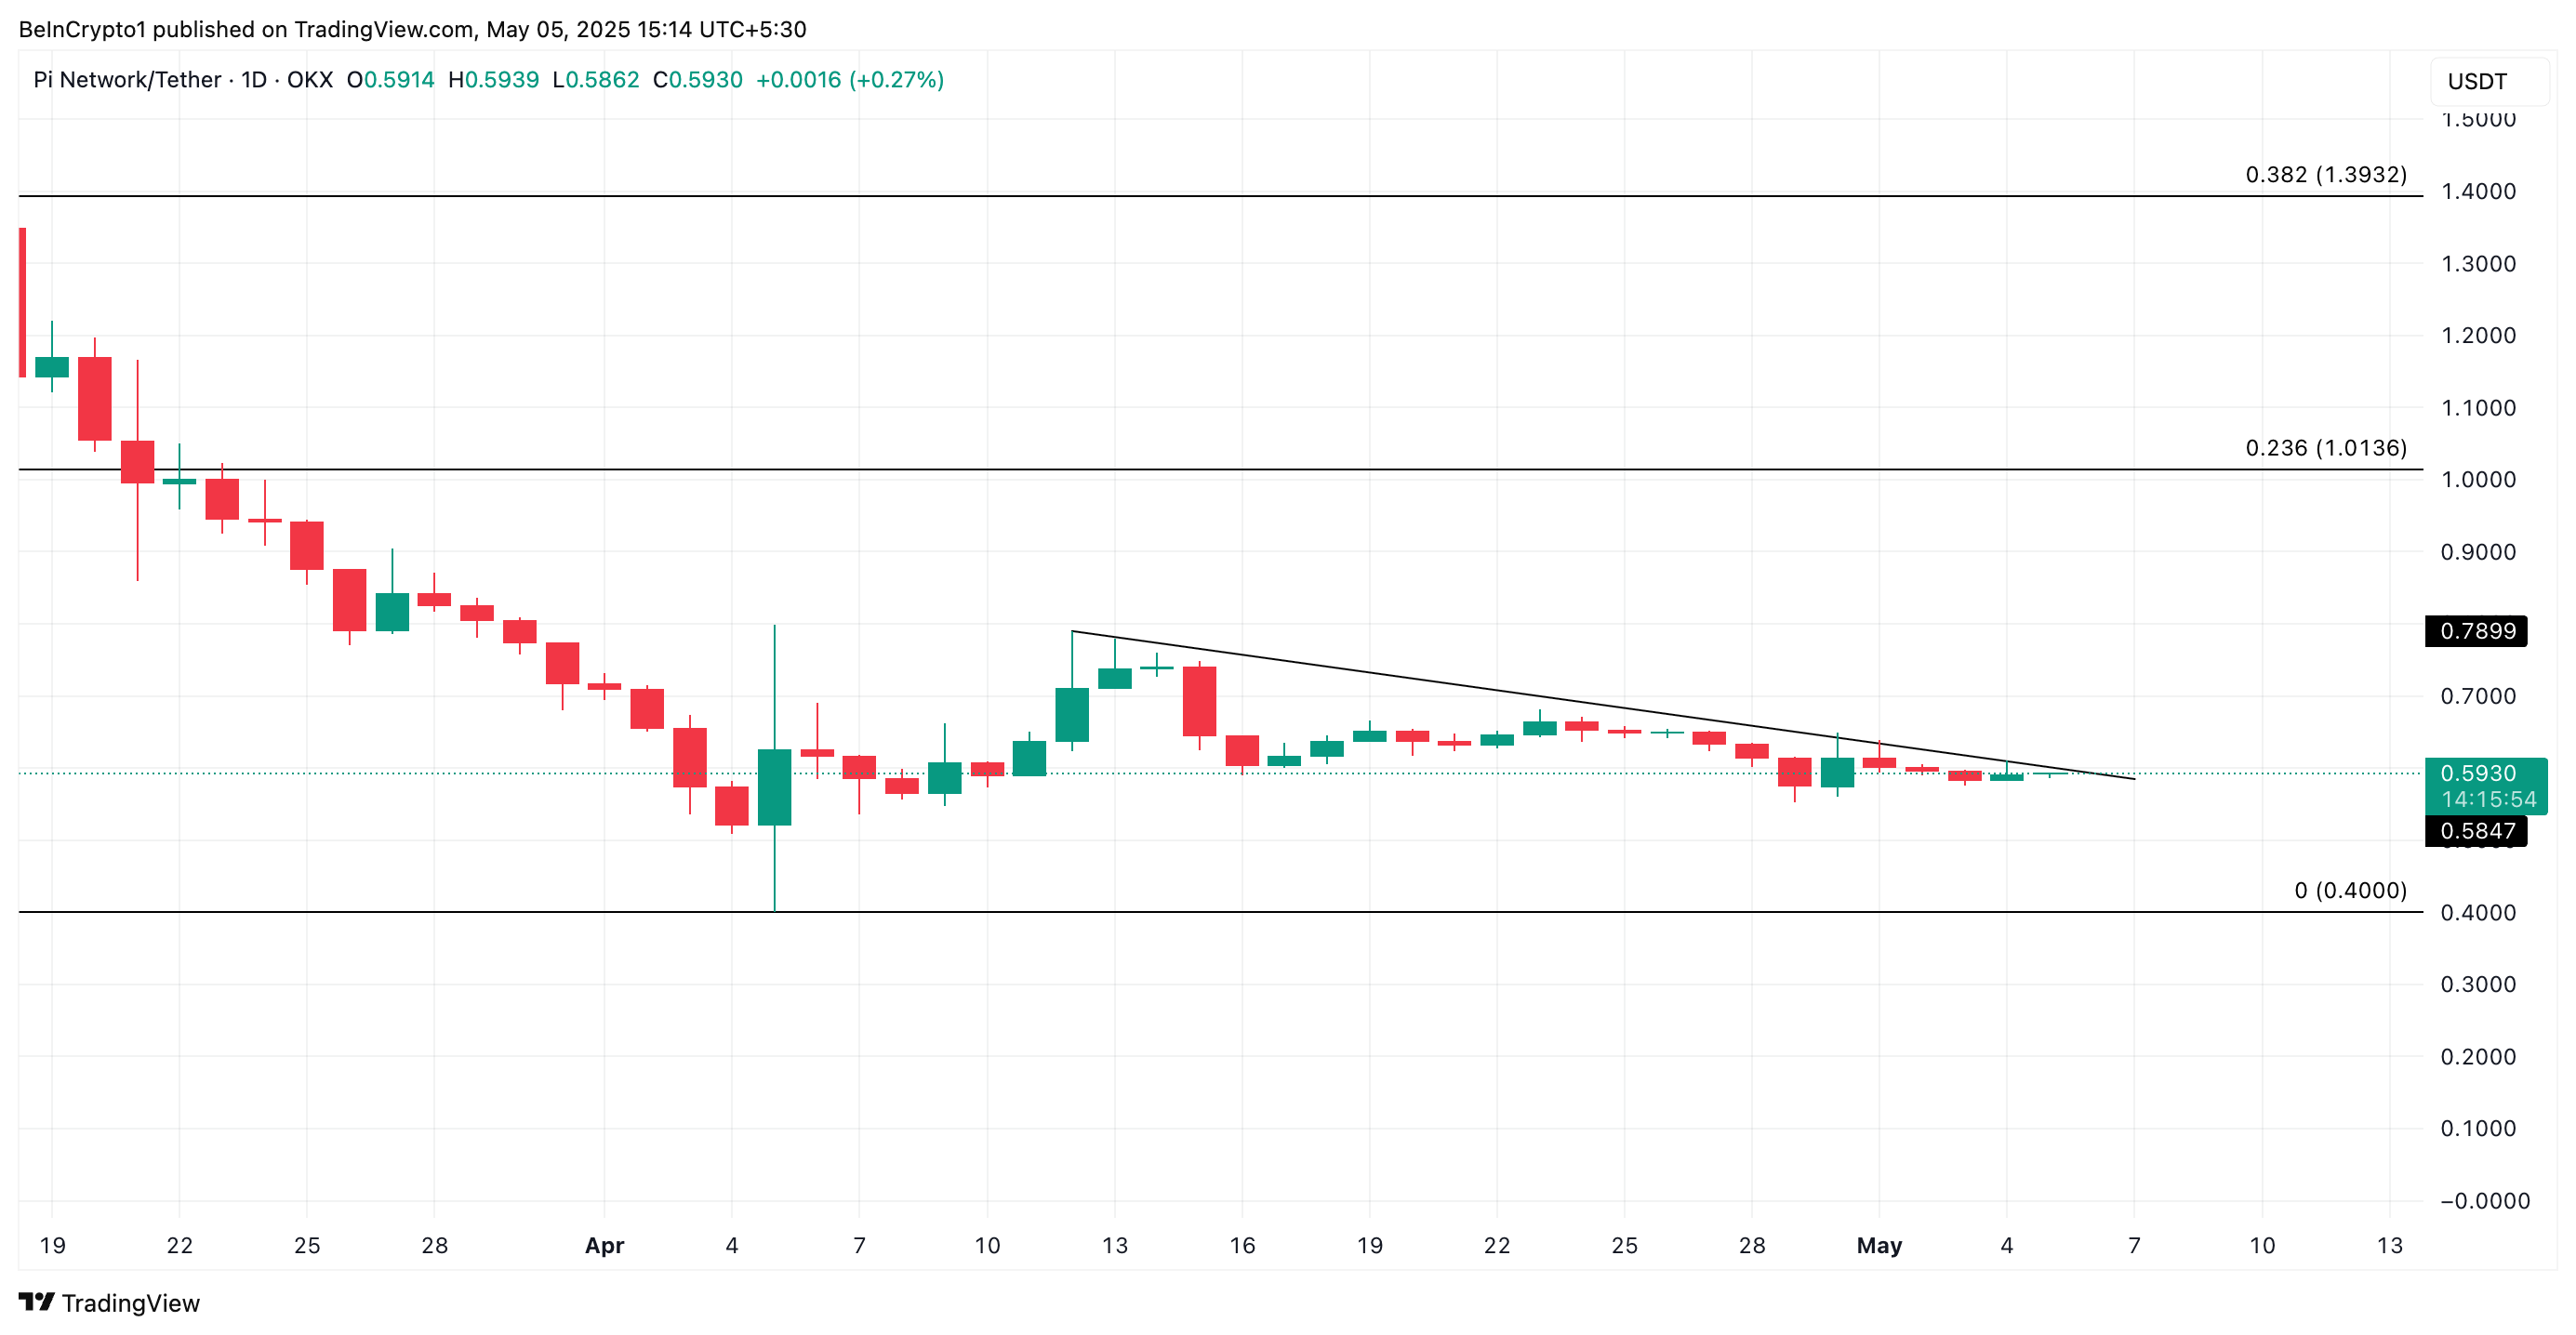
PI has been in a persistent downtrend since reaching an all-time high of $3 on February 26. In fact, it has traded below a descending trendline since April 12, highlighting the negative bias against the altcoin.
However, the tide may finally be turning. Technical indicators now point to a potential bullish resurgence, hinting at a PI rebound in the short term.
PI’s Quiet Accumulation Phase Could Trigger a Rally
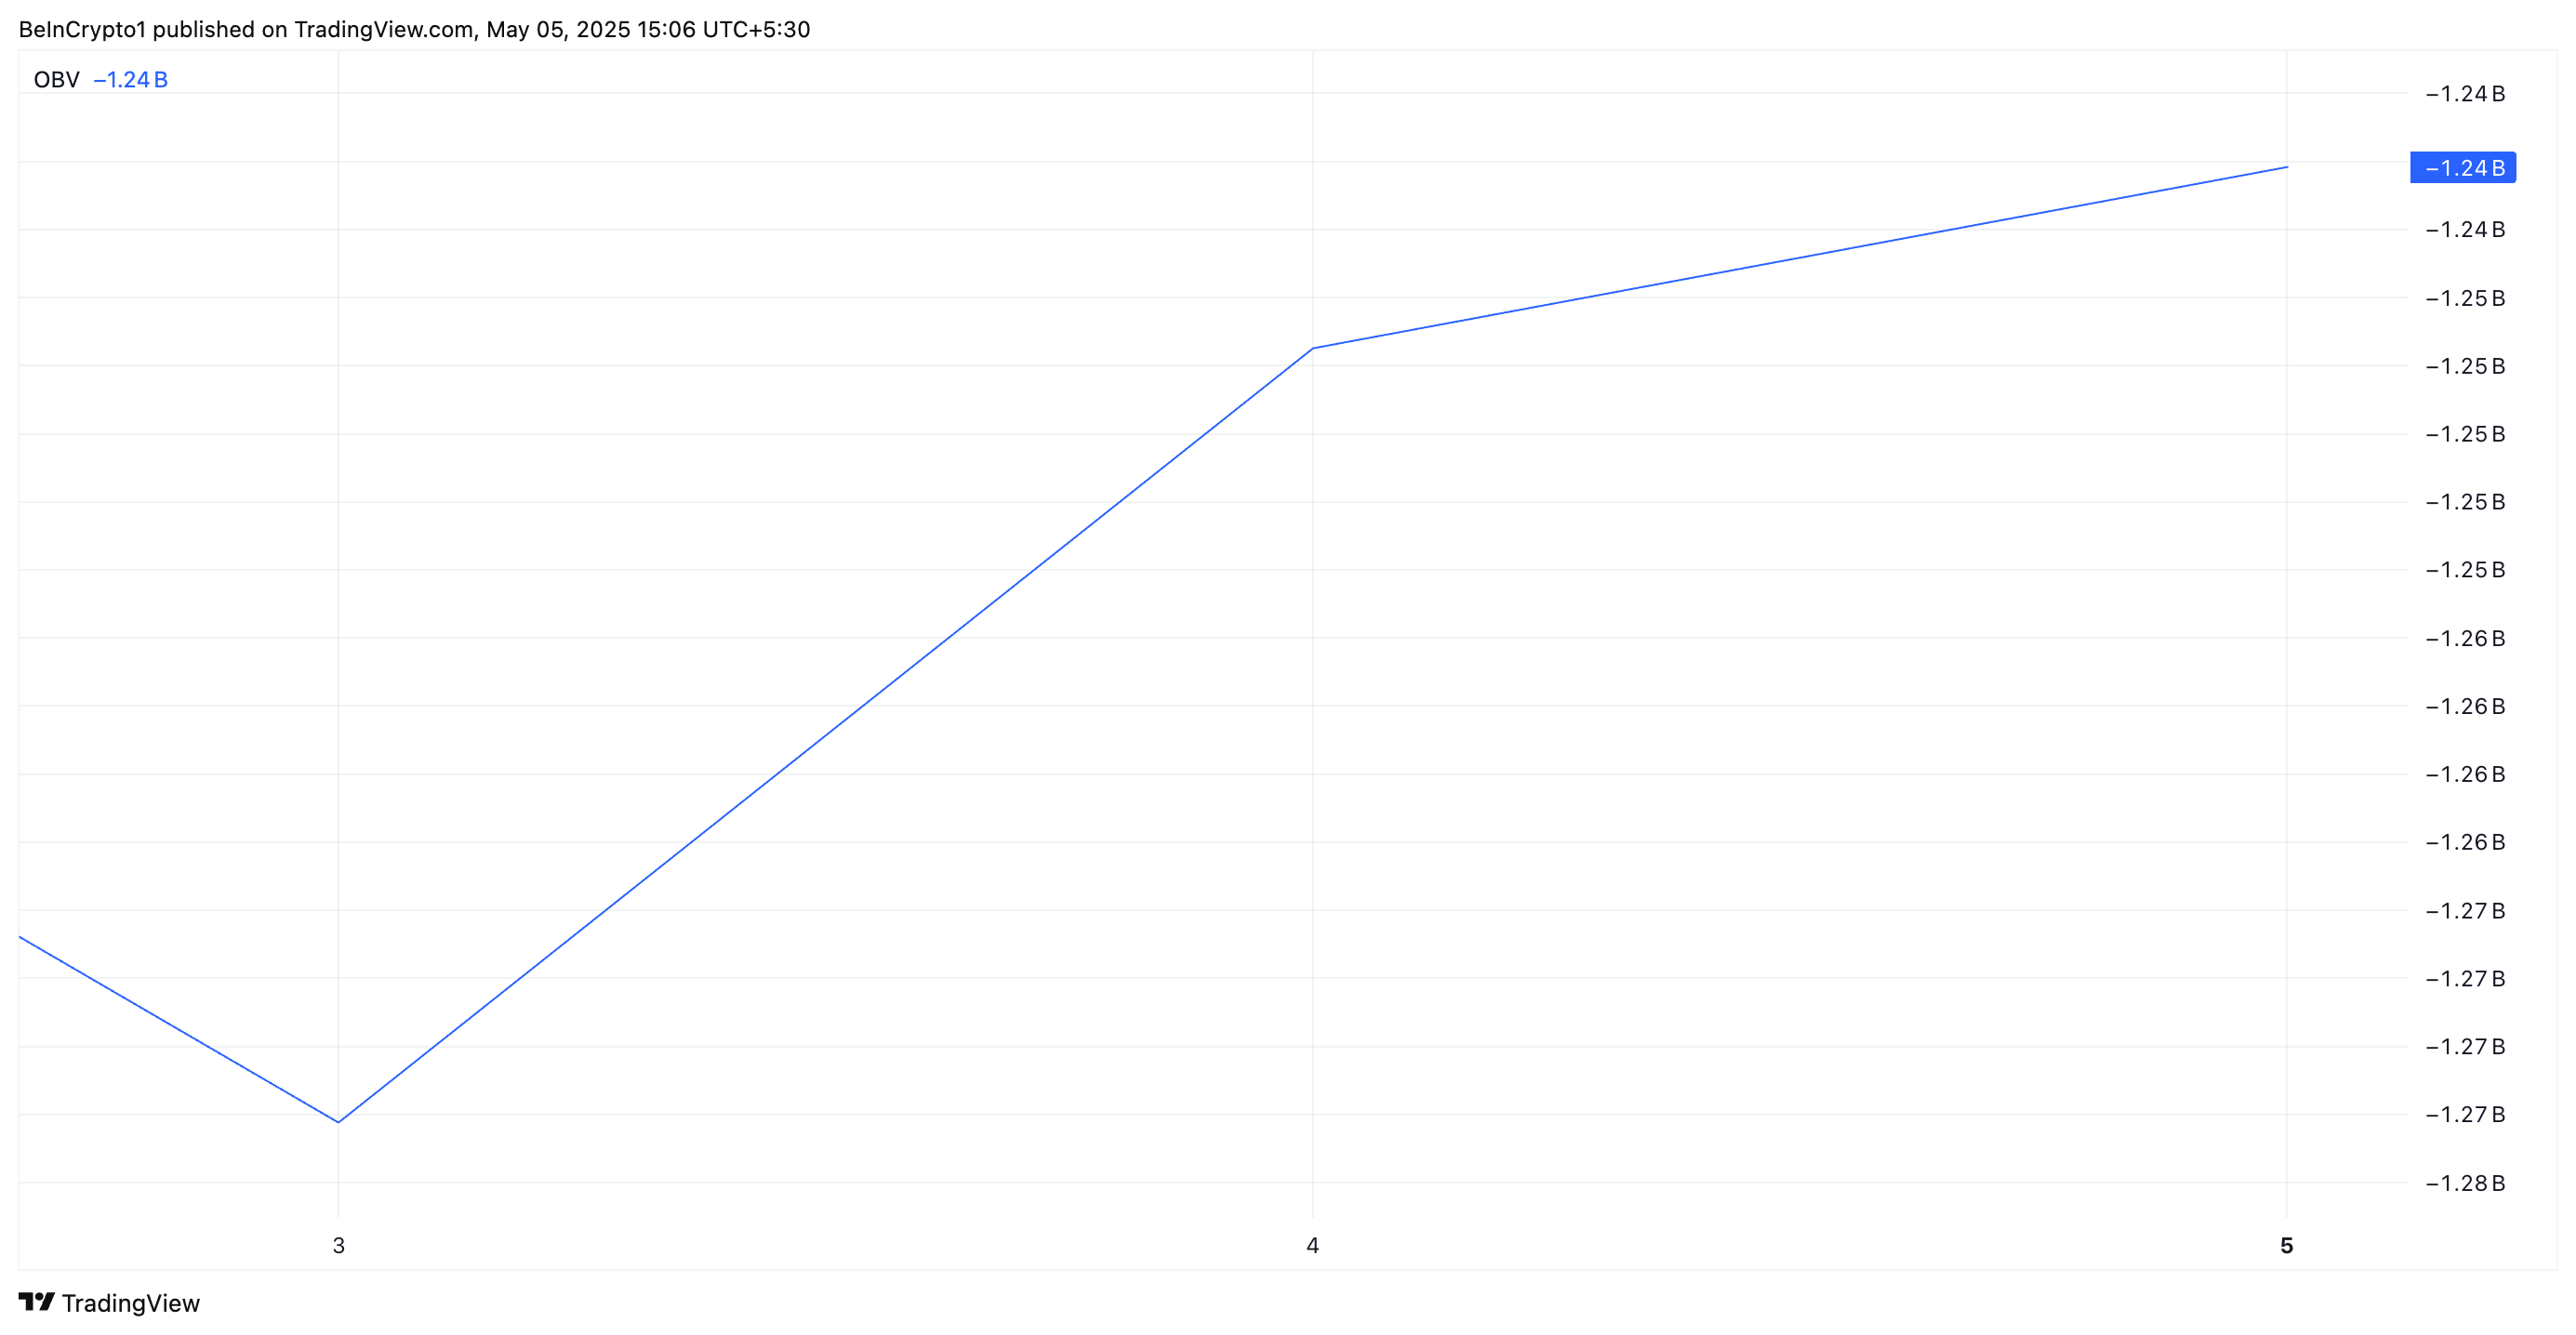
BeInCrypto’s assessment of the PI/USD one-day chart suggests that the altcoin may be preparing for a bullish breakout. For example, its on-balance volume (OBV) has spiked over the past two days, showing early signs of accumulation.
The OBV indicator uses trading volume to predict price movements, adding volume on up days and subtracting it on down days. When its value rises like this, it suggests a surge in buying pressure.
OBV is considered a leading indicator, meaning it often moves ahead of price action and can signal shifts in market sentiment before they are reflected in the asset’s price. Therefore, PI’s rising OBV indicates that buyers are quietly accumulating the token, even as its price remains subdued.
This divergence signals that bullish momentum is building, increasing the likelihood of a PI breakout once broader market sentiment aligns.
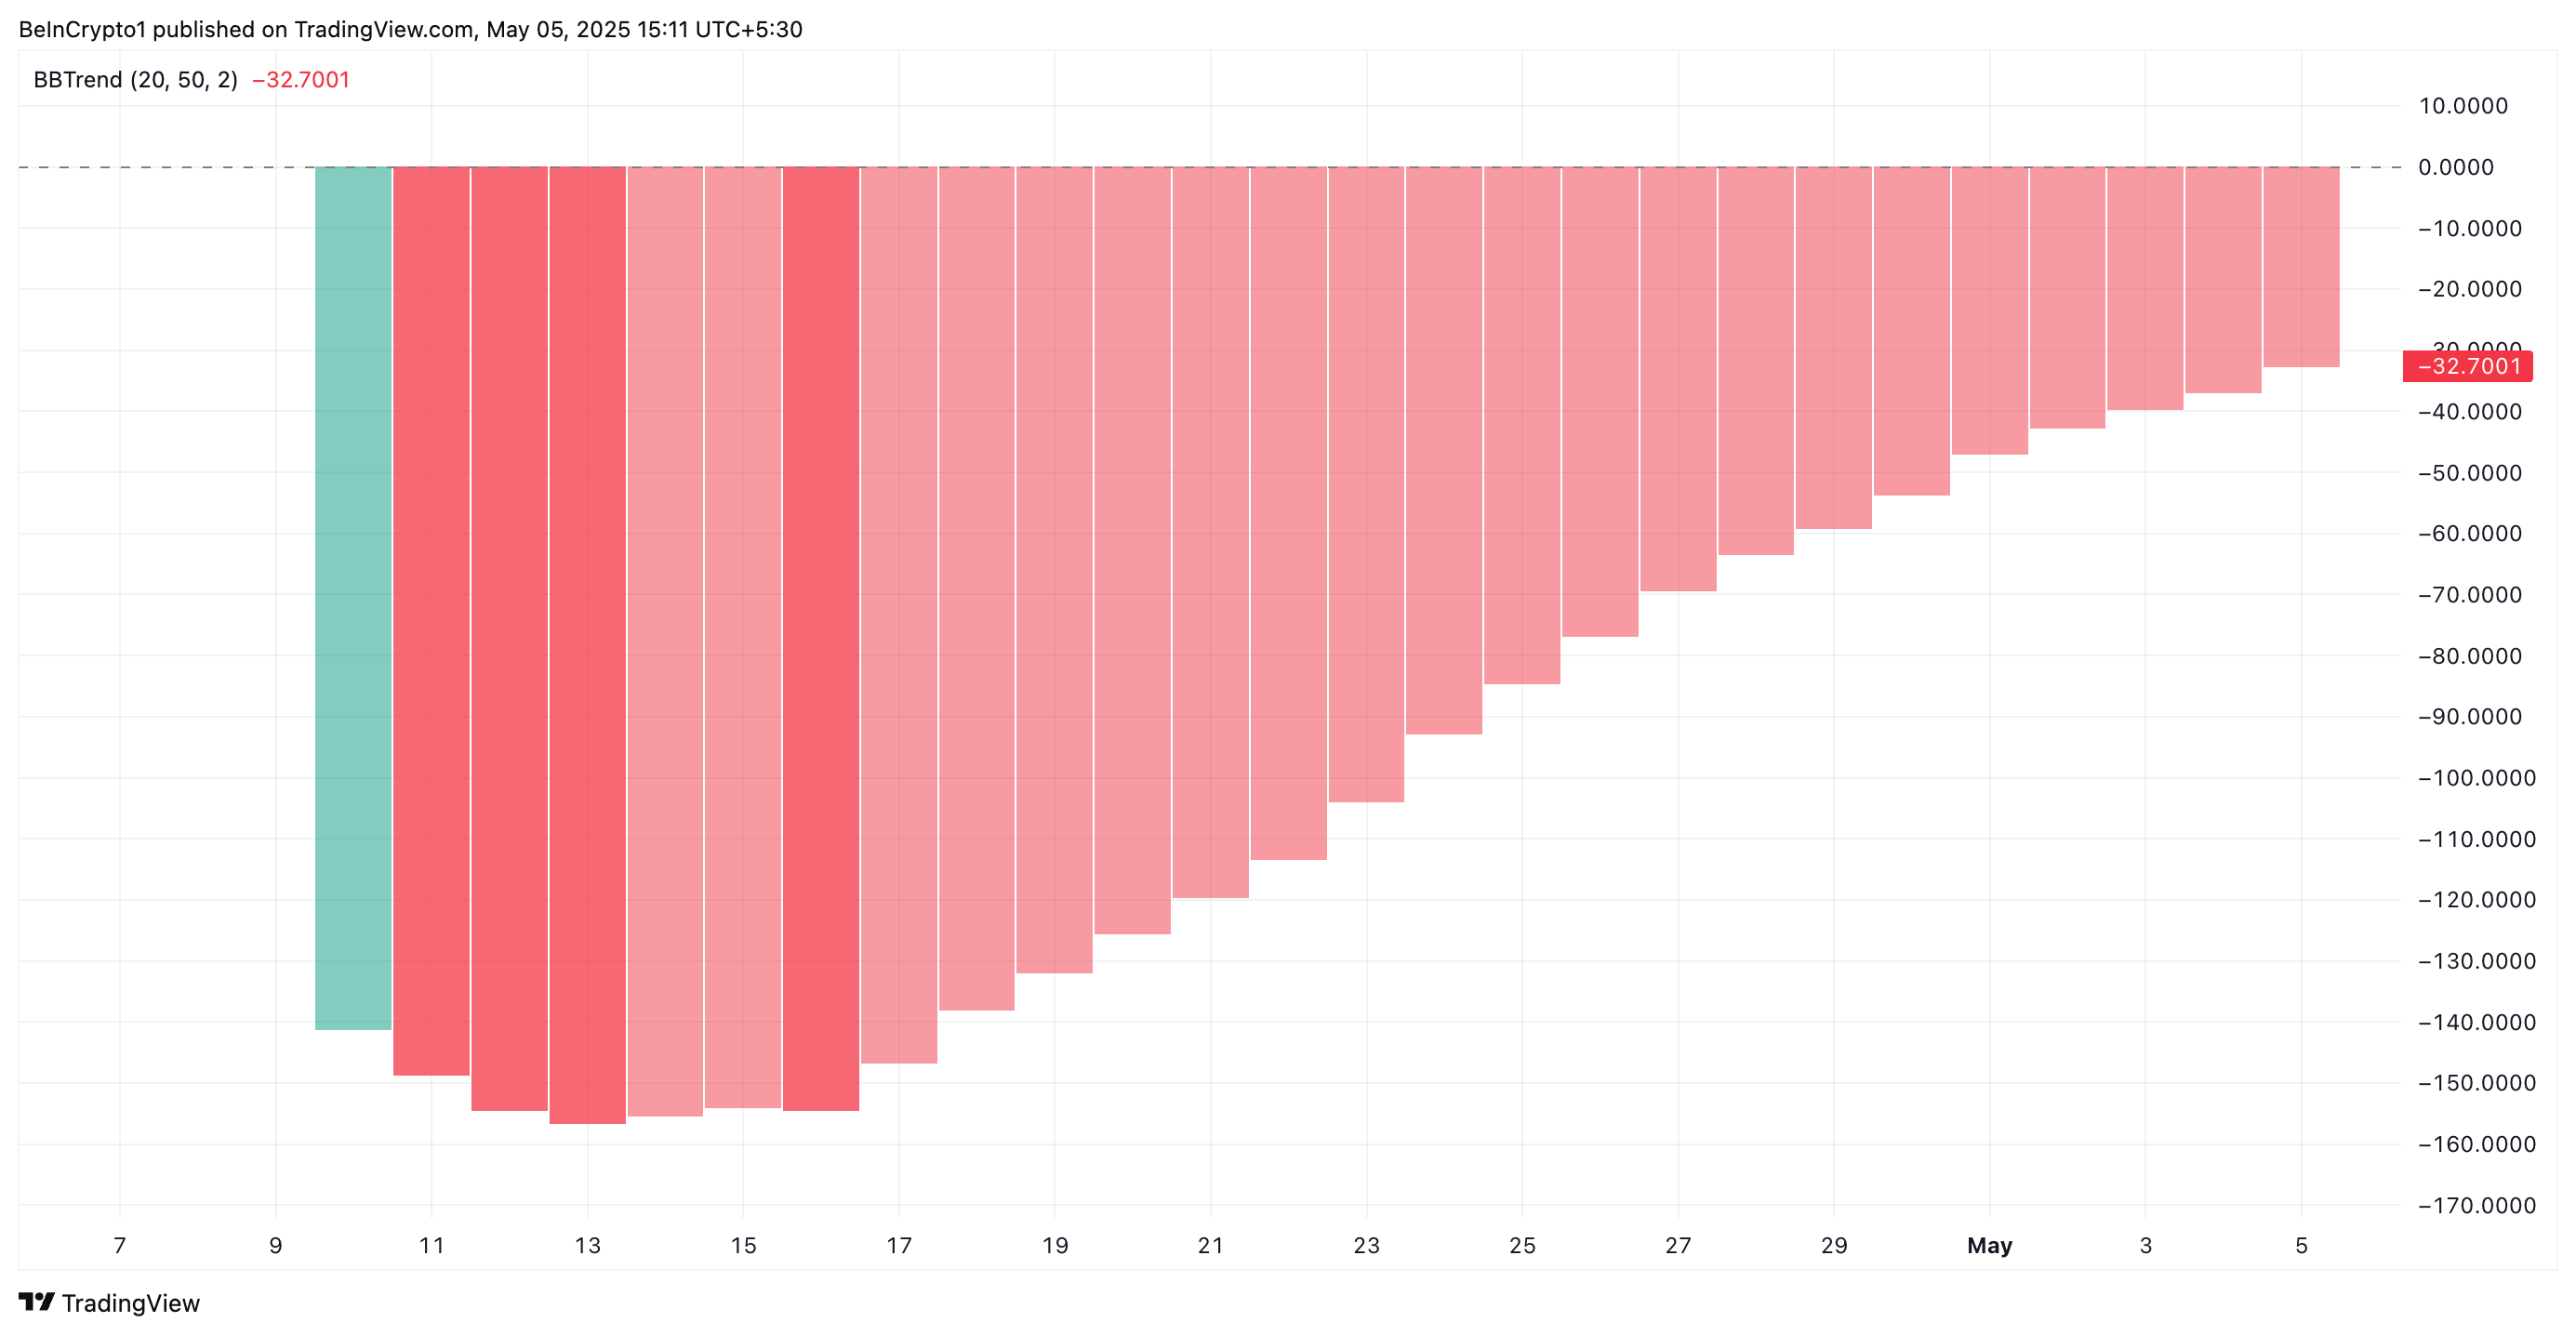
Furthermore, the red bars forming PI’s BBTrend indicator have gradually shrunk. This reduction suggests that selling pressure is weakening, serving as an early signal that the current downtrend may be losing steam.
In technical analysis, a contraction in the BBTrend histogram is a precursor to a potential trend reversal, especially when accompanied by rising volume and other bullish indicators.
As the bars shorten, it indicates that volatility is stabilizing in the PI market and that a bullish shift in price is increasingly likely.
PI for Reversal as Bullish Signals Point to $1 Breakout
PI currently trades at $0.591, resting below its descending trend line, which forms resistance above it at $0.605. If bullish pressure strengthens and PI demand rockets, it could flip this price point into a support floor and climb toward $1.01.
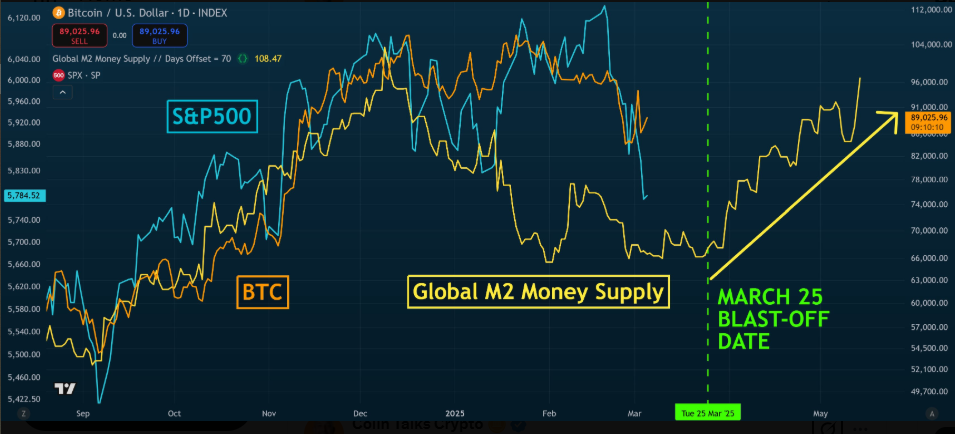
Recent analyses by crypto experts acknowledge that Bitcoin (BTC) price movements closely correlate with the global M2 money supply. Based on this, they predict potential bullish momentum for the crypto market in late March.
With global liquidity expanding, analysts predict that Bitcoin and other digital assets could experience a significant rally, starting around March 25, 2025, and potentially lasting until mid-May.
Global M2 and Its Influence on Bitcoin
The M2 money supply represents a broad measure of liquidity, including cash, checking deposits, and easily convertible near-money assets. Historically, Bitcoin has demonstrated a strong correlation with M2 fluctuations, as increased liquidity in financial markets often drives demand for alternative assets like cryptocurrencies.
Colin Talks Crypto, an analyst on X (Twitter), highlighted this correlation, pointing to a sharp increase in global M2. He described it as a “vertical line” on the chart, signaling an imminent surge in asset prices.
According to his prediction, the rally for stocks, Bitcoin, and the broader crypto market is expected to commence on March 25, 2025, and extend until May 14, 2025.
“The Global M2 Money Supply chart just printed another vertical line. The rally for stocks, Bitcoin, and crypto is going to be epic,” he suggested.
Vandell, co-founder of Black Swan Capitalist, supports that global M2 movements directly influence Bitcoin’s price. He notes that declines in global M2 are typically followed by Bitcoin and cryptocurrency market downturns about ten weeks later.
Despite the potential for short-term dips, Vandell believes this cycle sets the stage for a long-term uptrend.
“As seen recently, when global M2 declined, Bitcoin & crypto followed roughly 10 weeks later. While further downside is possible, this drawdown is a natural part of the cycle. This liquidity shift will likely continue throughout the year, setting the stage for the next leg up,” Vandell explained.
“Bottom line is: Inflation isn’t the prime topic, likely to go down. FED rate cuts. The dollar to weaken massively. Yields to fall. M2 Supply to significantly expand. And as this process started, it’s just a matter of time until altcoins and crypto pick up. Bull,” he stated.
Historical Context and Projections
The correlation between Bitcoin’s price and global M2 growth is not new. Tomas, a macroeconomist, recently compared previous market cycles, particularly in 2017 and 2020. At the time, significant increases in global M2 coincided with Bitcoin’s strongest annual performances.
“Money supply is expanding globally. The last two major global M2 surges occurred in 2017 and 2020—both coincided with mini ‘everything bubbles’ and Bitcoin’s strongest years. Could we see a repeat in 2025? It depends on whether the U.S. dollar weakens significantly,” Tomas observed.
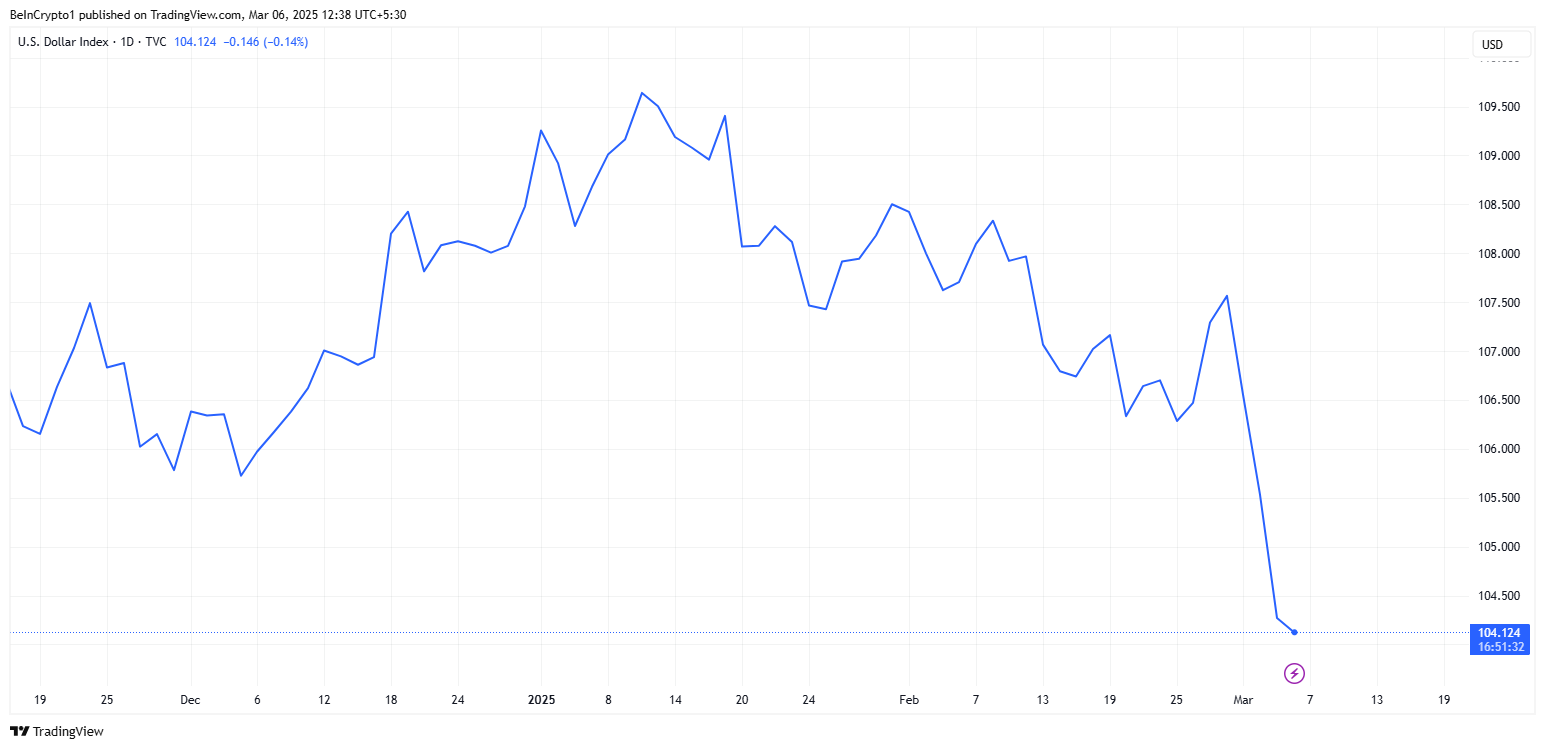
Tomas also highlighted the impact of central bank policies, pointing out that while major banks are cutting rates, the strength of the US dollar could be a limiting factor. If the dollar index (DXY) drops to around 100 or lower, it could create conditions similar to previous Bitcoin bull runs.
Macro researcher Yimin Xu believes that the Federal Reserve might halt its Quantitative Tightening (QT) policies in the latter half of the year. Such a move, Yimin says, could potentially shift toward Quantitative Easing (QE) if economic conditions demand it. This shift could inject additional liquidity into the markets, fueling Bitcoin’s upward trajectory.
“I think reserves could get too thin for the Fed’s liking in the second half of the year. I predict they will terminate QT in late Q3 or Q4, with possible QE to come after,” Xu commented.
Tomas agreed, stating that the Federal Reserve’s current plan is to increase its balance sheet slowly, which is in line with GDP growth. He also articulates that a major financial event could trigger a full-scale return to QE.
These perspectives suggest that uncertainties remain, including the strength of the US dollar and potential economic shocks. Nevertheless, the broader consensus among analysts points toward an impending bullish phase for Bitcoin.
Investors must conduct their own research as they continue to watch macroeconomic indicators in the coming months, anticipating whether the predicted rally will materialize.
Coinbase, one of the leading cryptocurrency exchanges, has announced the addition of Bio Protocol (BIO) and Euler (EUL) to its asset listing roadmap.
The announcement, posted on X, has triggered significant market reactions, with both assets experiencing notable price increases.
Bio Protocol and Euler Join Coinbase’s Listing Roadmap
The exchange notified users that the launch of trading for BIO and EUL remains contingent on market-making support and sufficient technical infrastructure. Coinbase will provide a separate announcement once these conditions are met, which is a standard procedure to manage expectations and mitigate risks for users.
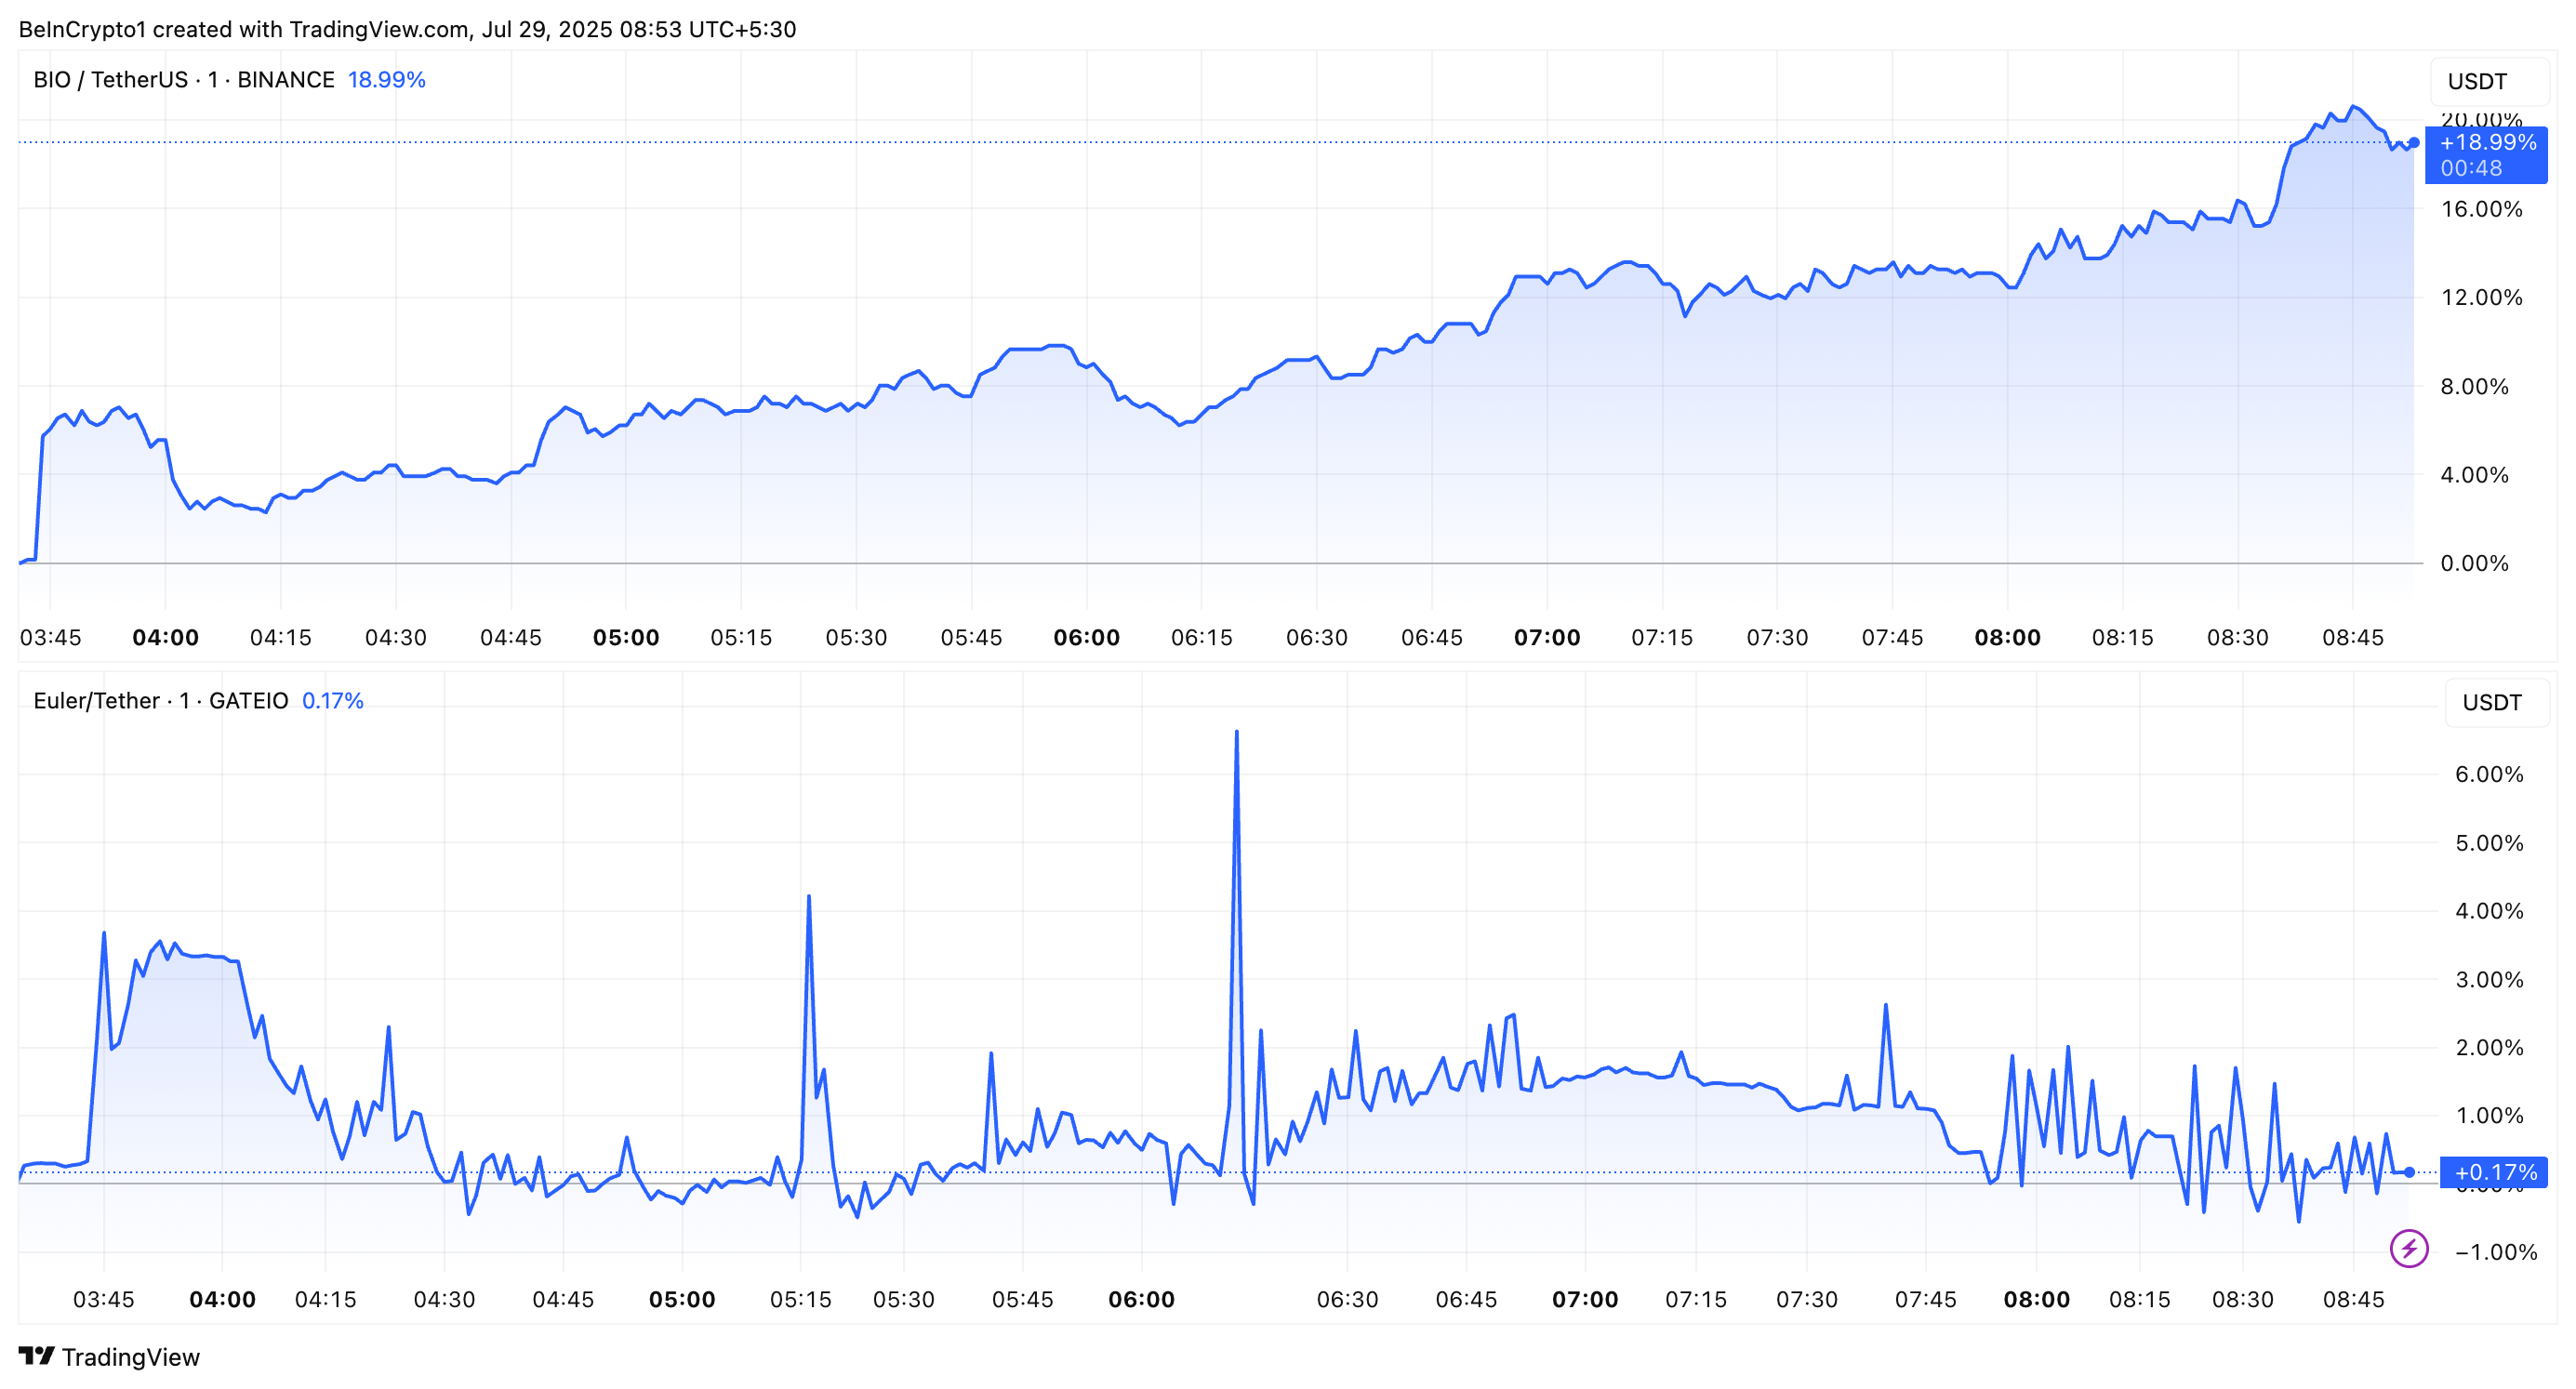
It also cautioned that depositing these assets before an official listing could result in permanent loss of funds. Meanwhile, BIO, an Ethereum-based ERC-20 token with the contract address 0xcb1592591996765ec0efc1f92599a19767ee5ffa, saw an immediate surge following the news.
The token’s price rose from $0.0612 to $0.0669, marking a 9.31% increase. The uptrend continued. Furthermore, at the time of this report, BIO was trading at $0.0733, reflecting an 18.99% gain since the announcement.
EUL, another ERC-20 token with the contract address 0xd9fcd98c322942075a5c3860693e9f4f03aae07b, experienced an even sharper initial spike.
The token jumped from $13.51 to $16.50 , quickly post-announcement. This represented a 22.22% uptick. However, EUL quickly shed most of its gains, stabilizing at $13.52 by press time, a modest 0.17% rise.
This development follows a consistent pattern of Coinbase roadmap updates driving significant price movements. On July 25, the exchange added ResearchCoin (RSC) to its roadmap, triggering an approximately 82% price surge.
Earlier last week, Coinbase included BankrCoin (BNKR), Jito Staked SOL (JITOSOL), and Metaplex (MPLX) in its roadmap, with similar market reactions reported. Notably, the exchange listed JITOSOL and MPLX shortly after. However, BNKR trading is yet to be announced.
The current roadmap now features QCAD (QCAD), BIO, EUL, BNKR, and RSC.
“This is not an exhaustive list of all assets which we have decided to list. Any asset not referenced in the above lists does not preclude any such asset from potential listing,” Coinbase noted.
The exchange also emphasized that assets may be delayed or removed from consideration for listing due to various factors. Thus, the roadmap should not be relied upon as a guarantee or promise of listing.
Bithumb Announces Chainbase (C) Listing
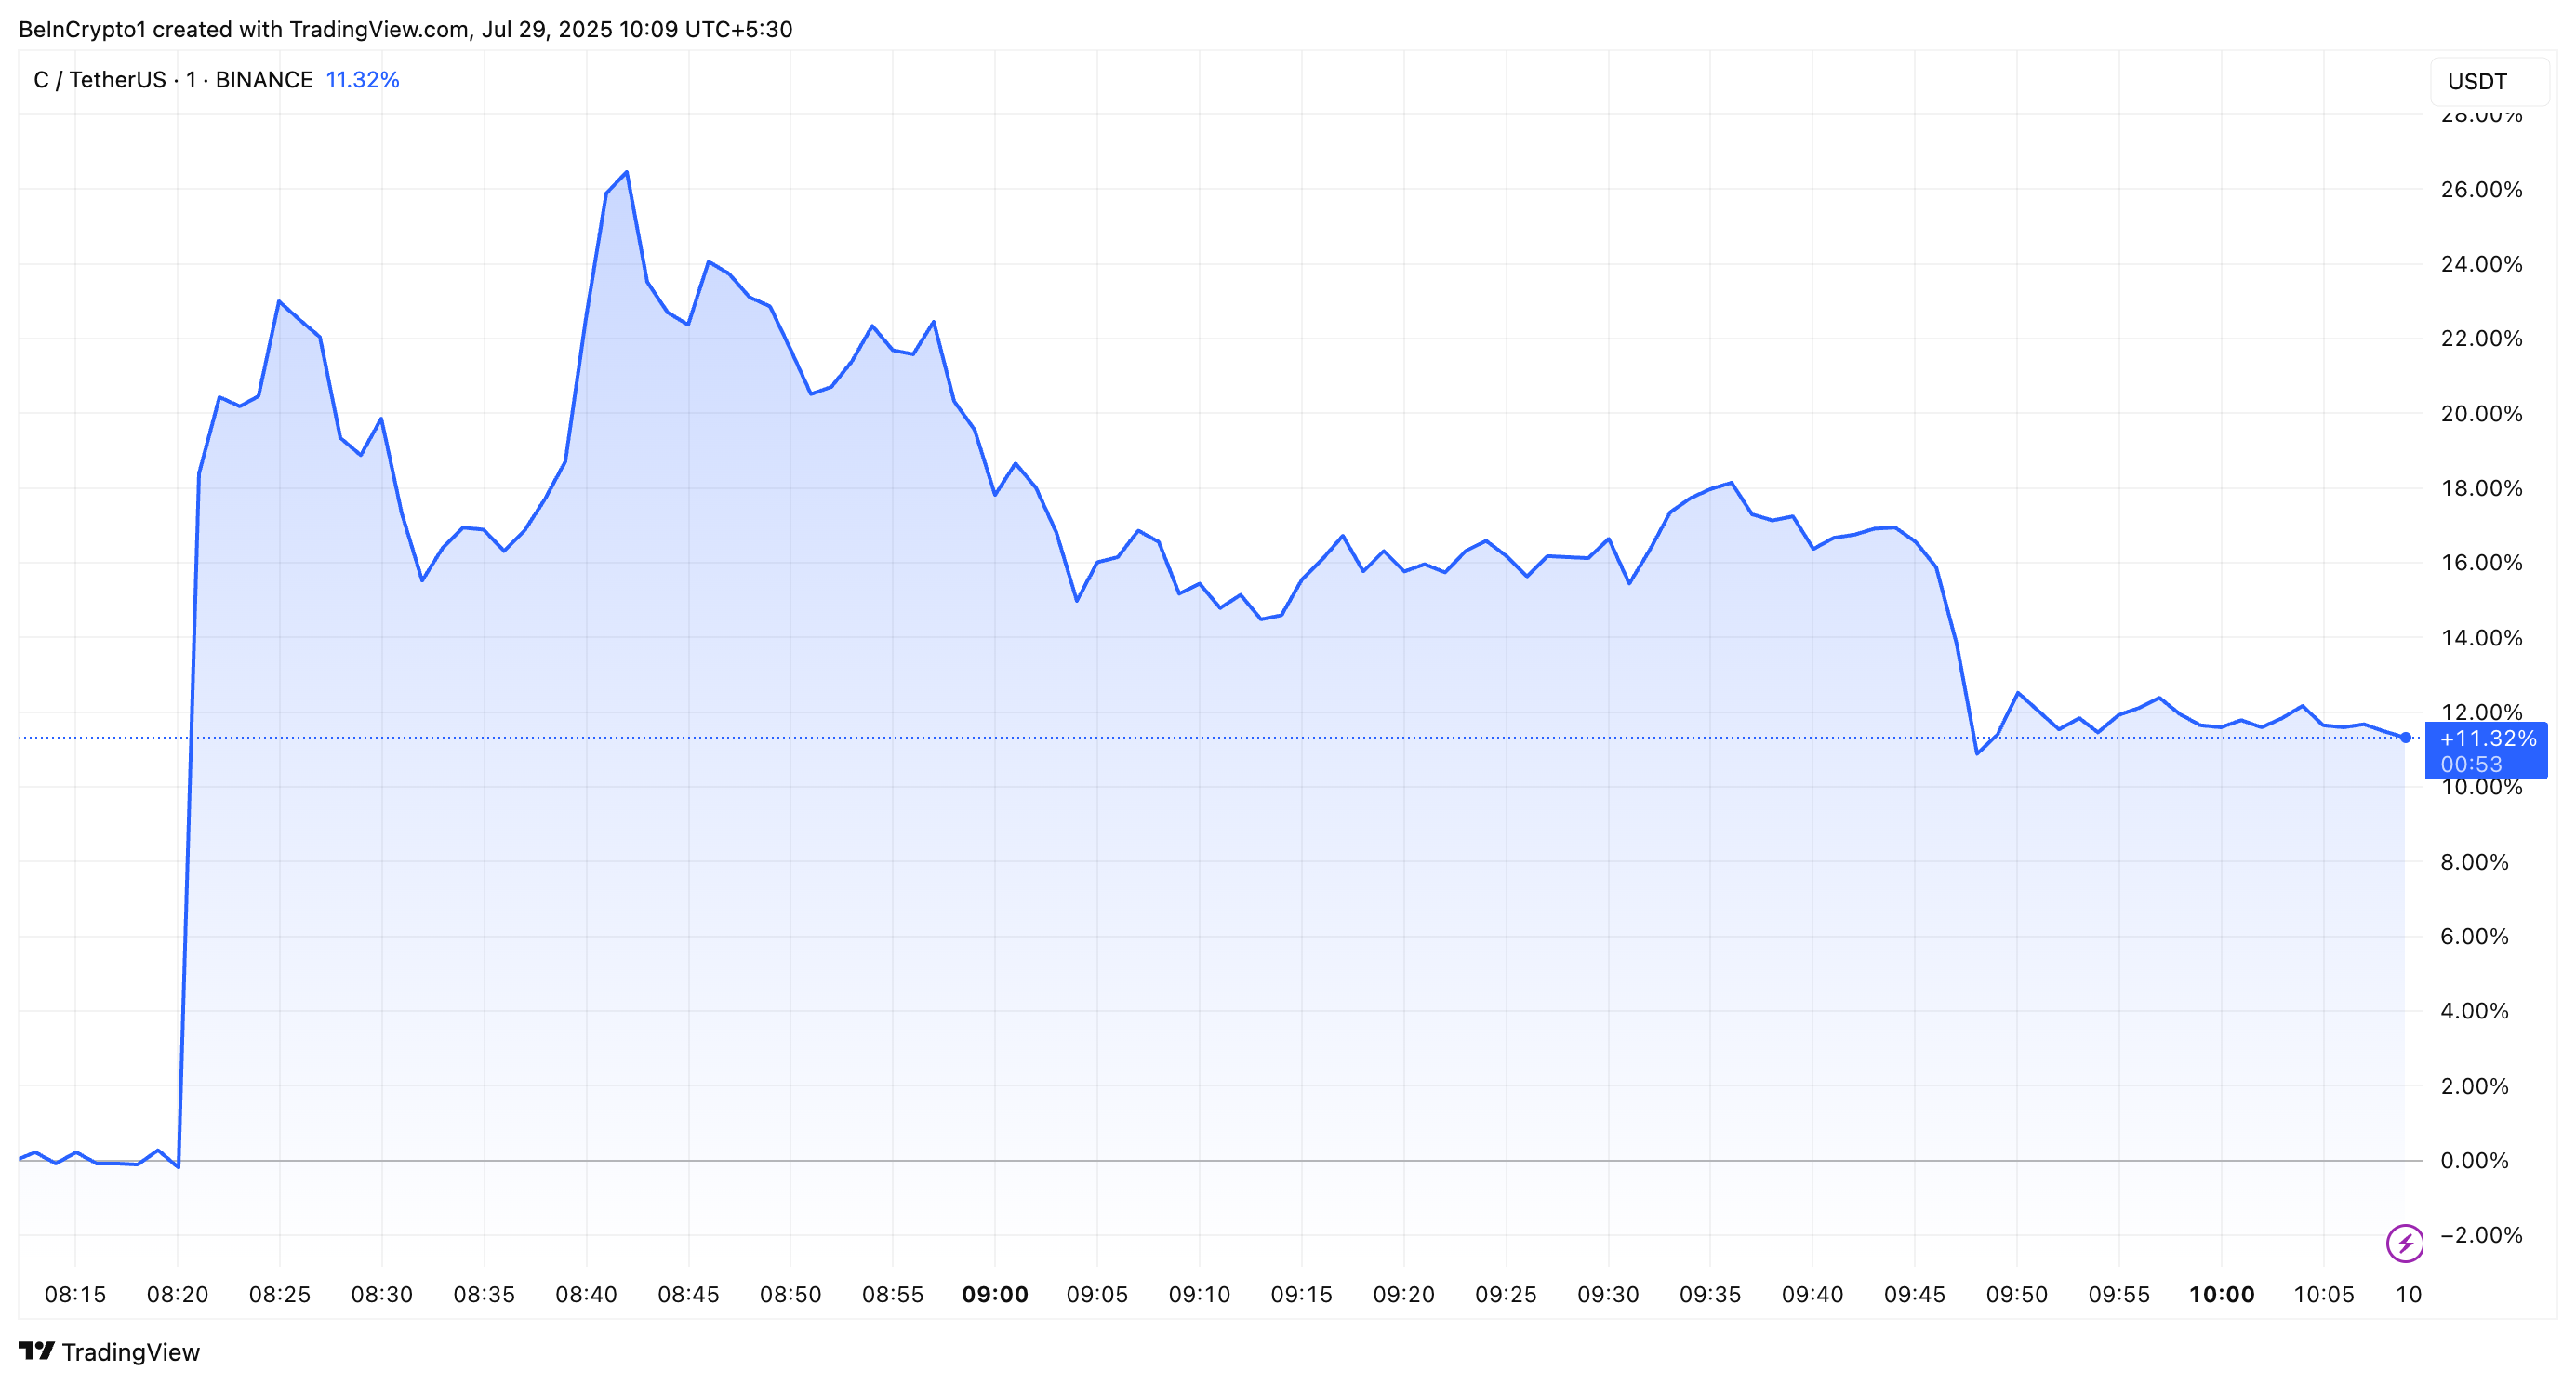
Notably, Coinbase isn’t the only exchange influencing prices. South Korean exchanges have also been significant drivers of price movements. For instance, in an official announcement today, Bithumb revealed that it will be listing Chainbase (C).
In the aftermath of this news, the price quickly rose by approximately 26.03%, increasing from $0.365 to $0.465. As of the latest update, the altcoin was trading at $0.404, reflecting an 11.3% gain.
The exchange confirmed that trading for C will begin on July 29 at 5:00 PM (KST), with the altcoin available for trading against the Korean Won (KRW). The base price is set at 526 KRW.
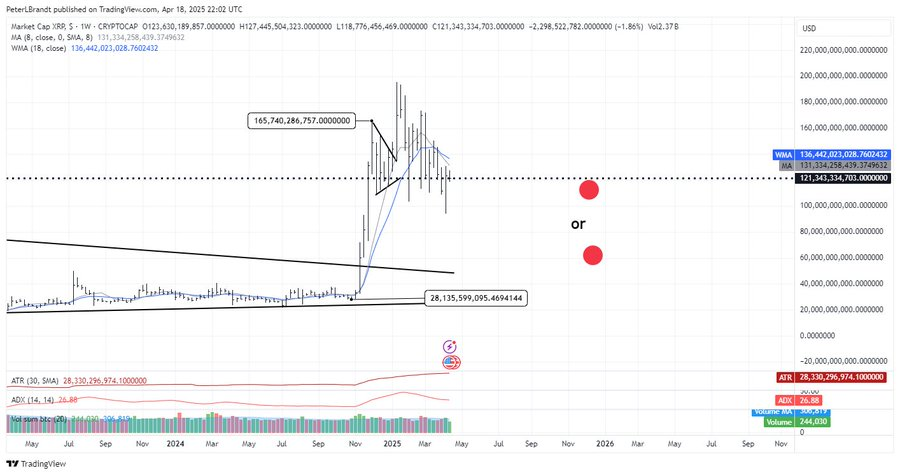
Veteran market analyst Peter Brandt has issued a gloomy year-end forecast for XRP, suggesting the asset may struggle to maintain its momentum despite recent gains.
On April 18, Brandt shared his updated analysis on X (formerly Twitter), projecting two possible scenarios for XRP’s market capitalization by year’s end.
Cautionary Outlook for XRP Despite Recent Surge
The first scenario places XRP’s market cap around $116.67 billion, while the second offers a more bearish outlook of just above $60 billion.
Essentially, both figures imply a decline from XRP’s current valuation of roughly $2.09 per token at a market capitalization of $121 billion.
Brandt’s analysis is based on a technical pattern he previously identified on XRP’s price chart.
According to him, the formation resembles a classic head-and-shoulders setup—a pattern that often signals a trend reversal. If this plays out, XRP could fall as low as $1.07.
He added then that a move below $1.90 would confirm the pattern and likely trigger a steep correction of more than 50%. However, a break above $3 could invalidate the bearish outlook.
“XRP is forming a textbook H&S pattern. So, we are now range bound. Above 3.000 I would not want to be short. Below 1.9 I would not want to own it,” Brandt explained.
He emphasized that the company is not actively seeking external funding because it remains financially stable and is prioritizing product development and business expansion.
“Will we IPO in 2025? I think that’s a definitive no…We’ve said there’s no imminent plans to go public,” Garlinghouse stated.
While the company isn’t moving forward with an IPO this year, Garlinghouse didn’t completely close the door.
He noted that Ripple is evaluating whether going public would benefit the business in the long run. However, such a move isn’t a current priority.
“You have to ask yourself, okay, how does Ripple benefit from being a public company? And is it a high priority for us?” he said.
Moreover, Garlinghouse also hinted that the regulatory landscape—especially under new leadership at the SEC—could influence Ripple’s future decisions.