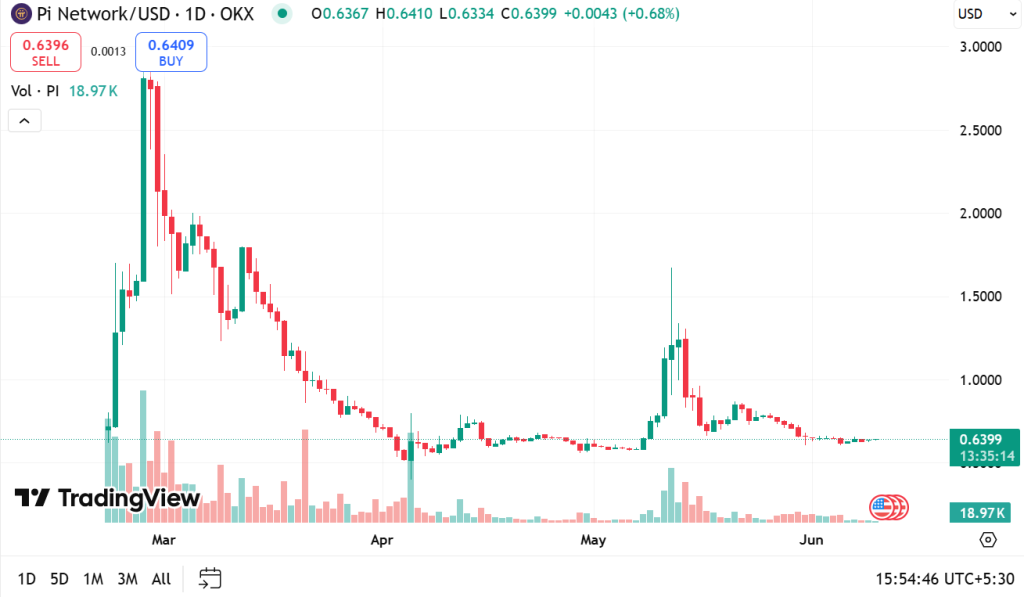
Pi Coin is currently trading at $0.6404. It is still stuck below $1 and has dropped 33% over the last month. The Ichimoku Cloud, BBTrend, and EMAs also show no signs of strength yet.
If momentum does not return soon, Pi could see more downside before any recovery begins. The technical indicators show a mixed but slightly bearish picture. Most Oscillators, like RSI, Stochastic, and CCI, are neutral, while the MACD is bearish. But the momentum indicators are showing a buy, which shows early strength. The moving averages are also mostly bearish.
Pi is still under pressure, and it needs a breakout above $0.65–$0.70 to shift the trend in favor of bulls.
Source: Tradingview
Tough Week for PI?
According to CoinCodex, Pi Coin may face a tough week ahead. It is expected to fall the rest of the week up to $0.4848 by June 14. That would be a 23% weekly loss if no bullish catalysts emerge.
It is currently stuck in a bearish trend with the short-term EMA lines sitting below the long-term ones. This is a classic sign of continued downside, and if the bearish support grows, Pi may revisit key support zones. A breakdown there could push it below a critical level for the first time, leading to steeper losses.
On the flip side, if the buying picks up, it could rebound to the next major EMA resistance, sparking a 37% breakout rally. Analyst Moon Jeff, in a recent X post, wrote “Send $PI back to $1.2,” highlighting that this level marks a key resistance for Pi Coin. A breakout above this could be the start of recovery for the coin.
Despite Pi coin’s recent slump, the community remains hopeful ahead of the upcoming Pi Day 2 on June 28. Analyst Dr. Altcoin believes that a major update from the Pi Core Team could spark a price recovery. But if no major news drops, Pi risks sliding below its all-time low of $0.40.
Hedera (HBAR) is showing mixed signals as it hovers at a key technical juncture. Its market cap is currently at $7 billion. Despite signs of growing momentum, trading volume has dropped 27% in the last 24 hours, now sitting at $104.29 million.
While indicators like the RSI and EMA lines hint at a potential bullish breakout, the BBTrend remains negative, suggesting that trend strength is still fragile. For now, HBAR’s price movement reflects a market in transition, caught between fading volatility and early signs of renewed interest.
HBAR Trend Weakness Eases, But Momentum Still Lacking
Hedera’s BBTrend indicator is currently at -3.53 and has remained in negative territory for nearly three consecutive days. Just yesterday, it hit a recent low of -5, signaling particularly weak trend strength during that period.
Although it has slightly recovered, the fact that BBTrend remains below zero indicates that momentum is still lacking, and the price action is showing limited direction or energy.
This prolonged dip suggests that HBAR may be stuck in a period of consolidation or at risk of entering a broader downtrend if no bullish momentum emerges.
BBTrend, or Bollinger Band Trend, measures the strength and volatility of a price trend by analyzing the expansion or contraction of Bollinger Bands.
Positive values typically suggest strong directional movement, while negative values point to weakening trends and reduced volatility. With BBTrend still sitting at -3.53, HBAR remains in a low-energy zone where neither buyers nor sellers are taking clear control.
Unless the indicator returns to positive territory, HBAR may continue to drift sideways or gradually decline, reflecting market indecision and a lack of strong conviction.
HBAR Builds Momentum as RSI Climbs
Hedera’s RSI (Relative Strength Index) is currently at 55.70, rising from 45 just two days ago. This upward move reflects increasing bullish momentum, showing that buying pressure has picked up after a short period of weakness.
While the RSI remains below overbought levels, the steady rise suggests growing interest in HBAR and a potential continuation of its current upward push, provided that momentum sustains.
The RSI is a momentum oscillator that measures the speed and magnitude of recent price changes, typically on a scale from 0 to 100. Readings above 70 are generally considered overbought, while those below 30 are viewed as oversold.
With HBAR’s RSI now at 55.70, it sits comfortably in neutral-bullish territory, indicating room for further upside before reaching overheated conditions.
If this trend continues and RSI edges closer to 70, it could support a short-term rally—but also raise caution for potential exhaustion ahead.
Hedera Set for Bullish Crossover, But Risks Remain Below $0.153
Hedera’s EMA lines are currently showing signs of a potential golden cross forming, which could signal a shift toward a bullish trend. If this crossover happens and momentum strengthens, Hedera’s price may test the resistance at $0.178.
A breakout above that level could pave the way for a move toward $0.20. If the rally accelerates, prices could climb to $0.258, marking the first time HBAR trades above $0.25 since early March.
The upward slope in short-term EMAs reflects growing optimism, but confirmation will depend on volume and price action in the coming sessions.
However, downside risks still remain. If HBAR fails to hold the support level at $0.153, bearish pressure could drag the token down to $0.124.
While technicals are currently leaning bullish, the price remains at a crucial crossroads, with both breakout and breakdown scenarios in play. Until a clear direction emerges, traders should watch these key levels closely.
Renewed interest in XRP has hinted at a potential market reversal from a multi-week correction.
XRP price must consistently close above $2.23 in the coming days to validate a fresh bullish wave.
Ripple Labs’s XRP gained more than 6 percent in the past 24 hours to trade at about $2.21 on Tuesday during the evening North American trading session. As Bitcoin (BTC) price rallied above a crucial resistance/support level of around $92k for the first time since the onset of the U.S.-led tariff trade wars, confidence in the wide altcoin market grew in tandem.
Moreover, the rising crypto Open Interest (OI) has helped catalyze bullish sentiment following the ongoing parabolic price rally of gold.
XRP Price Eyes $3 Next
From a technical analysis standpoint, XRP price has been forming a market reversal pattern in the past few weeks, characterized by a possible inverse head and shoulders (H&S) formation. Today’s XRP pump saw the altcoin approach a crucial resistance level around $2.23, which if flipped will result in a confirmed bullish wave in the near future.
In the four-hour timeframe, XRP price has signaled a momentum shift to a bullish outlook after breaking out of a multi-week falling logarithmic trend. A consistent close above $2.23 will clear the path for XRP bulls to push toward the next target of about $3.
However, a consistent close below $2.23 in the coming days will result in further XRP price correction, possibly towards $1.76 again.
Market Picture
The confirmation of the nomination of the new U.S SEC Chair Paul Atkins earlier on Tuesday stamped the end of the Ripple lawsuit, and clarity for XRP and the wider crypto market ahead. Moreover, the odds of a spot XRP ETF approval by the end of 2025 surged to 72 percent on the polymarket as investors speculate on imminent approvals.
The XRP market will continue to improve as more institutional investors gradually accumulate in anticipation of a parabolic rally in the coming months.
The post XRP Price Analysis Today: Is a Bullish Wave to $3 Confirmed? appeared first on Coinpedia Fintech News
Renewed interest in XRP has hinted at a potential market reversal from a multi-week correction. XRP price must consistently close above $2.23 in the coming days to validate a fresh bullish wave. Ripple Labs’s XRP gained more than 6 percent in the past 24 hours to trade at about $2.21 on Tuesday during the evening …
Bitcoin has made it to the center stage of the crypto market again, not just for its price hovering around the all-time high, but also for the strategic moves happening behind the scenes. Strategy recently purchased 4,020 BTC at an estimated cost of $427 million, fueling speculation about a potential leg up. However, the market seems divided by views. While price holds above $109k, investors are now eyeing the on-chain trends, liquidation data, and whale moves for clues on the next move.
Smart Money vs. Retail Money?
Recent insights from Glassnode reveal a crucial shift, where the greater than 10k BTC cohort (the market’s largest players) have moved into a net distribution zone with a score around 0.3. This is an obvious reversal from earlier in the year, when whales were leading accumulation during price rallies.
Other cohorts like the 1k to 10k holders and the 100 to 1k BTC holders are also slowing down. While wallets with 10 to 100 BTC and sub-1 BTC continue their shopping spree. Further suggesting that leadership is moving downward on the wallet-size curve. This implies that the retail is buying the dip, while whales may be booking profits or analysing an incoming volatility.
What Does the Liquidation Heat Map Say?
The liquidation map by Kingfisher gives another layer of insight. With Bitcoin currently priced around $109k, there’s a significant buildup of long liquidation just below the $109k, $108.5k, and $107k mark. This indicates a potential liquidity grab to the downside that could be in the works, which could be driven by leveraged long positions at a risk of being wiped out.
It is to note that, above the present BTC price, short liquidation levels seem to be weak, indicating less momentum for an upward squeeze. Correlating this with the distribution by large holders paints a picture where short-term downside volatility is not just possible, but is statistically favored. However, it is worth citing that such moves often reset leverage and provide stronger bases for continuation.
Bitcoin (BTC) Price Analysis:
Bitcoin price today is down 0.40% at $109,222.37, but still holding a 3.37% gain over the past week. The market cap sits at $2.17 trillion, slightly lower day-over-day, while 24-hour trading volume surged to $50.45 billion. The price ranged between $107,609.56 and $110,376.88, showing short-term volatility. We can expect a pullback before the next ATH, which could be around $113k.
The Bitcoin price today is down a negligible 0.40% to $109,222.37, however, the trading volume is up 5.77% with an inflow of $50.45 billion.
2. What levels should investors watch?
The key levels to watch are $107k–$109k, if BTC dips here, strong reactions could occur from liquidation-driven volatility.
The post Whales Selling, Retail Buying: Is Bitcoin Price at $109k on Crossroads? appeared first on Coinpedia Fintech News
Bitcoin has made it to the center stage of the crypto market again, not just for its price hovering around the all-time high, but also for the strategic moves happening behind the scenes. Strategy recently purchased 4,020 BTC at an estimated cost of $427 million, fueling speculation about a potential leg up. However, the market …