Kraken has launched perpetual futures contracts for Pi Network’s native token, PI, allowing traders to take long or short positions with up to 20x leverage.
The move gives traders a new way to speculate on PI’s price without holding the asset itself. It also marks PI’s debut on a major derivatives platform, despite the token still lacking listings on top spot exchanges like Binance or Coinbase.
How PI Perpetual Futures on Kraken Will Work
Perpetual futures are derivative contracts with no expiration date. Traders can open positions that track the price of PI and settle profits or losses based on price movements over time.
On Kraken Pro, users can access these contracts with over 40 collateral options and across more than 360 markets.
This flexibility allows both hedging and speculative strategies. Traders bullish on Pi Network can go long, while skeptics can short the token—betting that its price will fall.
$PI@PiCoreTeam perpetual futures now live with up to 20x leverage
The listing introduces more liquidity into the PI market. Greater trading activity could reduce volatility in the long term. However, in the short term, leverage may amplify price swings.
Market sentiment around PI is already fragile. Concerns over centralization—60% of the token supply remains under core team control.
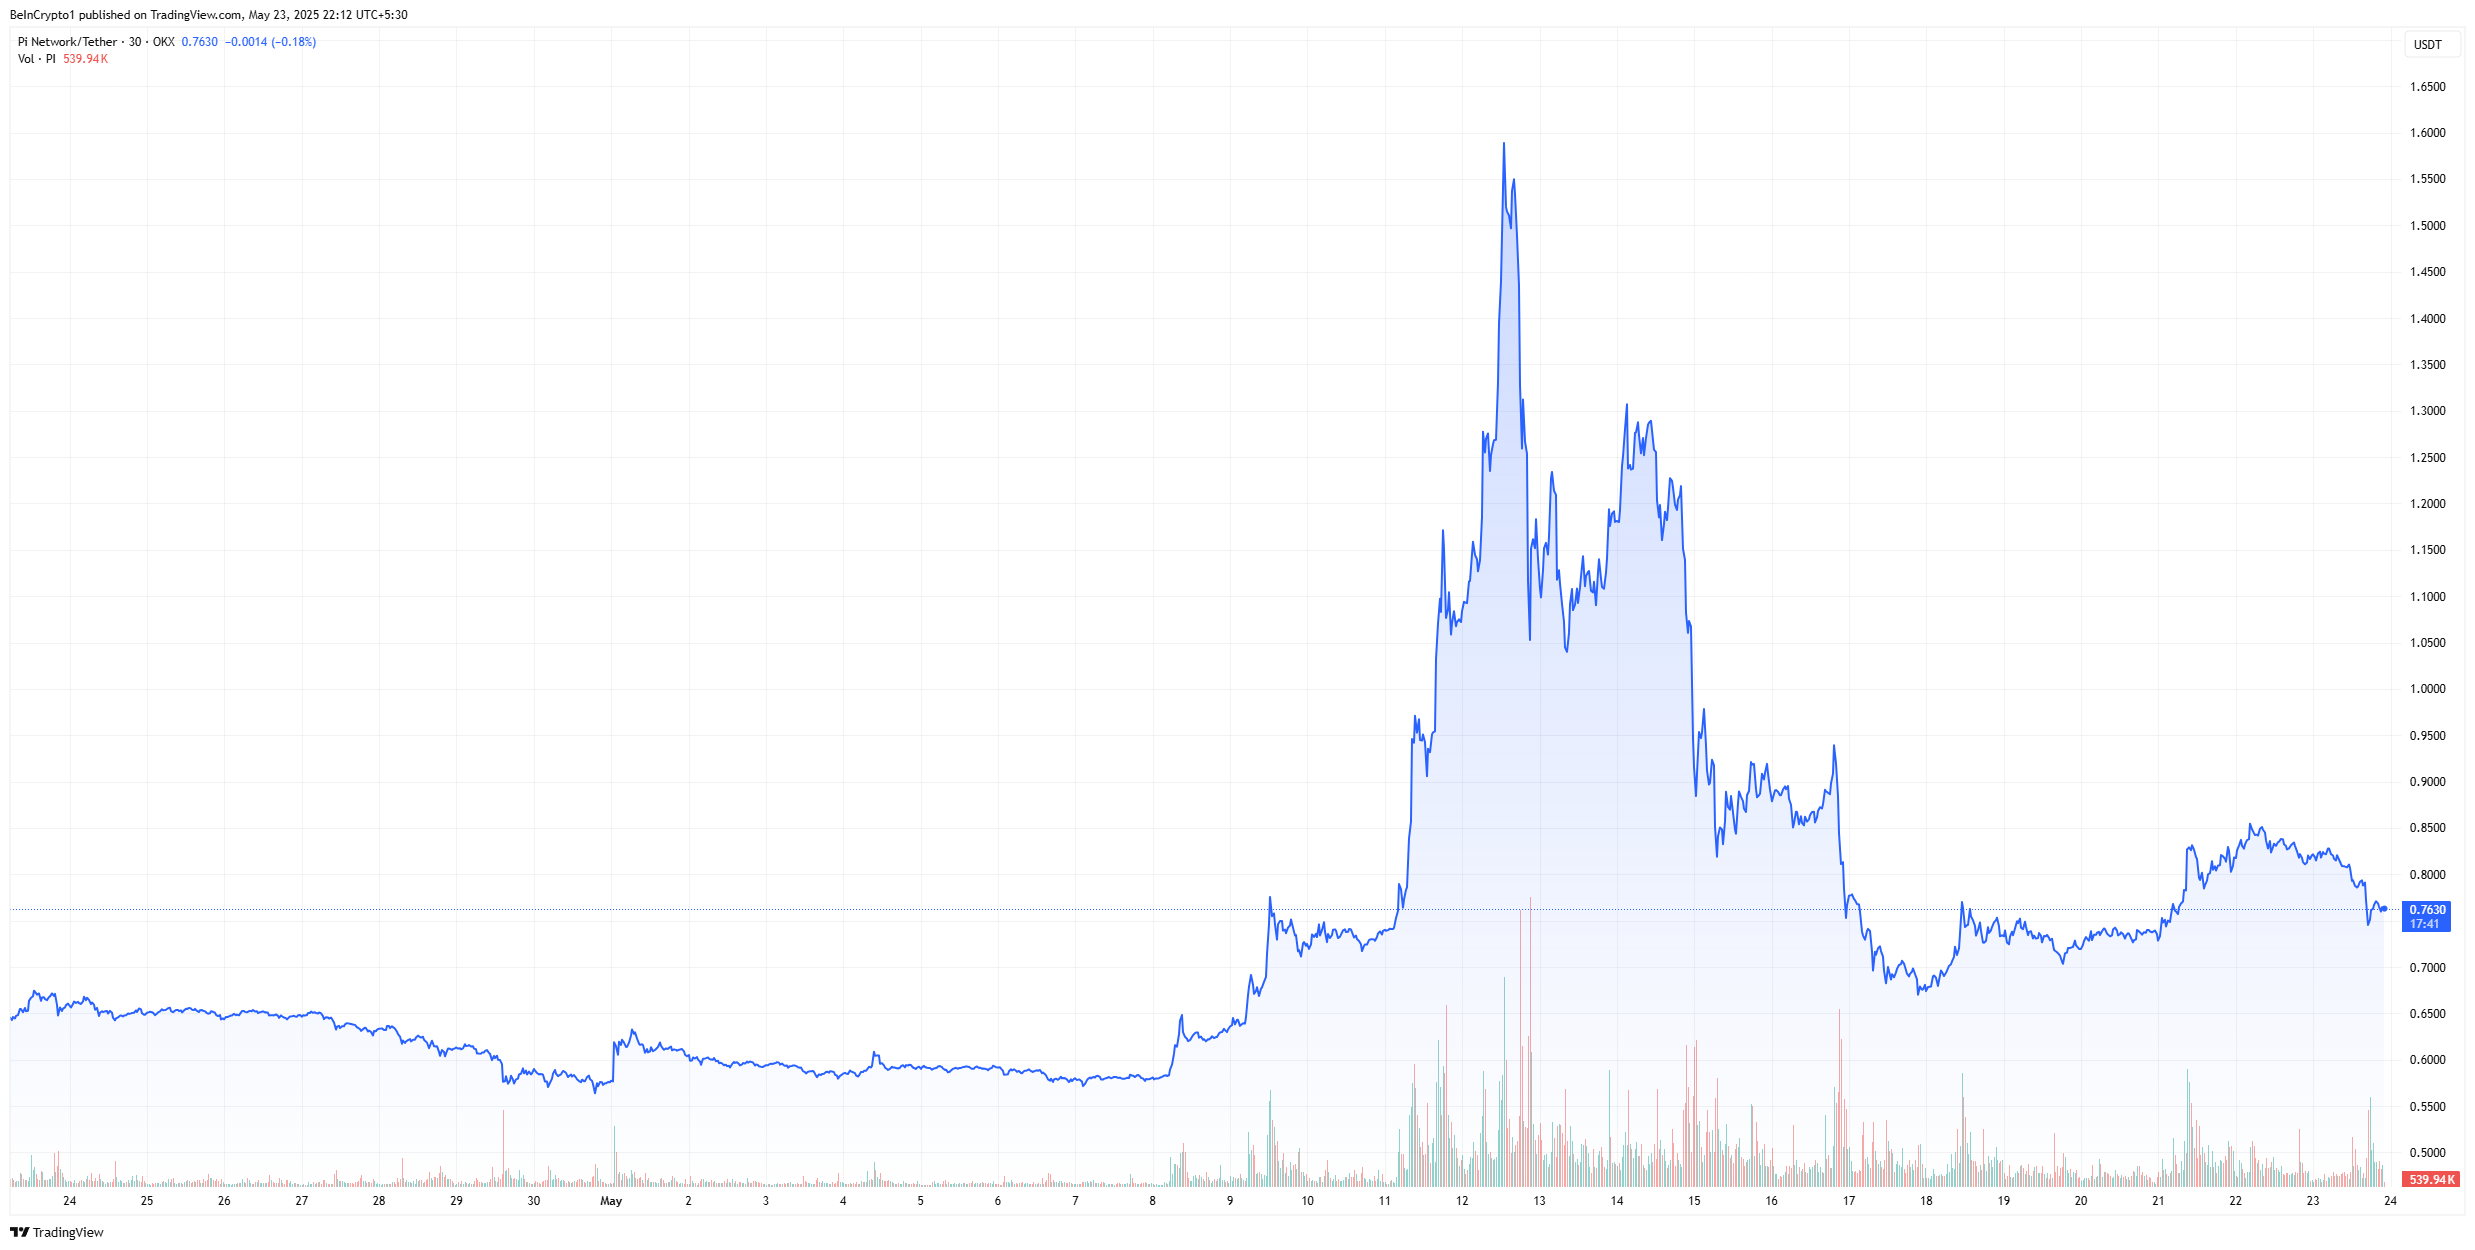
PI Network Price Chart In May 2025. Source: TradingView
With futures now in play, bearish traders may open leveraged shorts, potentially accelerating PI’s downward momentum.
Meanwhile, increased volatility could trigger liquidations on both sides, causing sudden price spikes or crashes.
While the futures listing opens new opportunities, it also raises the stakes. Traders should monitor funding rates and open interest to gauge the strength of directional bets.
Overall, Kraken’s move brings new visibility to Pi Network. But for now, there is a lot of skepticism regarding the altcoin’s direction in the spot market.
Welcome to the US Crypto News Morning Briefing—your essential rundown of the most important developments in crypto for the day ahead.
Grab a coffee to understand why the share price of Cantor Equity Partners Inc. (CEP) is seeing downside pressure while the share price of Strategy’s stock (MSTR) is increasing. CEP is the company behind 21 Capital, a newly established firm imitating Strategy’s Bitcoin model.
Crypto News of the Day: Max Keiser Issues 21 Capital Warning as CEP Shares Sink
Twenty One Capital’s ambitions to become the next major corporate Bitcoin player are under fire. The share price of its holding company, Cantor Equity Partners Inc., is bearing the brunt of overhead pressure.
The CEP stock price is down by over 6% in the last five trading days. Meanwhile, the share price of its market rival, Strategy (formerly MicroStrategy), is up by over 7%.
Headed by James Mallers, Twenty One Capital presented as Strategy’s inadvertent market rival, or peer. It introduced BTC-native metrics like Bitcoin Per Share (BPS), effectively challenging Strategy’s model, where investors have indirect exposure to Bitcoin through MSTR stock.
In a recent US Crypto News publication, Bitcoin pioneer Max Keiser said institutions must “Saylorize” or die. Nevertheless, despite Twenty One Capital extending the “Saylorization” trend, the CEP stock price continues to endure downward pressure while Strategy’s stock price is gaining.
Against this backdrop, investors hoped that hype around Cantor Equity Partners Inc.’s planned SPAC merger could reverse the trend, but this appears to be false hope. Notably, the merger would see CEP stock listed under the new ticker XXI.
“Cantor Equity Partners (CEP) announced a merger with bitcoin treasury company Twenty One Capital in a $3.6 billion merger,” reports indicated.
The announcement propelled shares of the SPAC vehicle, Cantor Equity Partners (CEP), sharply higher, but now momentum is fading.
Investors who hoped for a post-merger rally have watched the stock drift downward toward the mid-$20s over the past five days.
BeInCrypto contacted Max Keiser for insights into why this is happening, with the Bitcoin maxi blaming it on Twenty One Capital’s model mimicking Strategy.
Mimicking Strategy Could Be Detrimental, Max Keiser Says
According to Max Keiser, Twenty One Capital’s attempt to mimic Strategy could prove far riskier and less effective.
“There’s a big difference between a company with a Bitcoin treasury strategy and a Bitcoin strategy company,” Keiser told BeInCrypto.
Keiser says Strategy is leveraging its heft as a company with lots of Bitcoin, harnessing volatility to buy more BTC. However, Cantor Equity Partners Inc. or Twenty One Capital does not meet that standard.
“CEP is a company that is looking to buy lots of Bitcoin, which is very volatile. I question if they can effectively harness that volatility like Strategy does,” he added.
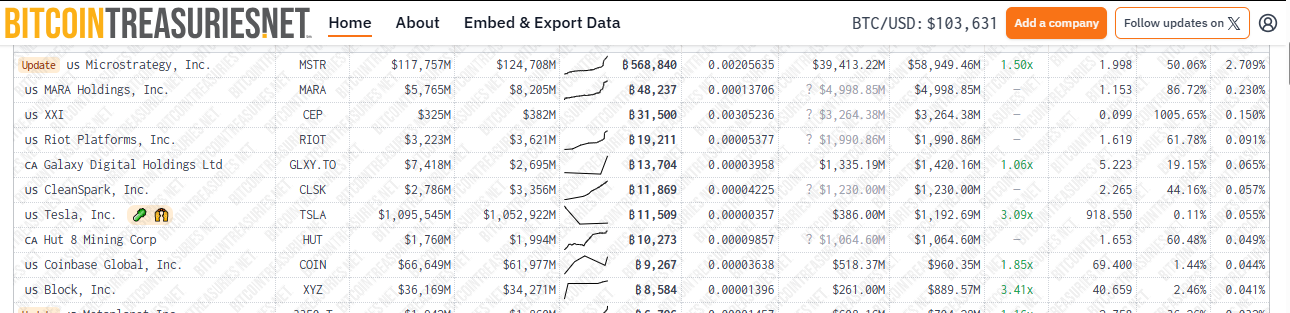
Twenty One Capital is the third-largest corporate Bitcoin holder after Strategy and Bitcoin mining firm MARA Holdings. Data on Bitcoin Treasuries shows Strategy holds 568,840 BTC, while MARA holds 48,237 Bitcoin tokens.
Meanwhile, after Tether acquired 4,812.2 Bitcoin (now held in an escrow wallet as Twenty One Capital prepares to complete a SPAC merger with Cantor Equity Partners), Twenty One Capital holds 36,312 Bitcoin tokens.
Corporate Bitcoin holders by portfolio size. Source: Bitcoin Treasuries.
In the interview with BeInCrypto, Keiser articulated that trying to copy Strategy’s model without the infrastructure, discipline, or scale puts 21 Capital in a precarious position.
“A Bitcoin strategy company is inherently riskier, with no clear path to be as competitive as Strategy in leveraging market volatility to capture more Bitcoin,” he stated.
Further, despite the surge in interest from investors hoping to jump on what appeared to be the “next big BTC play, Keiser believes the long-term winner is already clear.
“Ultimately, the big winner will continue to be Strategy, with dozens of knock-offs trying to catch them, failing to generate the same returns, but increasing demand for Bitcoin substantially. That ends up benefiting STRATEGY proportionately more than the knock-offs, with less risk,” he concluded.
This aligns with a sentiment from Steven Lubka, the Head of Swan Private Wealth. As BeInCrypto noted in one of the US Crypto News publications, Lubka said the inadvertent competition between Twenty One Capital and Strategy will ultimately bode well for Strategy.
“Ironically, someone throwing the gauntlet at Microstrategy, ‘we want to become the most successful company in Bitcoin, ‘ Only makes Microstrategy more valuable,” Lubka remarked.
Charts of the Day
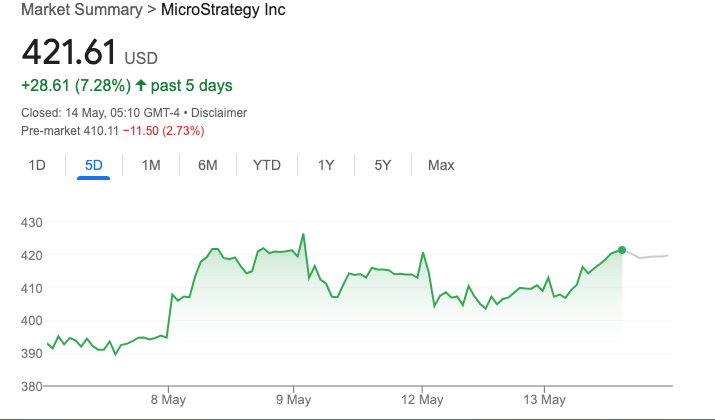
Strategy’s MSTR stock price performance. Source: Google Finance
This chart shows Strategy Inc.’s stock price rose by $28.61 or 7.28% over the past five days, closing at $421.61 on May 14.
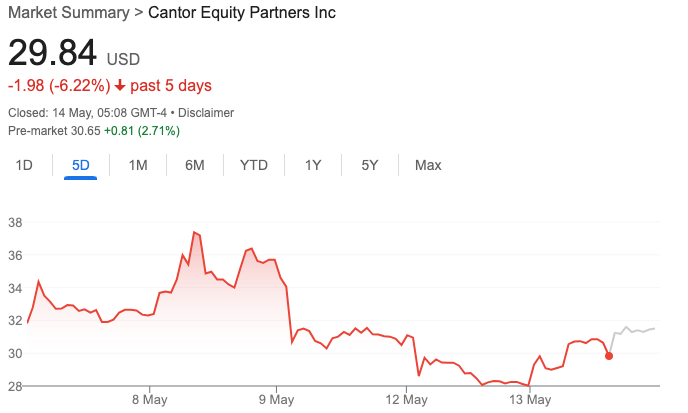
Cantor Equity Partners (CEP) stock price performance. Source: Google Finance
This chart shows a 5-day decline in Cantor Equity Partners Inc.’s stock price, down by 6.22% since May 7. CEP closed at $29.84 on Tuesday and is attempting a slight pre-market recovery.
Byte-Sized Alpha
Here’s a summary of more US crypto news to follow today:
Ethereum (ETH) is up more than 10% over the last seven days as the market shows signs of renewed activity. However, key technical indicators reveal a mix of weakening trend strength and cautious optimism from buyers.
ETH is currently battling critical resistance zones that could define whether the rally continues or fades. With momentum still fragile, May could be a decisive month for Ethereum’s next major move.
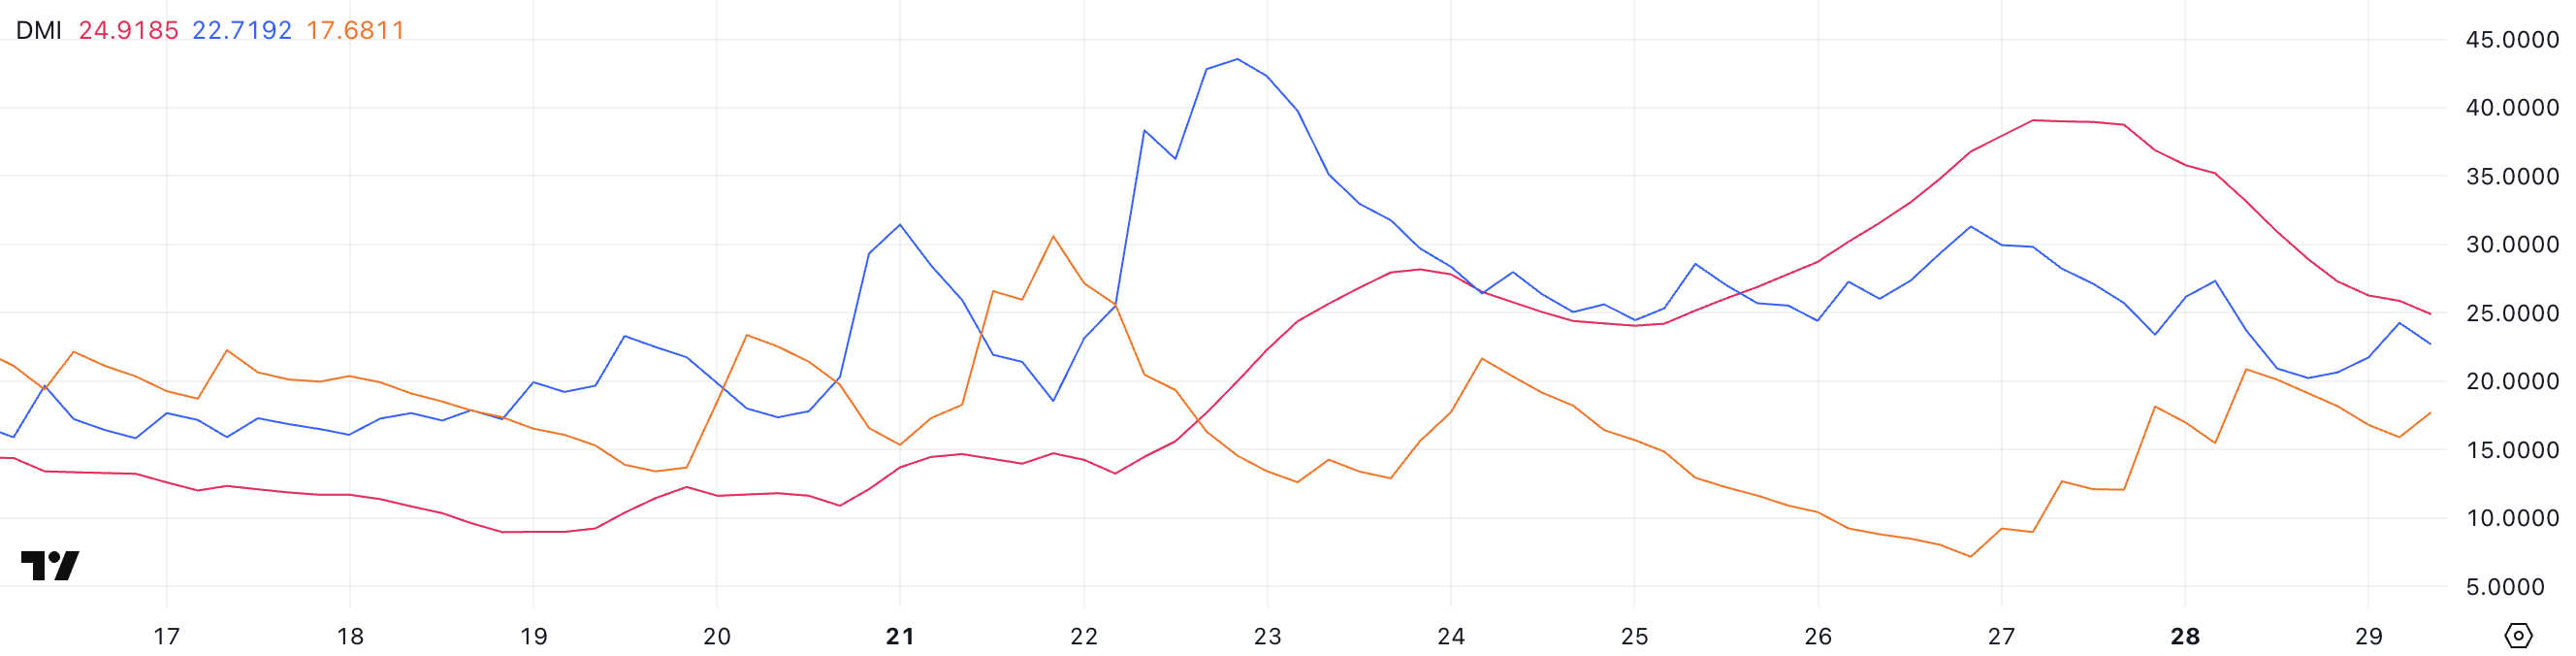
Ethereum’s Trend Weakens Sharply as Bears Close In
Ethereum’s DMI chart shows its ADX is currently at 24.91, a sharp decline from 39 two days ago. The ADX, or Average Directional Index, measures the strength of a trend, whether up or down.
Generally, an ADX reading above 25 signals a strong trend, while values below 20 suggest the market is entering a period of weakness or range-bound trading.
The steep drop in ADX indicates that Ethereum’s recent momentum is quickly losing strength. Without renewed buying or selling pressure, ETH could remain stuck in a more volatile, sideways pattern over the short term.
Meanwhile, the directional indicators are showing a clear shift. The +DI, which tracks bullish pressure, has dropped to 22.71, falling from 31.71 three days ago and 27.3 yesterday.
In contrast, the -DI tracks bearish pressure has climbed to 17.68, up from just 7.16 three days ago and 15.64 yesterday. Yesterday, the gap between buyers and sellers nearly closed, with +DI at 20.91 and -DI at 20.1, suggesting sellers almost regained market control.
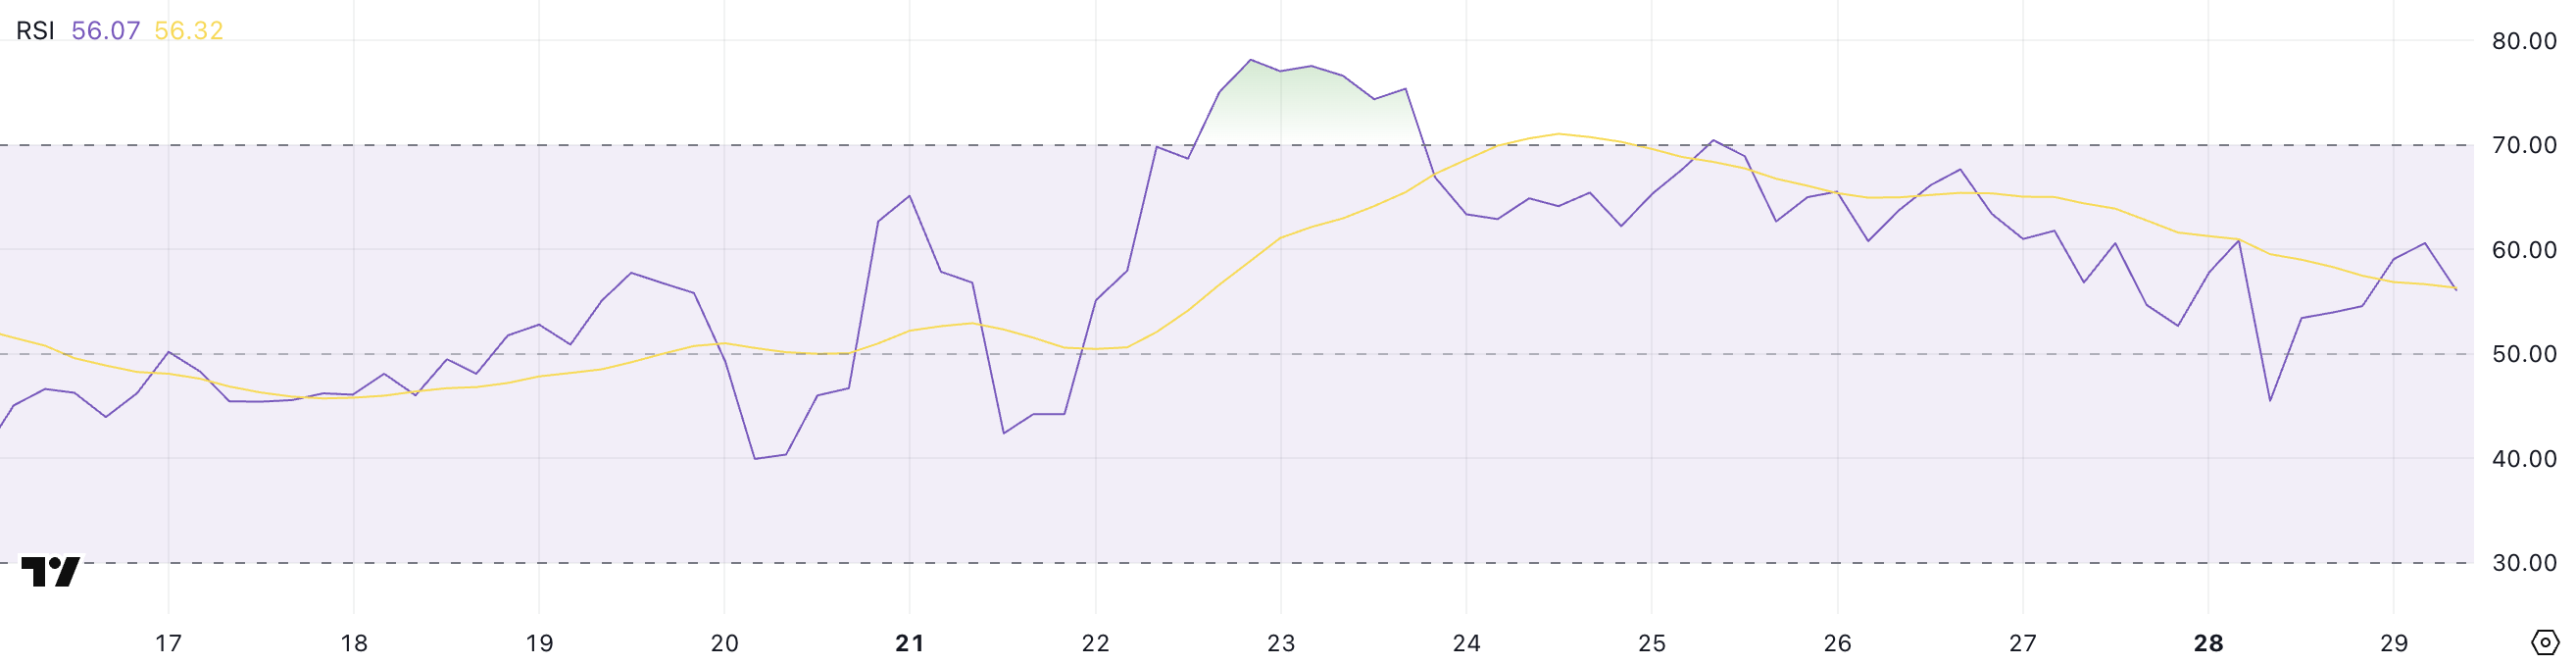
ETH RSI Climbs After Sharp Drop: Will the Recovery Hold?
Ethereum’s RSI is currently sitting at 56, up from 45.5 one day ago, after reaching 70.46 four days ago. The Relative Strength Index (RSI) is a momentum indicator that measures the speed and magnitude of price movements.
Typically, an RSI above 70 suggests an asset is overbought and may be due for a pullback, while an RSI below 30 indicates oversold conditions and the potential for a rebound.
Readings between 30 and 70 are considered neutral, with levels around 50 often signaling a market at a decision point. The sharp swing in Ethereum’s RSI over the past few days reflects the recent volatile sentiment around ETH.
With the RSI back up to 56, Ethereum has regained momentum after dipping into neutral-to-bearish territory. A reading above 50 leans slightly bullish, suggesting that buyers have started to reassert some control, though not with overwhelming strength.
However, if momentum stalls again and the RSI turns back down, it would suggest the recovery is losing steam and that Ethereum could fall back into a broader consolidation or even a correction phase.
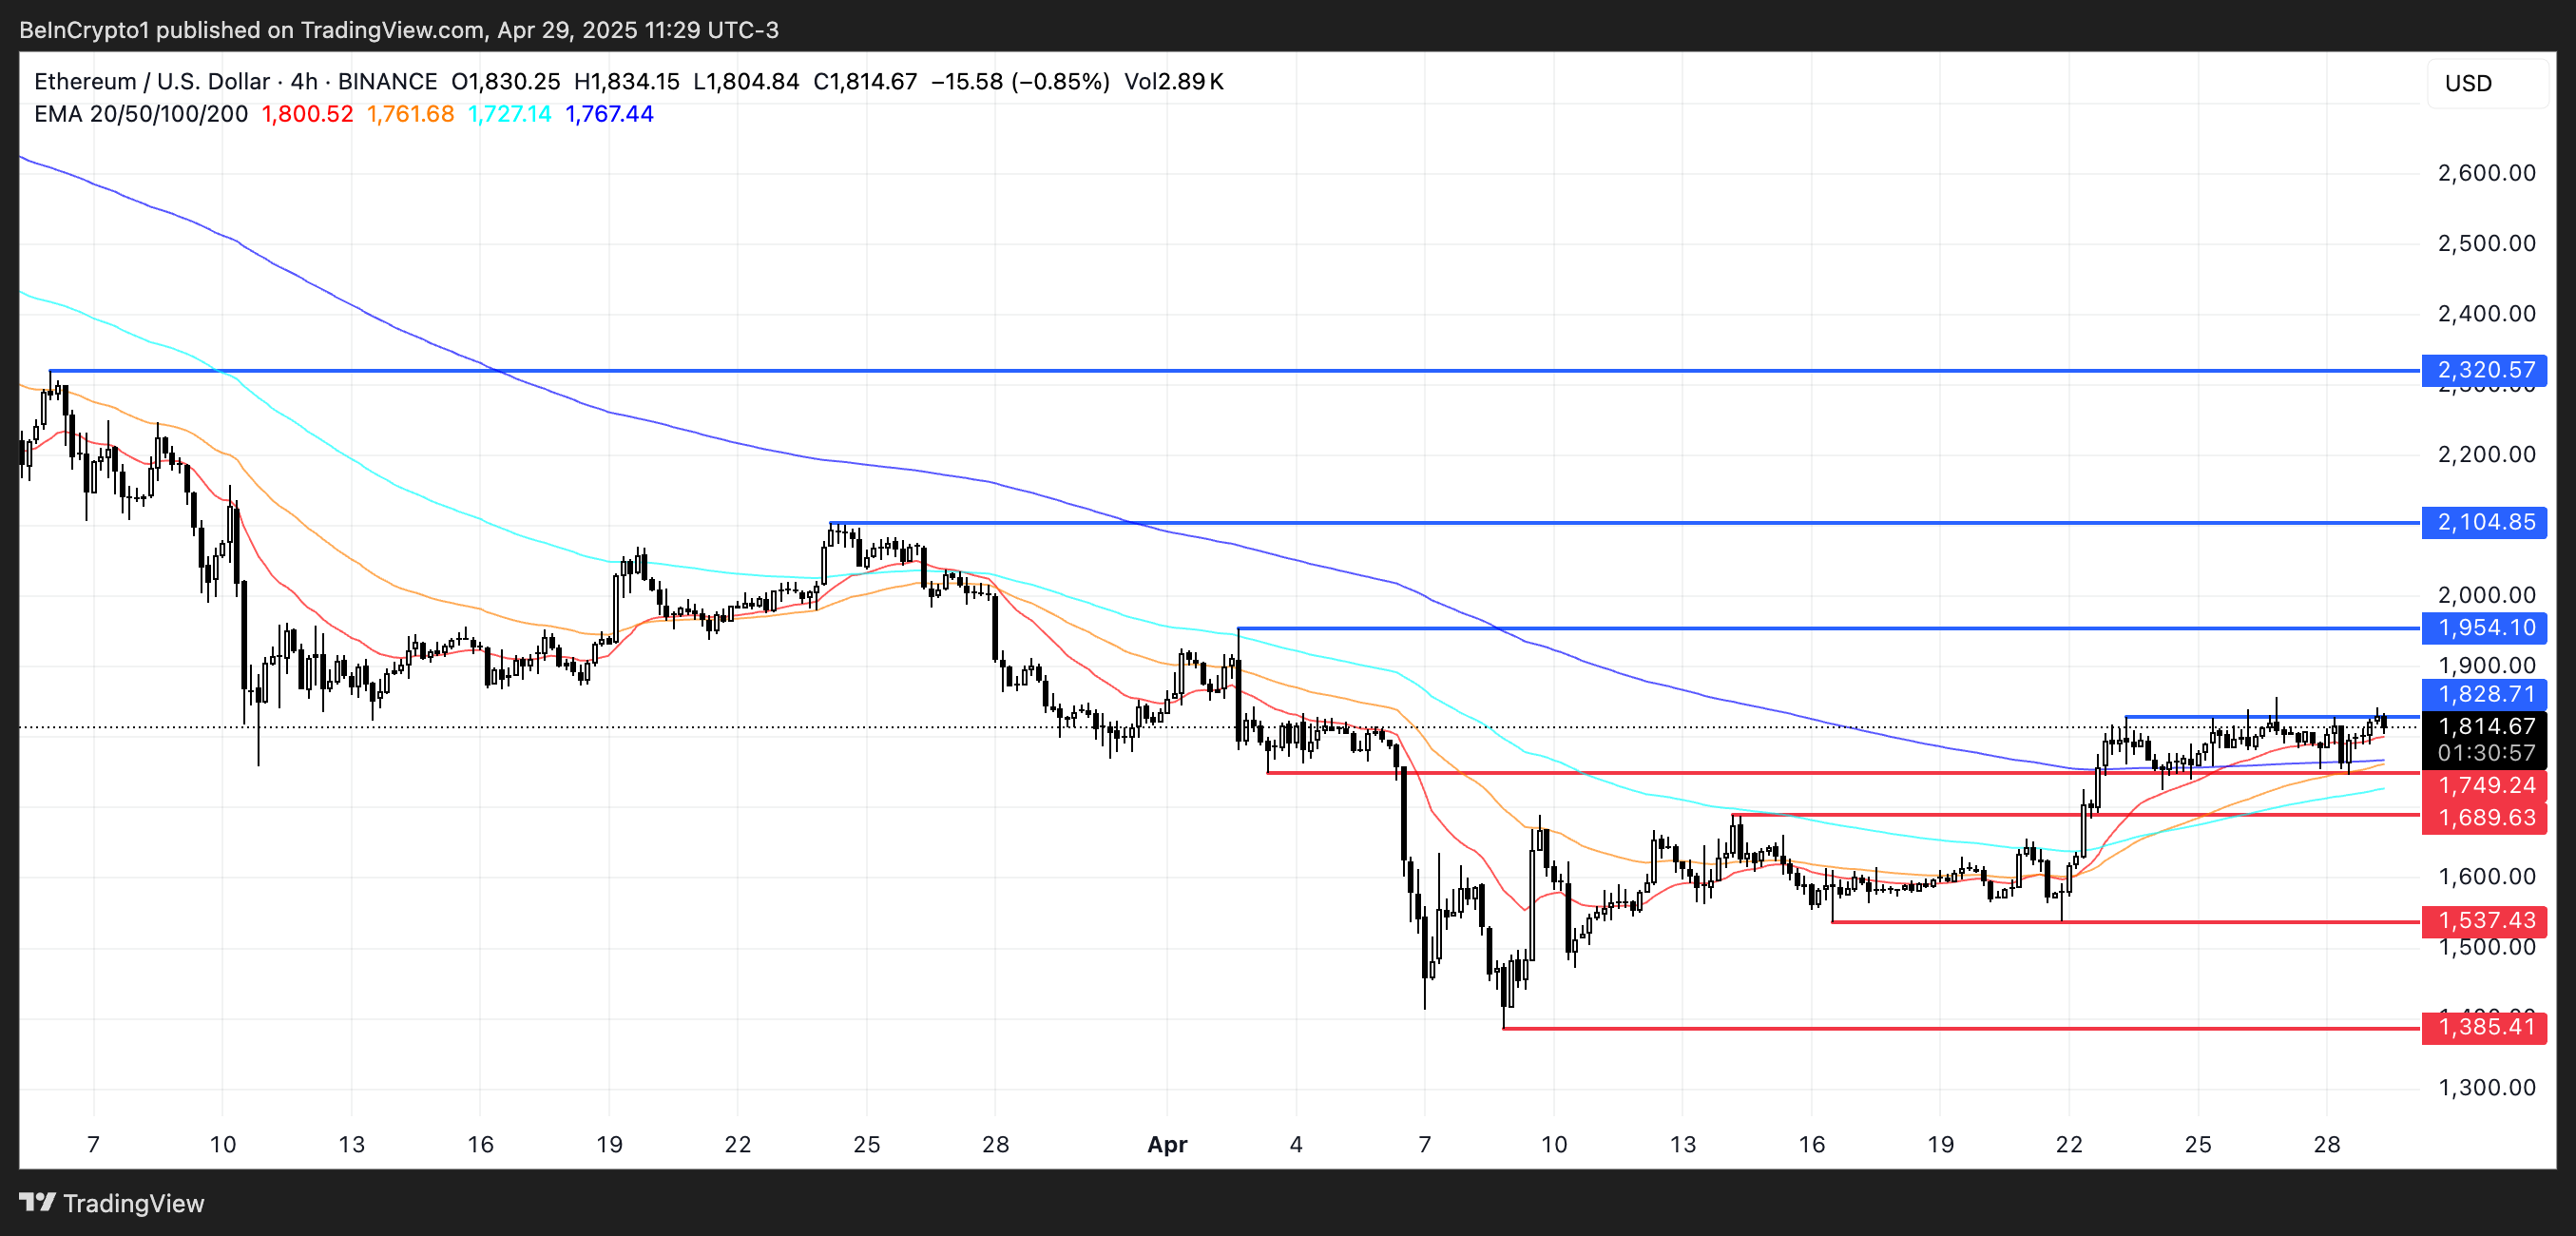
Ethereum Battles Key Resistance as Breakout or Breakdown Looms
Ethereum price has made several attempts over the past few days to break above the resistance level at $1,828. If ETH manages to break and hold above this level decisively, it could open the door for a stronger move upward.
The next major target would be $1,954, and if bullish momentum remains strong, a further rally toward $2,104 could unfold. Ethereum could eventually test $2,320 in an even more aggressive uptrend, marking a significant bullish extension.
These levels will be key to watch as they could define the strength and sustainability of any breakout in the coming days.
On the downside, if Ethereum fails to hold its current levels and the trend reverses, the first critical support to watch lies at $1,749. A break below that could trigger a move lower toward $1,689.
Losing these levels would signal a much deeper correction, suggesting that the recent attempts at recovery were only temporary before a more prolonged bearish phase sets in.


40+ collateral options
https://t.co/NHHpKobugb