Pi Network has been facing a challenging period after its price dropped by 18% in the last 48 hours.
This drop has invalidated its recent attempt to recover losses from March. The altcoin is now vulnerable to further corrections, raising concerns among investors.
Pi Network’s Bearishness Could Grow
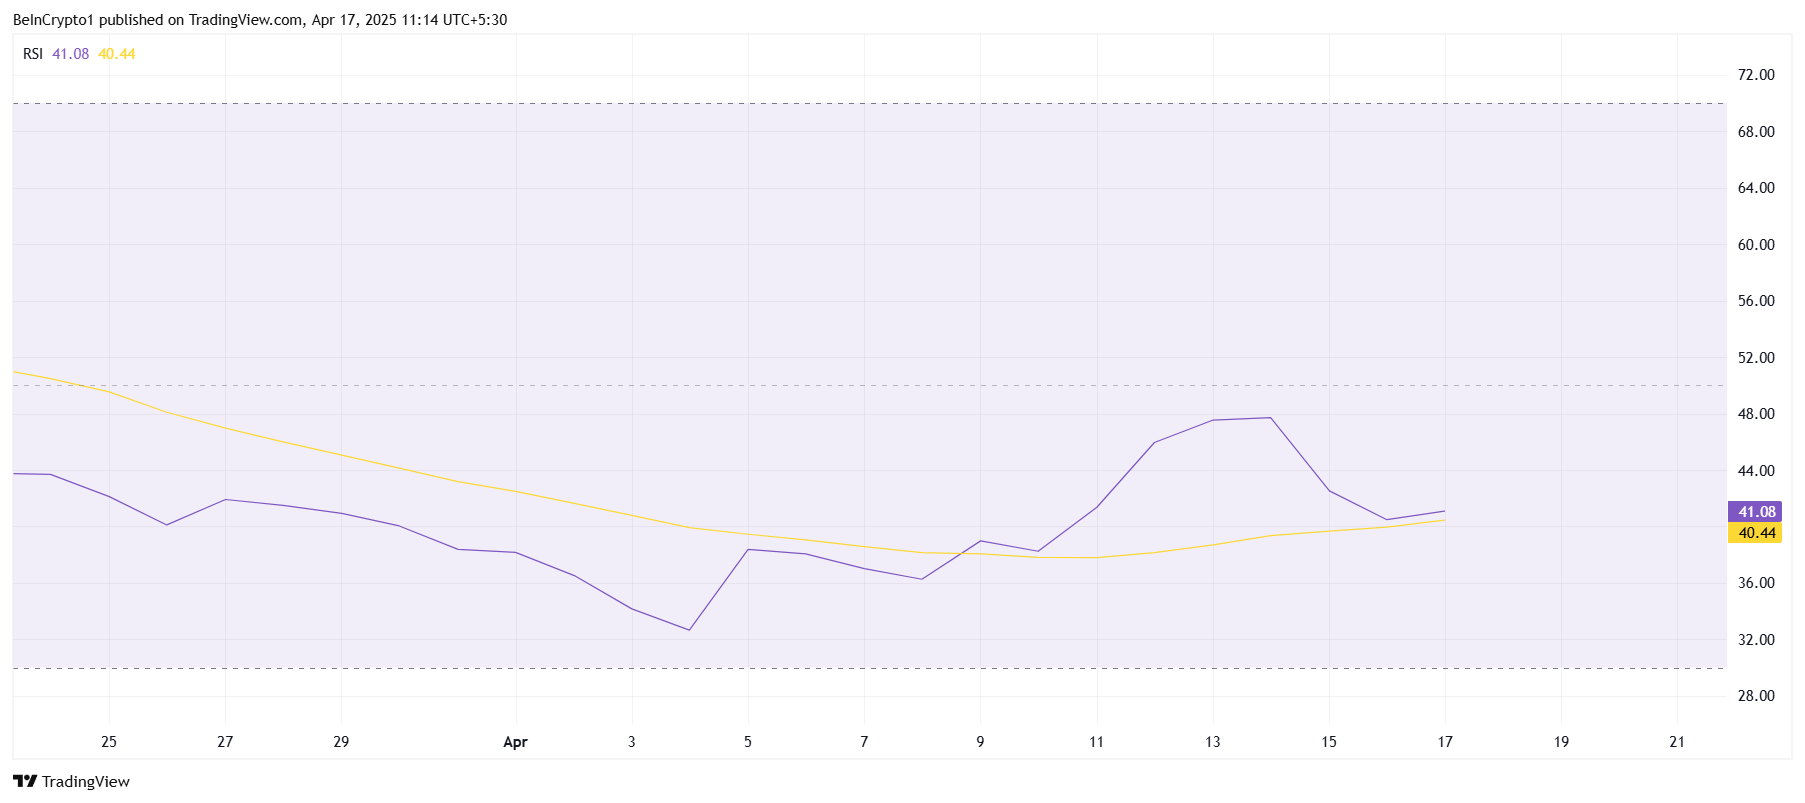
The Relative Strength Index (RSI) continues to indicate that bearish momentum is still present. Currently stuck below the neutral line of 50.0, the RSI is signaling a lack of bullishness for Pi Network. This suggests that the altcoin may face additional downward pressure in the coming days.
The ongoing negative sentiment is compounded by the general market’s lack of momentum. Investors are hesitant to buy Pi Network due to the failure to sustain price recoveries. With no clear bullish signal from the RSI, the risk of further declines remains high.
The Bollinger Bands are narrowing, indicating that Pi Network may soon experience a surge in volatility. This contraction typically signals an impending price breakout or breakdown. However, if the bearish momentum continues, Pi Network could face a sharp decline, confirming the downward trend.
Given the current squeeze in the Bollinger Bands, Pi Network’s price could see a significant move soon. If the bearish trend holds, this volatility may drive the price lower, exacerbating the altcoin’s already weak performance. The uncertainty surrounding the market adds to the vulnerability of Pi Network.
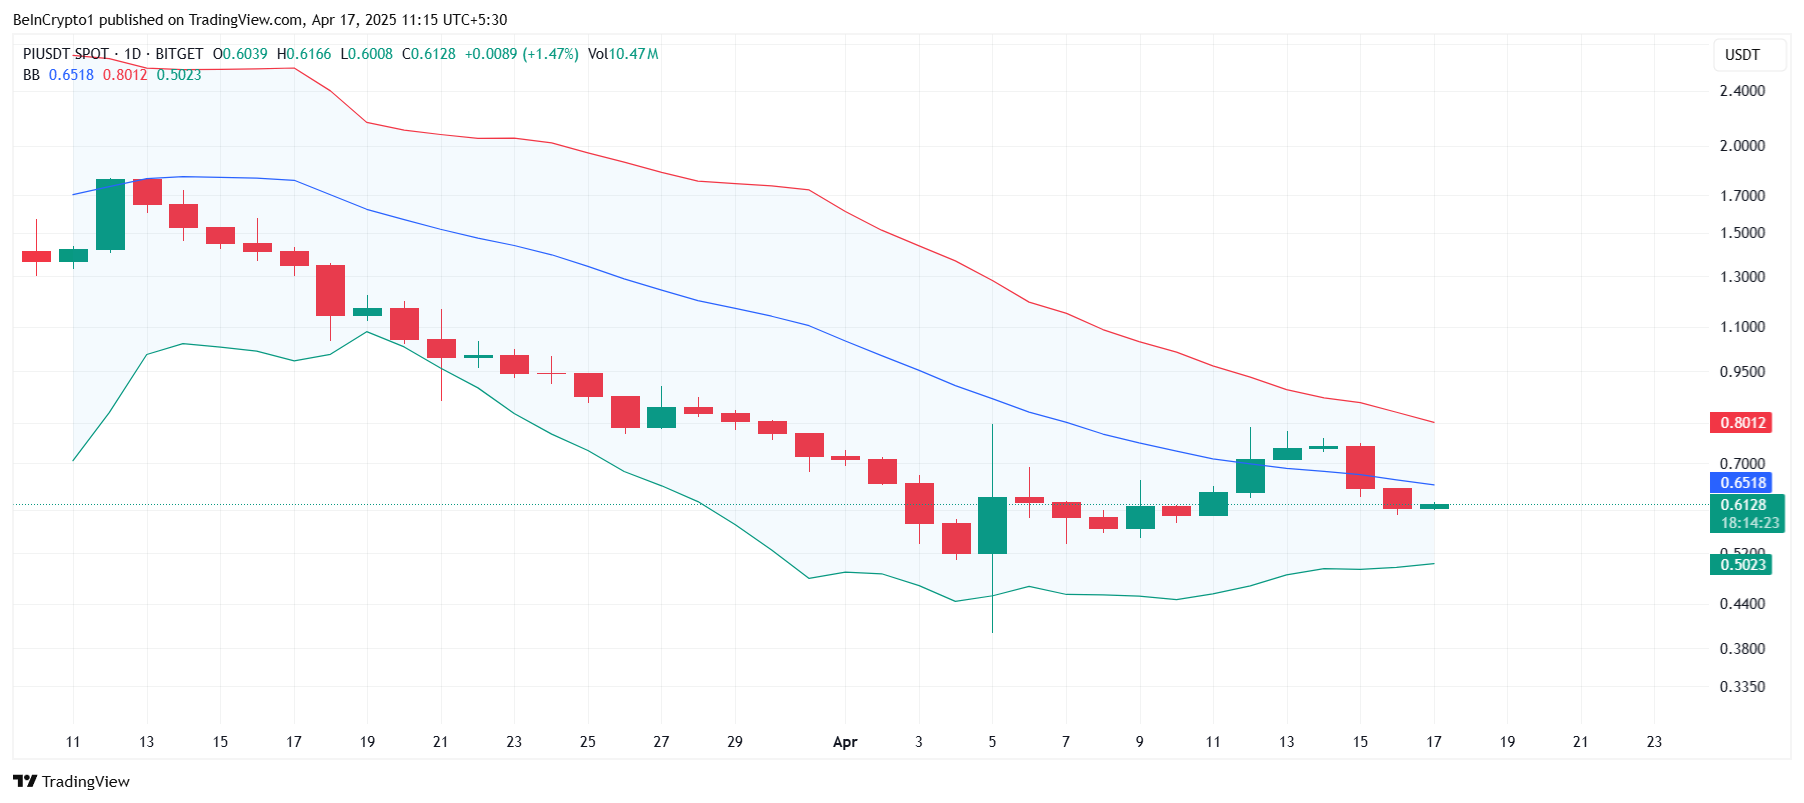
Pi Network’s price is currently at $0.613, but it is still stuck below the $0.617 resistance level. After the 18% drop in the last two days, the altcoin remains under pressure. If the price continues to face downward momentum, it may struggle to break through key resistance levels.
The next major support level for Pi Network is $0.519, which could be the next target if the selling pressure intensifies. A drop to this level could be a precursor to further declines, potentially bringing the price below $0.500. This would significantly impact investors holding the altcoin.
However, if Pi Network can reclaim the $0.617 support, it could break the downtrend and rise toward $0.710. Breaching this resistance would invalidate the bearish outlook and could spark a recovery, giving investors hope for a reversal.
SUI meme coins are gaining major traction as the SUI ecosystem continues to strengthen. SUI DEX volume has surged to $3.8 billion over the past seven days, up 74%, making it the fifth-largest chain by decentralized trading volume and surpassing Arbitrum.
As interest in SUI grows, top meme coins like Sonic Snipe Bot (SONIC), LOFI, MEMEFI, MIU, and Fud the Pug (FUD) are showing a mix of strong momentum and key technical tests. The next few days could be crucial in deciding which tokens emerge as leaders in the fast-growing SUI meme coin space.
Sonic Snipe Bot (SONIC)
Sonic Snipe Bot is an automated trading tool built for lightning-fast trade executions. It is fully integrated into the Telegram application and stands out by offering support for 31 blockchain networks, including Sui, Ton, Injective, Solana, and Tron.
Sonic Snipe Bot also supports all major bonding curves, such as Movepump on Sui, making it a flexible and powerful option for traders looking to operate across multiple ecosystems without leaving Telegram.
Over the past seven days, SONIC, the native token tied to the bot, has surged by 27%, pushing its market cap to approximately $1.7 million. If positive momentum continues, SONIC could rise above the $0.40 mark and potentially challenge the $0.426 level.
However, if the trend reverses and selling pressure builds, the token could fall back toward $0.29, and in a stronger downtrend, even $0.24 could be tested.
LOFI
LOFI is one of the biggest meme coins on the SUI blockchain, built around the theme of a Yeti character. Despite its strong brand and visibility, LOFI stands out for a less positive reason this week—it is the only token among the top 10 SUI meme coins that is down over the past seven days.
This relative underperformance could indicate weakening investor interest compared to its peers, or it could present a potential rebound opportunity if sentiment around SUI meme coins remains strong overall.
LOFI continues its push to become one of the most recognized meme projects on the SUI blockchain. If momentum recovers, LOFI could rise above the $0.045 mark and potentially challenge $0.054 in an extended rally.
However, the $0.030 support level remains critical. A break below this zone could trigger a steeper decline toward $0.0158, and if selling pressure accelerates, even $0.0055 could be tested.
MemeFi (MEMEFI)
MEMEFI is a Telegram-based game and Web3 meme universe that claims to have more than 50 million players worldwide. It has quickly climbed the ranks and is now the second-largest SUI meme coin by market cap, currently at $35 million.
This marks a sharp pullback from its peak of $51 million reached just yesterday, reflecting the recent correction underway.
Despite the decline, MEMEFI is still up an impressive 353% over the past seven days.
If MEMEFI can regain its bullish momentum, it could first aim to break above the resistance at $0.0037. A successful breakout would open the path toward $0.0053, potentially extending its rally.
However, if the ongoing correction deepens, the first major support to watch is at $0.0026. A break below that could push the price further to $0.00185; if selling pressure intensifies, even $0.00143 could come into play.
MIU
MIU is currently the biggest meme coin on the SUI network, boasting a market cap of $68 million. Its price has climbed 16.7% over the past seven days, reinforcing its leadership position within the growing SUI meme coin ecosystem.
MIU is by far the largest meme coin in this space, with no close competitors matching its size or visibility. As the broader SUI ecosystem gains momentum and attracts more attention, MIU could continue to benefit from the overall surge in interest.
As the dominant player, it stands in a strong position to ride the next wave of growth if the trend across SUI meme coins remains positive.
If the positive momentum around MIU continues, the token could rise to test the $0.000000080 level, marking a new short-term target.
However, if the trend weakens and selling pressure emerges, MIU could first fall toward support at $0.0000000689. A deeper correction could even push the price down to $0.0000000599.
Fud the Pug (FUD)
This one is another meme coin aiming to carve out a leading spot in the growing SUI meme coin ecosystem. FUD currently holds a market cap of $3.8 million, down from its peak of $5.9 million just two days ago.
Despite a nearly 5% drop over the last 24 hours, FUD remains up an impressive 41% over the past seven days, highlighting strong underlying momentum.
Technically, FUD recently tested the support level at $0.0000000634. If this level is tested again and fails to hold, the next downside target would be around $0.000000050.
On the upside, if the current pullback stabilizes and momentum returns, FUD could rise to challenge resistance at $0.000000075. A breakout above that could pave the way for a push toward $0.00000010.
With dog-based meme coins often attracting outsized attention and hype, FUD could have a strong chance to expand its market presence if broader interest in SUI meme coins continues to grow.
Ethereum (ETH) shows signs of strength and caution after a sharp 49% rally in the past week. While its market cap has returned above $300 billion and EMA indicators remain bullish, momentum indicators are starting to cool.
The ADX has dropped from 61 to 47.99, and RSI has fallen from 86 to 63, suggesting the uptrend may be losing steam. However, buyers are still active, and if ETH breaks above key resistance, the next leg higher could take it past $3,000.
ETH DMI Signals Cooling Rally and Rising Bearish Pressure
Ethereum’s DMI indicator shows that its ADX has dropped from 61 to 47.99, signaling a weakening trend strength.
The ADX (Average Directional Index) measures the intensity of a trend, with values above 25 indicating a strong trend and above 40 suggesting very strong momentum.
The +DI line has fallen sharply from 47.96 to 27.2, showing that bullish momentum has cooled significantly.
Meanwhile, the -DI line has climbed from 3.39 to 13.97, suggesting that bearish pressure is starting to rise.
While the trend still favors the bulls, the gap between +DI and -DI is narrowing, and if this continues, Ethereum could face a short-term pullback or enter a consolidation phase. However, in the last hours +DI went up and -DI went down, suggesting ETH buyers are trying to maintain their control.
Ethereum RSI Cools From Overbought Zone but Remains Bullish
Ethereum’s RSI has dropped to 63 from a high of 86 three days ago, after holding above the overbought threshold of 70 for three straight days.
Interestingly, despite the recent dip, RSI has bounced from 54 just a few hours ago, suggesting some renewed buying interest in the short term.
RSI (Relative Strength Index) is a momentum indicator that ranges from 0 to 100. Readings above 70 typically indicate overbought conditions and potential for a pullback, while readings below 30 suggest oversold conditions and a possible bounce. Values between 50 and 70 generally point to moderate bullish momentum.
At 63, Ethereum’s RSI shows that the asset has cooled off from recent overbought levels but still maintains underlying bullish strength. This could mean the market is resetting after a strong rally, allowing room for another leg up if buying continues.
Ethereum Eyes $3,000 After 43% Weekly Surge, But Key Resistance Holds
Ethereum price is up 43.5% over the past seven days, with its market cap climbing back above $300 billion. Its EMA lines continue to show a strong bullish structure, reinforcing the current uptrend.
However, ETH recently tested the $2,617 resistance and failed to break through.
A successful breakout above that level could open the path toward $2,855 and even $3,000 for the first time since early February, with a possible extension to $3,442 if momentum accelerates.
On the downside, the $2,320 support is key. If ETH tests and loses that level, the price could slide to $1,938. A stronger bearish move might push it further down to $1,736.