Pi Coin is making waves today, rising 7.7% to trade at $0.4866 following a technically significant falling wedge breakout. This price rally, driven by a massive spike in trading volume and favorable market sentiment, marks a potential turning point for the token after weeks of consolidation. As Pi’s app ecosystem expands rapidly, market participants are increasingly optimistic about the Pi coin price. And I thought of bringing to you Perplexity’s Pi coin price prediction this week.
Perplexity’s Pi Price Analysis
Perplexity’s forecast suggests Pi Coin is expected to trade within the $0.4470–$0.5200 range this week, with an average price near $0.4820. The AI model highlights that a breakout from a falling wedge pattern signals a reversal of prior bearish trends. This is while ecosystem growth and increased altcoin rotation fuel bullish momentum.
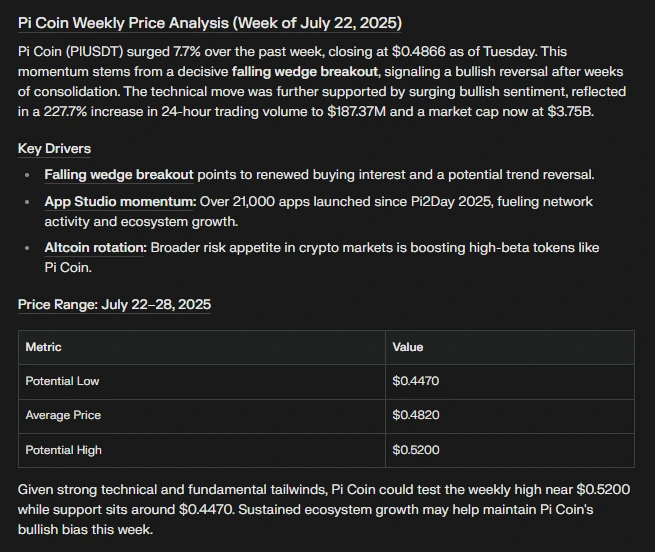
Perplexity believes that a strong support at $0.4470 could act as a cushion in case of market pullbacks. While the upside potential for Pi price remains open above $0.52 if current tailwinds persist.
FAQs
What is Pi price today?
The price of 1 Pi coin at the time of press is at $0.4866, with an intraday gain of 7.7%.
Why is Pi’s price up today?
The Pi price rally was triggered by a falling wedge breakout, a bullish technical pattern, alongside strong trading volume and renewed ecosystem growth.
Where is the Pi Coin price heading this week?
Perplexity predicts Pi Coin could trade between $0.4470 and $0.5200, with $0.4820 as the average target.
After weeks of slow movement, Pi Coin made a strong comeback, jumping more than 25% in just one day. The price soared past $0.75 and is now sitting at $0.72, making it the top-performing major altcoin today. In the past 24 hours alone, Pi is up nearly 30%, with a 52% gain over the last 90 days.
The market is showing strong signs of optimism, with analysts pointing to a possible rise to $1 if this momentum continues. Technical indicators also look positive — the 10-day SMA (simple moving average) just crossed over, and the RSI (relative strength index) suggests a bullish trend. Pi Coin also hit a weekly high of $0.78, pushing its market cap beyond $5 billion.
Adding to the excitement, the Pi Network recently launched the Pi Ad Network, giving developers a new way to make money from their apps and boosting Pi’s real-world use. This is seen as a big move toward building a stronger, more useful ecosystem.
However, not everything is smooth sailing. A major unlock of 188 million PI tokens is expected in the next 30 days, according to PiScan. This could create selling pressure on the market. Also, while 87% of the community supports a Binance listing, the exchange has not yet taken action.
Even with the recent launch of the Pi Network’s mainnet, trading volume has dropped by 44%, signaling mixed investor interest.
What’s next?
All eyes are on the upcoming token unlock and whether Binance and other major exchanges will list Pi. These events could play a big role in shaping the coin’s future price.
The post Pi Network News: Pi Coin Nears $1 Ahead of Massive 188 Million Token Unlock appeared first on Coinpedia Fintech News
After weeks of slow movement, Pi Coin made a strong comeback, jumping more than 25% in just one day. The price soared past $0.75 and is now sitting at $0.72, making it the top-performing major altcoin today. In the past 24 hours alone, Pi is up nearly 30%, with a 52% gain over the last …
Bitcoin (BTC) price eyes a parabolic rally past $100,000 after BTC’s Realized Capitalization soared to an all-time high, a surge that has always preceded a strong upward trend. The rise in this metric comes as BTC defends $95,000, after President Trump’s relief on auto tariffs fuelled a recovery across financial markets.
BTC value today stands at $94,930 with a daily high of $95,443, as the Bitcoin Fear and Greed Index indicates that traders are in a state of “greed.” A deep dive into the Realized Cap and 2 other key metrics suggests that a major price increase is looming.
Bitcoin (BTC) Price Eyes Rally As Realized Capitalization Hits ATH
According to CryptoQuant data shared by analyst Carmelo, BTC’s Realized Cap, an on-chain metric used to measure the price at which BTC was last moved on-chain, has reached a record high of $882 billion. Per Carmelo, the surge indicates retail and institutional investors have re-entered the market and anticipate gains in the near term.
Bitcoin Realized Capitalization
As the chart above shows, a rise in the Realized Cap metric is often followed by a notable increase in the price of Bitcoin. Per Carmelo, history will likely rhyme, and an explosion is on the horizon. He opined,
“Although we have seen progressive gains since April 9, the price has not yet exploded significantly in a very short time frame, which is a typical characteristic of Bitcoin. However, if these accumulations continue, it is highly likely that such an explosion will occur.”
Interestingly, this is not the only on-chain metric hinting towards a BTC price explosion happening soon. The supply of BTC held in profit has surged past 90%, which analyst Darkfost noted has previously caused a euphoric phase, and the king coin is getting close to this level.
Bitcoin Percent Supply in Profit
Meanwhile, popular analyst Ali Charts noted that in the last two weeks, whales have accumulated 43,100 BTC valued at nearly $4 billion, an indication that these large addresses may be positioning for an uptrend. This further supports the argument that a BTC breakout past $100,000 is looming and may happen soon.
Bitcoin Technical Analysis – Key Support & Resistance Levels to Watch
Bitcoin trades within a giant falling wedge pattern on the daily chart, and is teasing a breakout above the upper trendline, a move that could spark a 21% price gain towards an all-time high of $115,000. The RSI line, which is tipping north and has reached a value of 66, supports the likelihood of a breakout happening, as bullish momentum surges.
However, for a bullish Bitcoin price forecast to play out, BTC needs to clear several hurdles. The first is resistance at $95,680, a level that also marks the upper descending trendline of the falling wedge. If it makes a decisive close above this resistance, it then needs to clear $99,690 for a run up to $115,000.
BTC/USDT: 1-day Chart
If this bullish thesis fails, and traders who bought during the rally decide to take profits and spark a downtrend, Bitcoin price faces support at $92,000, with a breach of this level set to drag the price down to $81,000. If this happens, the market sentiment will likely fall back into “fear” and invalidate the likelihood of a “euphoric phase” happening in the near term.