Pantera Capital disclosed for the first time that it has so far invested $300 million in digital asset treasury companies (DATs), according to its Blockchain Letter published August 12.
Pantera: DATs Deliver Higher Yields Than Spot Holdings
Pantera’s DAT portfolio includes investments in BitMine Immersion, Twenty One Capital, DeFi Development Corp, SharpLink Gaming, Satsuma Technology, Verb Technology Company, CEA Industries, and Mill City Ventures III.
The companies hold major cryptocurrencies including Bitcoin, Ethereum, Solana, BNB, TON, Hyperliquid, Sui, and Ethena, with operations spanning the U.S., U.K., and Israel.
Pantera argues that DAT investments deliver superior risk-adjusted returns compared to holding cryptocurrencies directly.
“DATs can generate yield that compounds net asset value per share, leading to accretive token exposure over time versus simply holding spot,” Pantera stated.
BitMine Immersion, Pantera’s first DAT investment and flagship example, is chaired by Fundstrat’s Tom Lee. The company targets controlling 5% of Ethereum’s total supply.
Since adopting its treasury strategy, BitMine has become the largest ETH treasury holder and third-largest DAT globally, holding 1.15 million ETH valued at $4.9 billion as of August 10. BitMine ranks as the 25th most liquid U.S. stock, averaging $2.2 billion in daily trading volume.
So just how effective has @BitMNR been at creating value for shareholders?
So far: extremely@cosmo_jiang breaks down what’s driving the surge in BMNR price – which, surprisingly, has been driven less by ETH’s rally than most would expect: https://t.co/3wRzxqknBl
Pantera compares DAT valuations to traditional banks, arguing that premium valuations are justified when investors trust a company’s ability to grow net asset value sustainably.
“The highest quality banks trade at a premium to NAV (or book value), such as JPM at >2x,” Pantera explained. “Similarly, investors may choose to value a DAT at a premium to NAV if they believe it can sustainably grow NAV per share.”
The resurgence in broader market activity over the past 24 hours has triggered an uptick in bullish bias towards Hedera (HBAR), with traders increasingly betting on further price gains.
HBAR’s long/short ratio has climbed to its highest level in the past month, signaling a shift in trader positioning.
Bullish Bets Push HBAR Toward Breakout Territory
HBAR’s long/short ratio currently stands at 1.09, its highest level in the past 30 days. This indicates a sharp rise in the demand for long positions among HBAR’s derivatives traders on Wednesday.
An asset’s long/short ratio measures the proportion of its long positions (bets on price increases) to short positions (bets on price declines) in the market. A ratio below one means there are more short positions than long ones.
Conversely, as in HBAR’s case, a long/short ratio reading above one indicates that traders are predominantly bullish on the altcoin, and are opening bets in favor of an extended price rally.
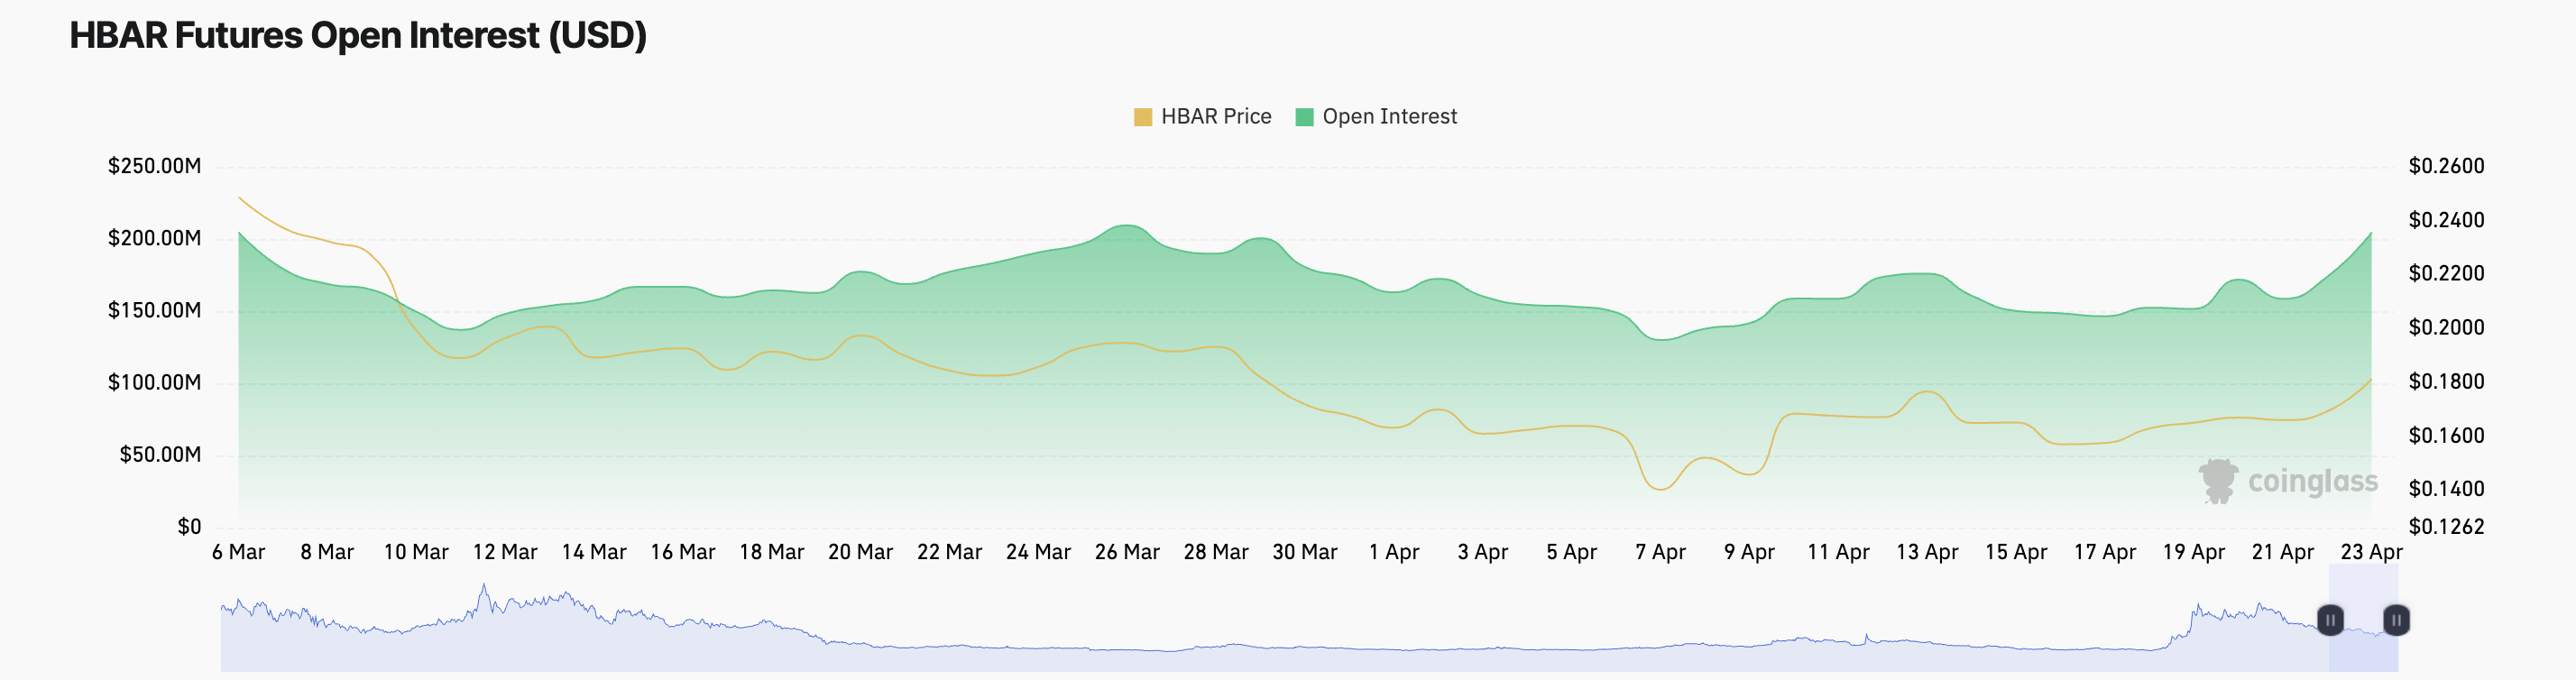
Moreover, HBAR’s rising futures open interest confirms the renewed demand for the altcoin. At press time, this is at $205 million, climbing 18% over the past day. HBAR’s value is up almost 10% within the same period.
Open interest refers to the total number of outstanding futures contracts that have not been settled. When open interest rises alongside price like this, it indicates that new money is entering the market to support the uptrend. This trend signals strong conviction behind the HBAR’s upward movement.
Can HBAR Break Out? Traders Watch $0.199 as Next Key Level
As of this writing, HBAR trades at $0.187, resting above the resistance formed at $0.190. If demand strengthens and HBAR bulls flip this price level into a support floor, the token could extend its uptrend and climb to $0.199.
On the other hand, if HBAR bears regain market control, this bullish projection will be invalidated. In this scenario, the token could lose its recent gains and fall to $0.153.
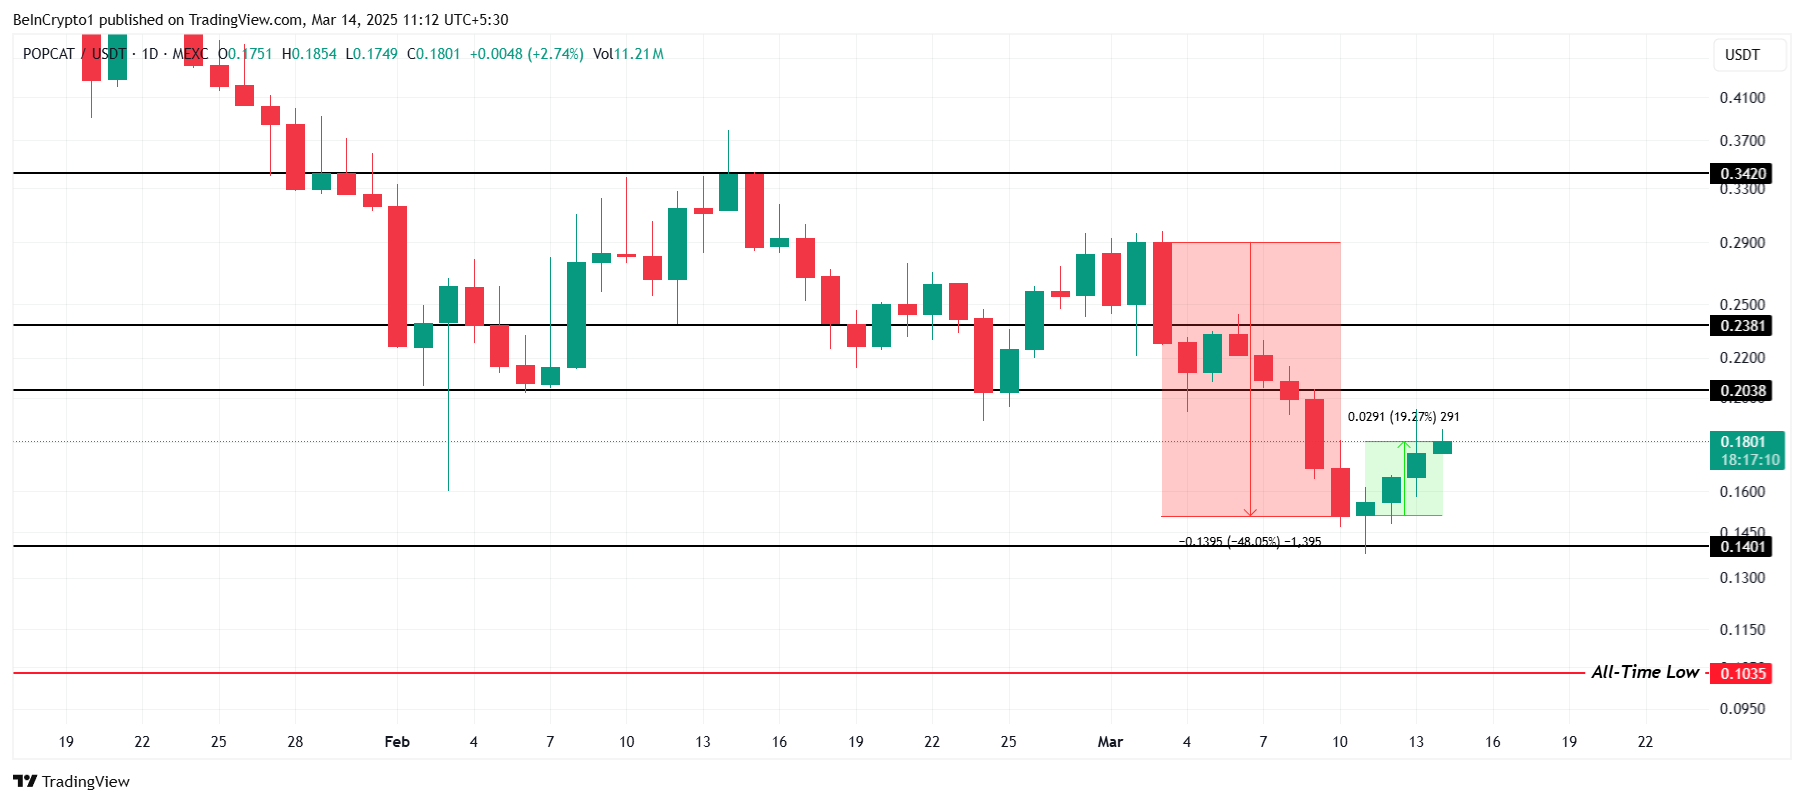
POPCAT has faced significant challenges since the beginning of February, as attempts at recovery have failed to materialize. Despite some price rallies, the meme coin has struggled to regain its losses, with a 48% drop weighing heavily on its performance.
While the altcoin is still attempting a recovery, a lack of strong support and market optimism is causing delays in any significant rebound. But the meme coin did have a key bullish moment this week.
POPCAT Needs Investors’ Backing
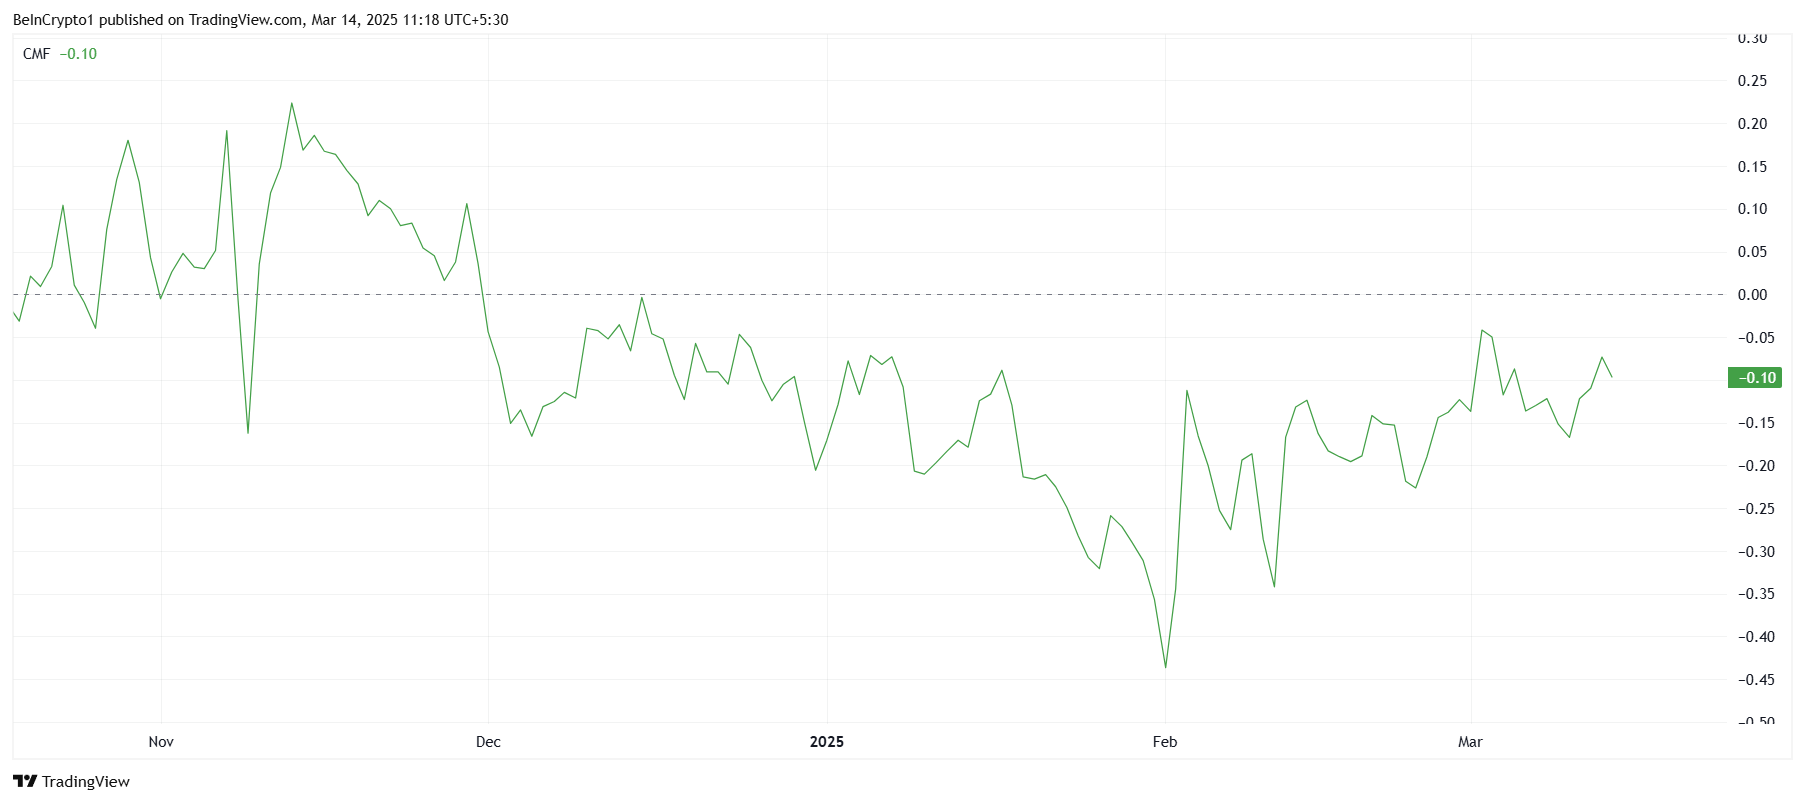
The Chaikin Money Flow (CMF) indicator has remained stuck below the zero line for the past three and a half months. This suggests that inflows into POPCAT have been weak since early December 2024, with little buying interest. The lack of conviction due to fear of losses from investors has contributed to a lack of momentum, keeping the meme coin from experiencing a recovery.
The weak CMF reading signals that investors are not pouring money into POPCAT, which is preventing a meaningful price increase. This has led to the coin’s struggle to maintain any positive price action, further delaying the recovery.
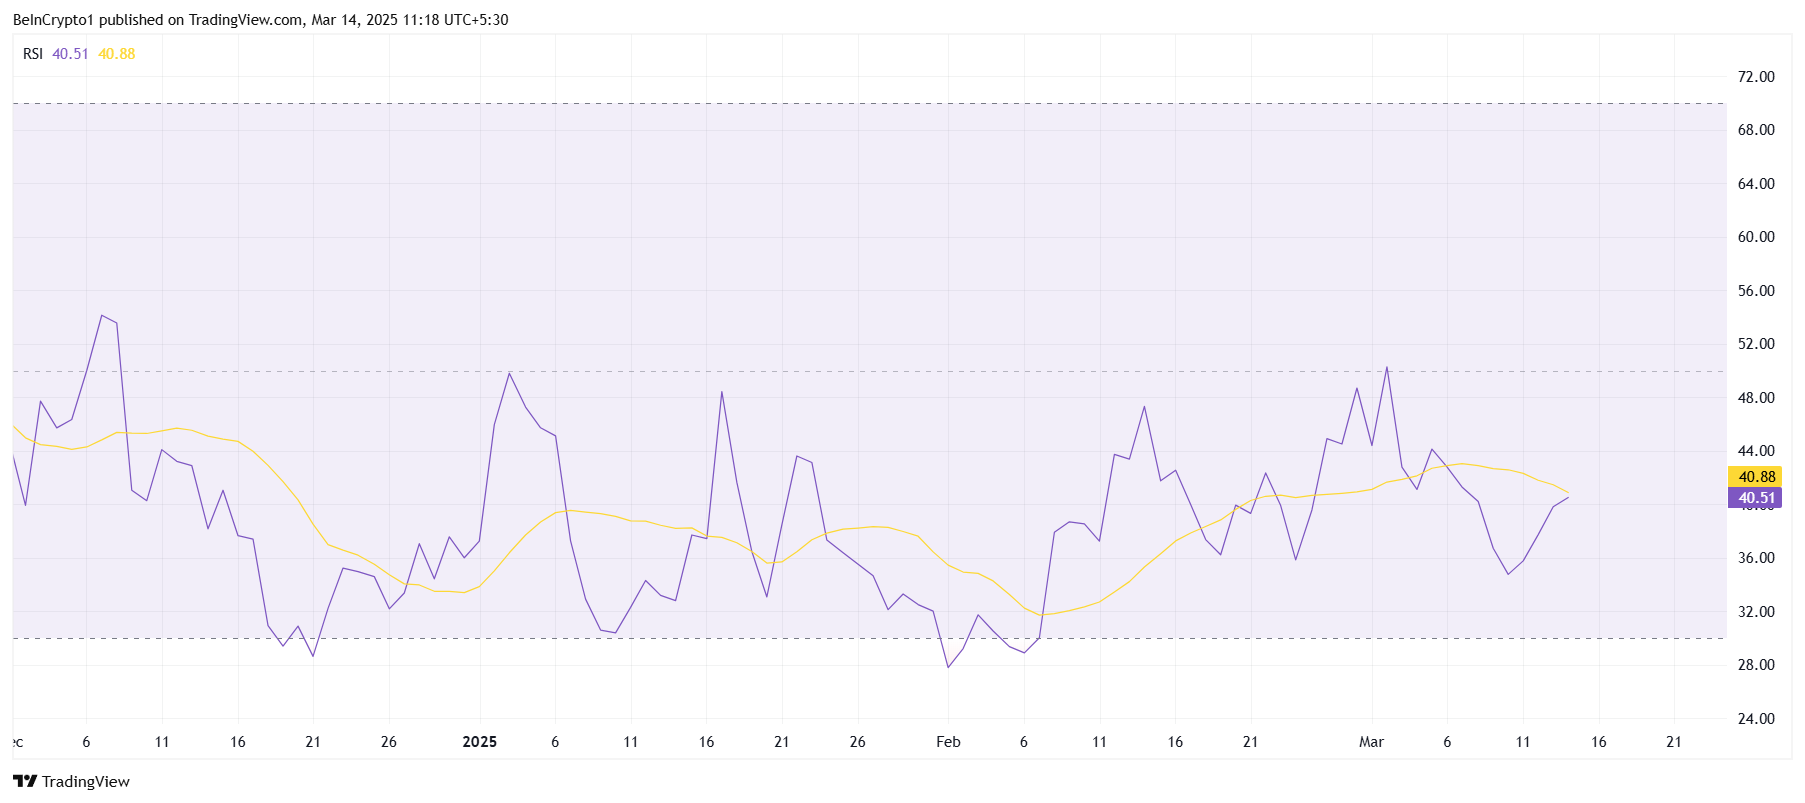
Technical indicators such as the Relative Strength Index (RSI) also reflect POPCAT’s struggle to find sustained momentum. The RSI has remained below the neutral line of 50.0 for the past three months, indicating weak bullish signals. This reinforces the notion that broader market cues are not supporting a strong recovery for the meme coin.
Without support from the broader market, POPCAT has found it difficult to break out of its current downtrend. Until the market improves, POPCAT is unlikely to break its bearish cycle.
Over the last four days, POPCAT has rallied nearly 20%, currently trading at $0.180. A key catalyst was Robinhood’s POPCAT listing on Thursday, which is expected to drive more investment into the asset and expose it to more investors.
The altcoin has bounced off the support level of $0.140 and is now under the resistance of $0.203. While this recent recovery is encouraging, it will face significant challenges in breaching the $0.203 barrier.
Given the weak market conditions and investor sentiment, POPCAT could struggle to break through the $0.203 resistance. It is more likely that the altcoin will consolidate within the range of $0.140 to $0.203, at least until stronger market cues emerge. This could delay any potential recovery further.
However, if market conditions and investor behavior improve, POPCAT may push past the $0.203 resistance. A successful breach of this level could see the altcoin test $0.238, invalidating the current bearish outlook. This would signal a shift in market sentiment and possibly set the stage for a more sustained recovery.
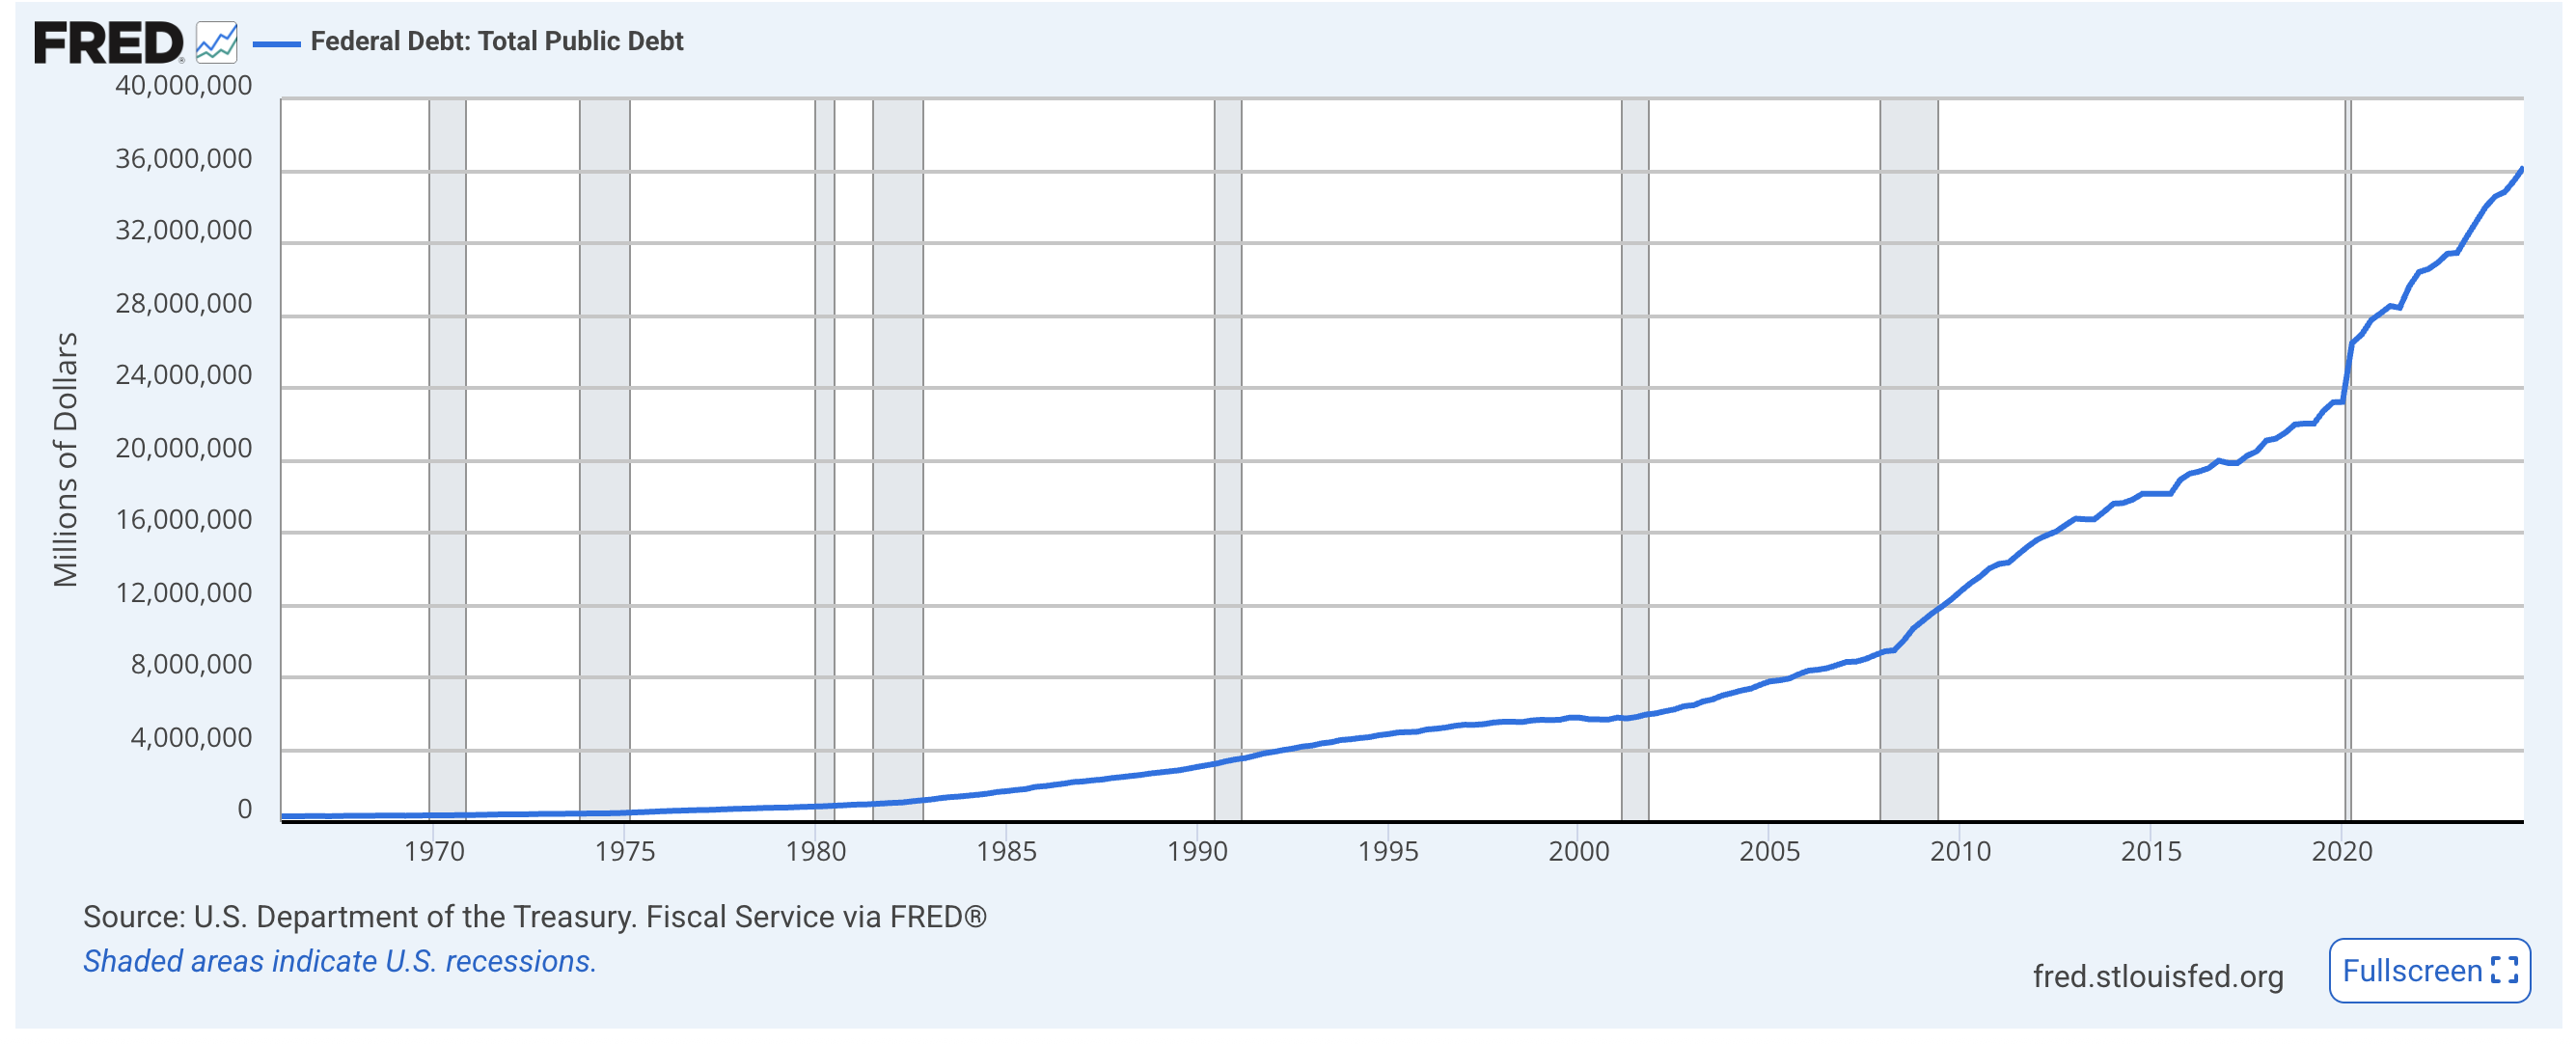
Bitcoin (BTC) is facing a mix of bullish signals and short-term uncertainty. Moody’s recent downgrade of the US credit rating has heightened long-term bullish sentiment around BTC, reinforcing its role as a hedge against rising debt and fiscal uncertainty.
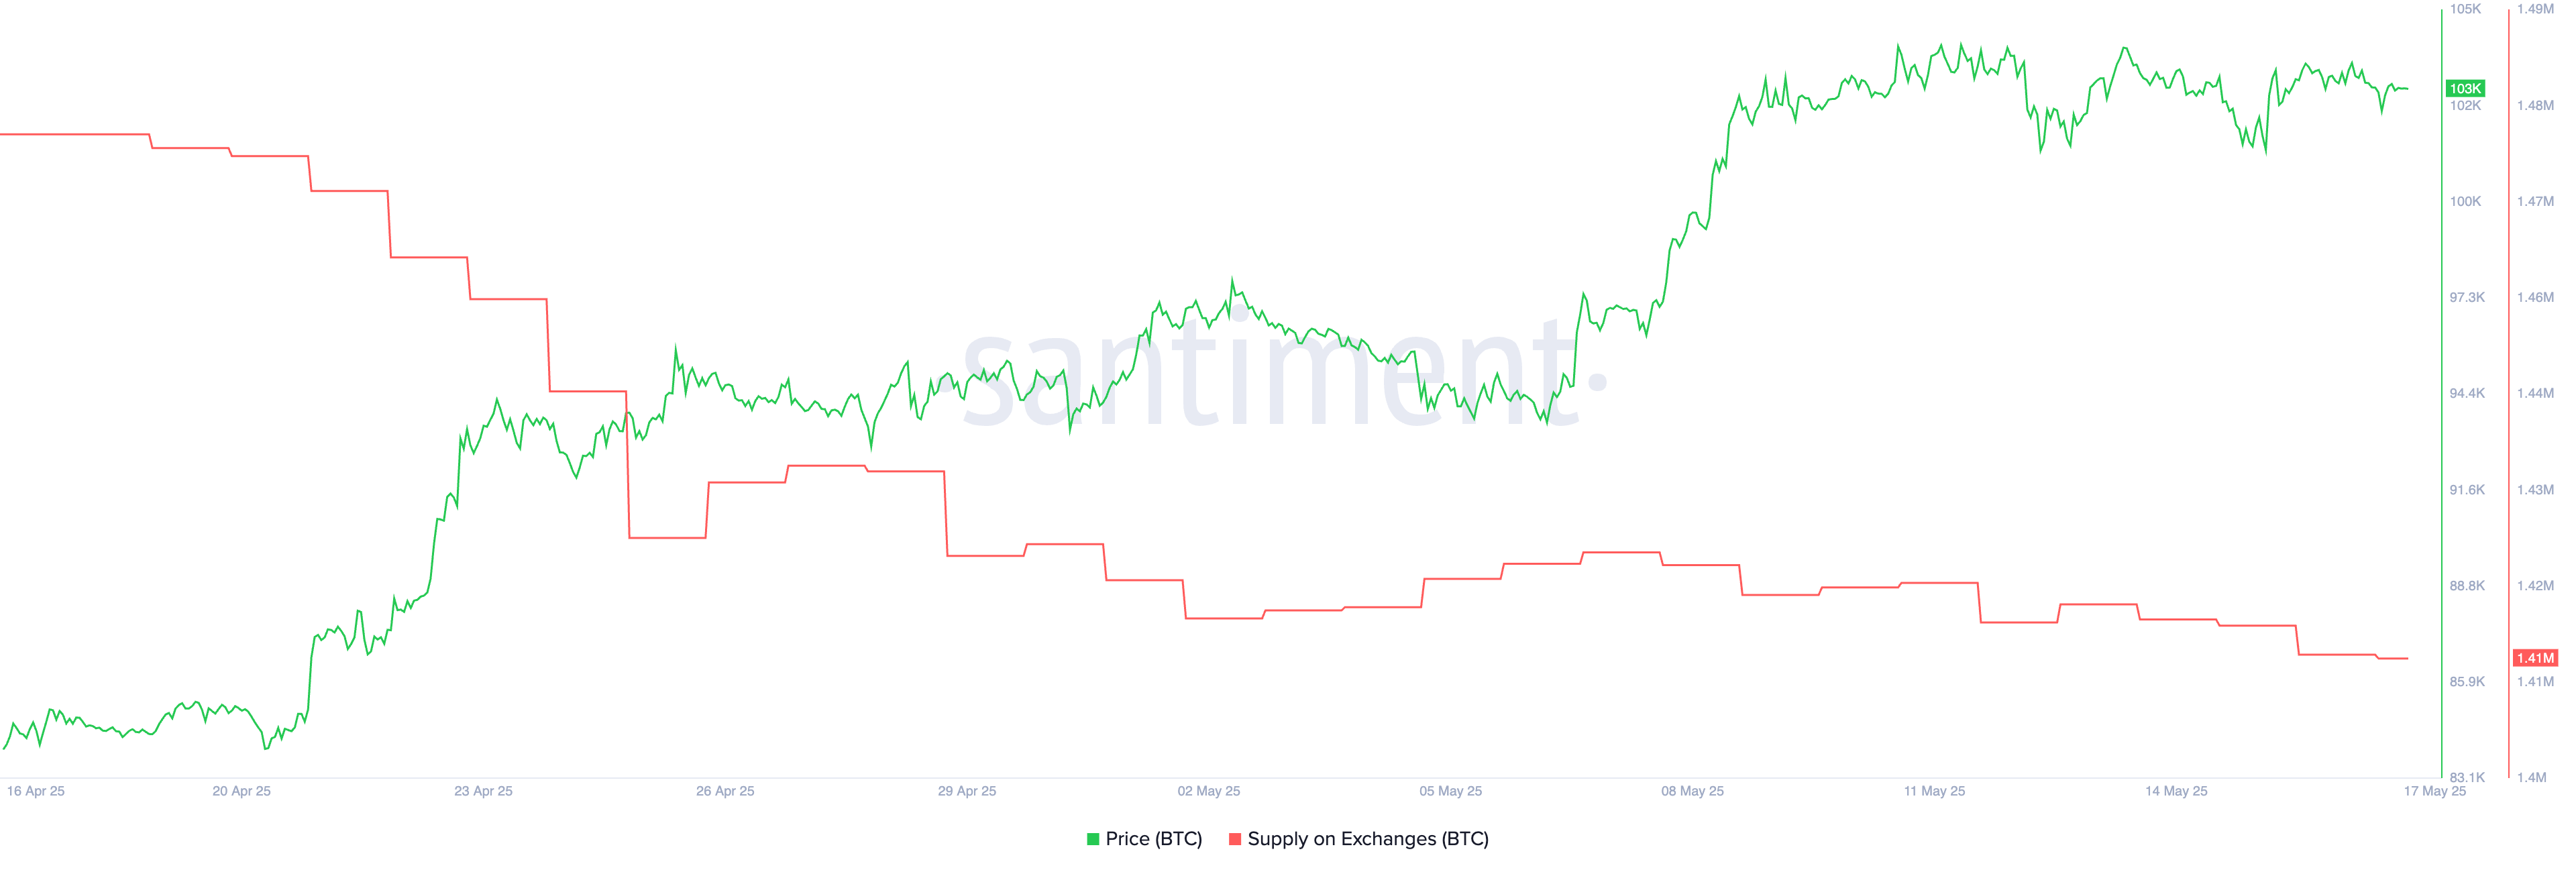
Meanwhile, on-chain data shows a declining supply of Bitcoin on exchanges, suggesting investors are leaning toward holding rather than selling. Despite these bullish fundamentals, BTC remains in a short-term consolidation phase, with price action needing fresh momentum to break higher.
Moody’s Downgrade Ends US Century-Long Perfect Credit Rating Streak
Moody’s has downgraded the US credit rating from Aaa to Aa1, removing the country’s last perfect score among major credit agencies.
It’s the first time in over a century that the US lacks a top-tier rating from all three, following downgrades by S&P in 2011 and Fitch in 2023. Rising deficits, mounting interest costs, and the absence of credible fiscal reforms drove the decision.
Markets reacted quickly—Treasury yields climbed, and equity futures slipped. The White House dismissed the downgrade as politically driven, with lawmakers still negotiating a $3.8 trillion tax and spending package.
Moody’s also warned that extending Trump-era tax cuts could deepen deficits, pushing them toward 9% of GDP by 2035—a scenario that may strengthen the appeal of crypto, especially Bitcoin, as a hedge against long-term fiscal instability.
After briefly rising from 1.42 million to 1.43 million between May 2 and May 7, Bitcoin’s supply on exchanges is falling once again.
This short uptick followed a more significant decline between April 17 and May 2, when the exchange supply dropped from 1.47 million to 1.42 million. Now, the metric has resumed its downward trend, currently sitting at 1.41 million BTC.
The supply of Bitcoin on exchanges is a key market indicator. When more BTC is held on exchanges, it often signals potential selling pressure, which can be bearish.
Conversely, a decline in exchange balances suggests holders are moving their coins to cold storage, reducing near-term sell pressure—a bullish signal. The current drop reinforces the idea that investors may be preparing to hold rather than sell.
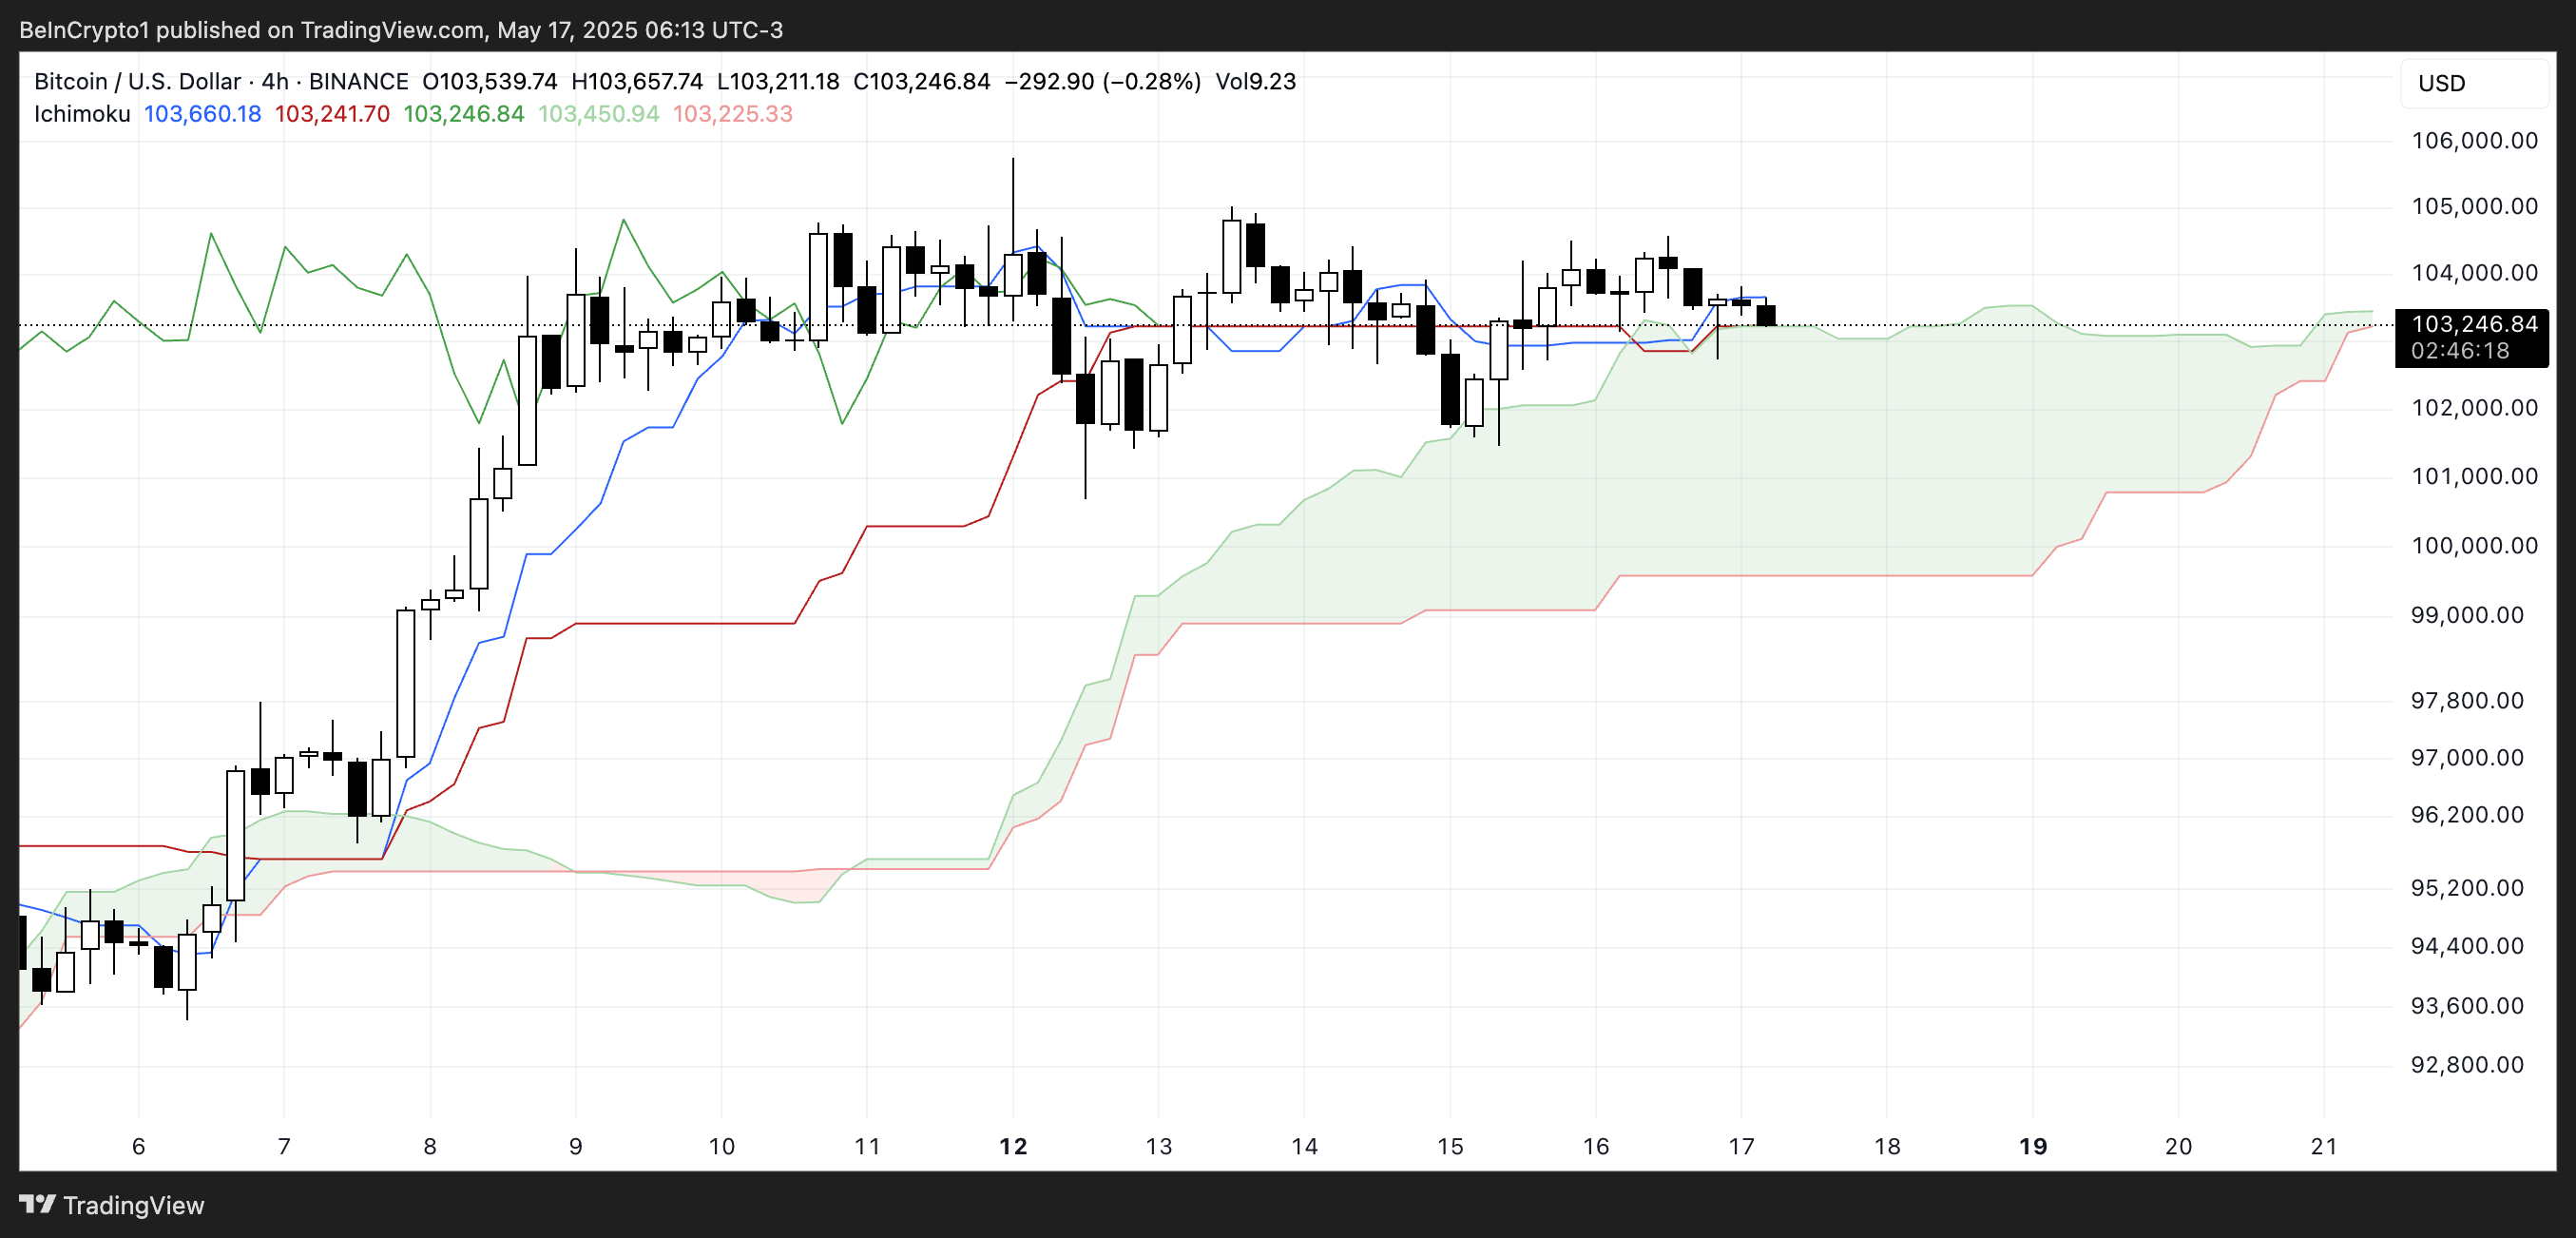
The Ichimoku Cloud chart for Bitcoin shows a period of consolidation with neutral-to-slightly-bearish signals. The price is currently sitting right around the flat Kijun-sen (red line), indicating a lack of strong momentum in either direction.
The Tenkan-sen (blue line) is also flat and closely tracking the price, reinforcing this sideways movement and short-term indecision.
The Senkou Span A and B lines (which form the green cloud) are also relatively flat, suggesting equilibrium in the market. The price is moving near the top edge of the cloud, which typically acts as support. However, since the cloud is not expanding and has a flat structure, there is no strong trend confirmation at the moment.
The Chikou Span (green lagging line) is slightly above the price candles, hinting at mild bullish bias, but overall, the chart signals indecision and the need for a breakout to confirm the next direction.
Moody’s Downgrade Strengthens Bitcoin’s Long-Term Bull Case Amid Short-Term Consolidation
While it may not trigger immediate price action, the downgrade reinforces the narrative of growing fiscal instability and debt concerns—conditions that strengthen Bitcoin’s appeal as a decentralized, hard-capped asset.
In the medium to long term, more investors may turn to BTC as a hedge against sovereign risk and weakening trust in traditional financial systems.
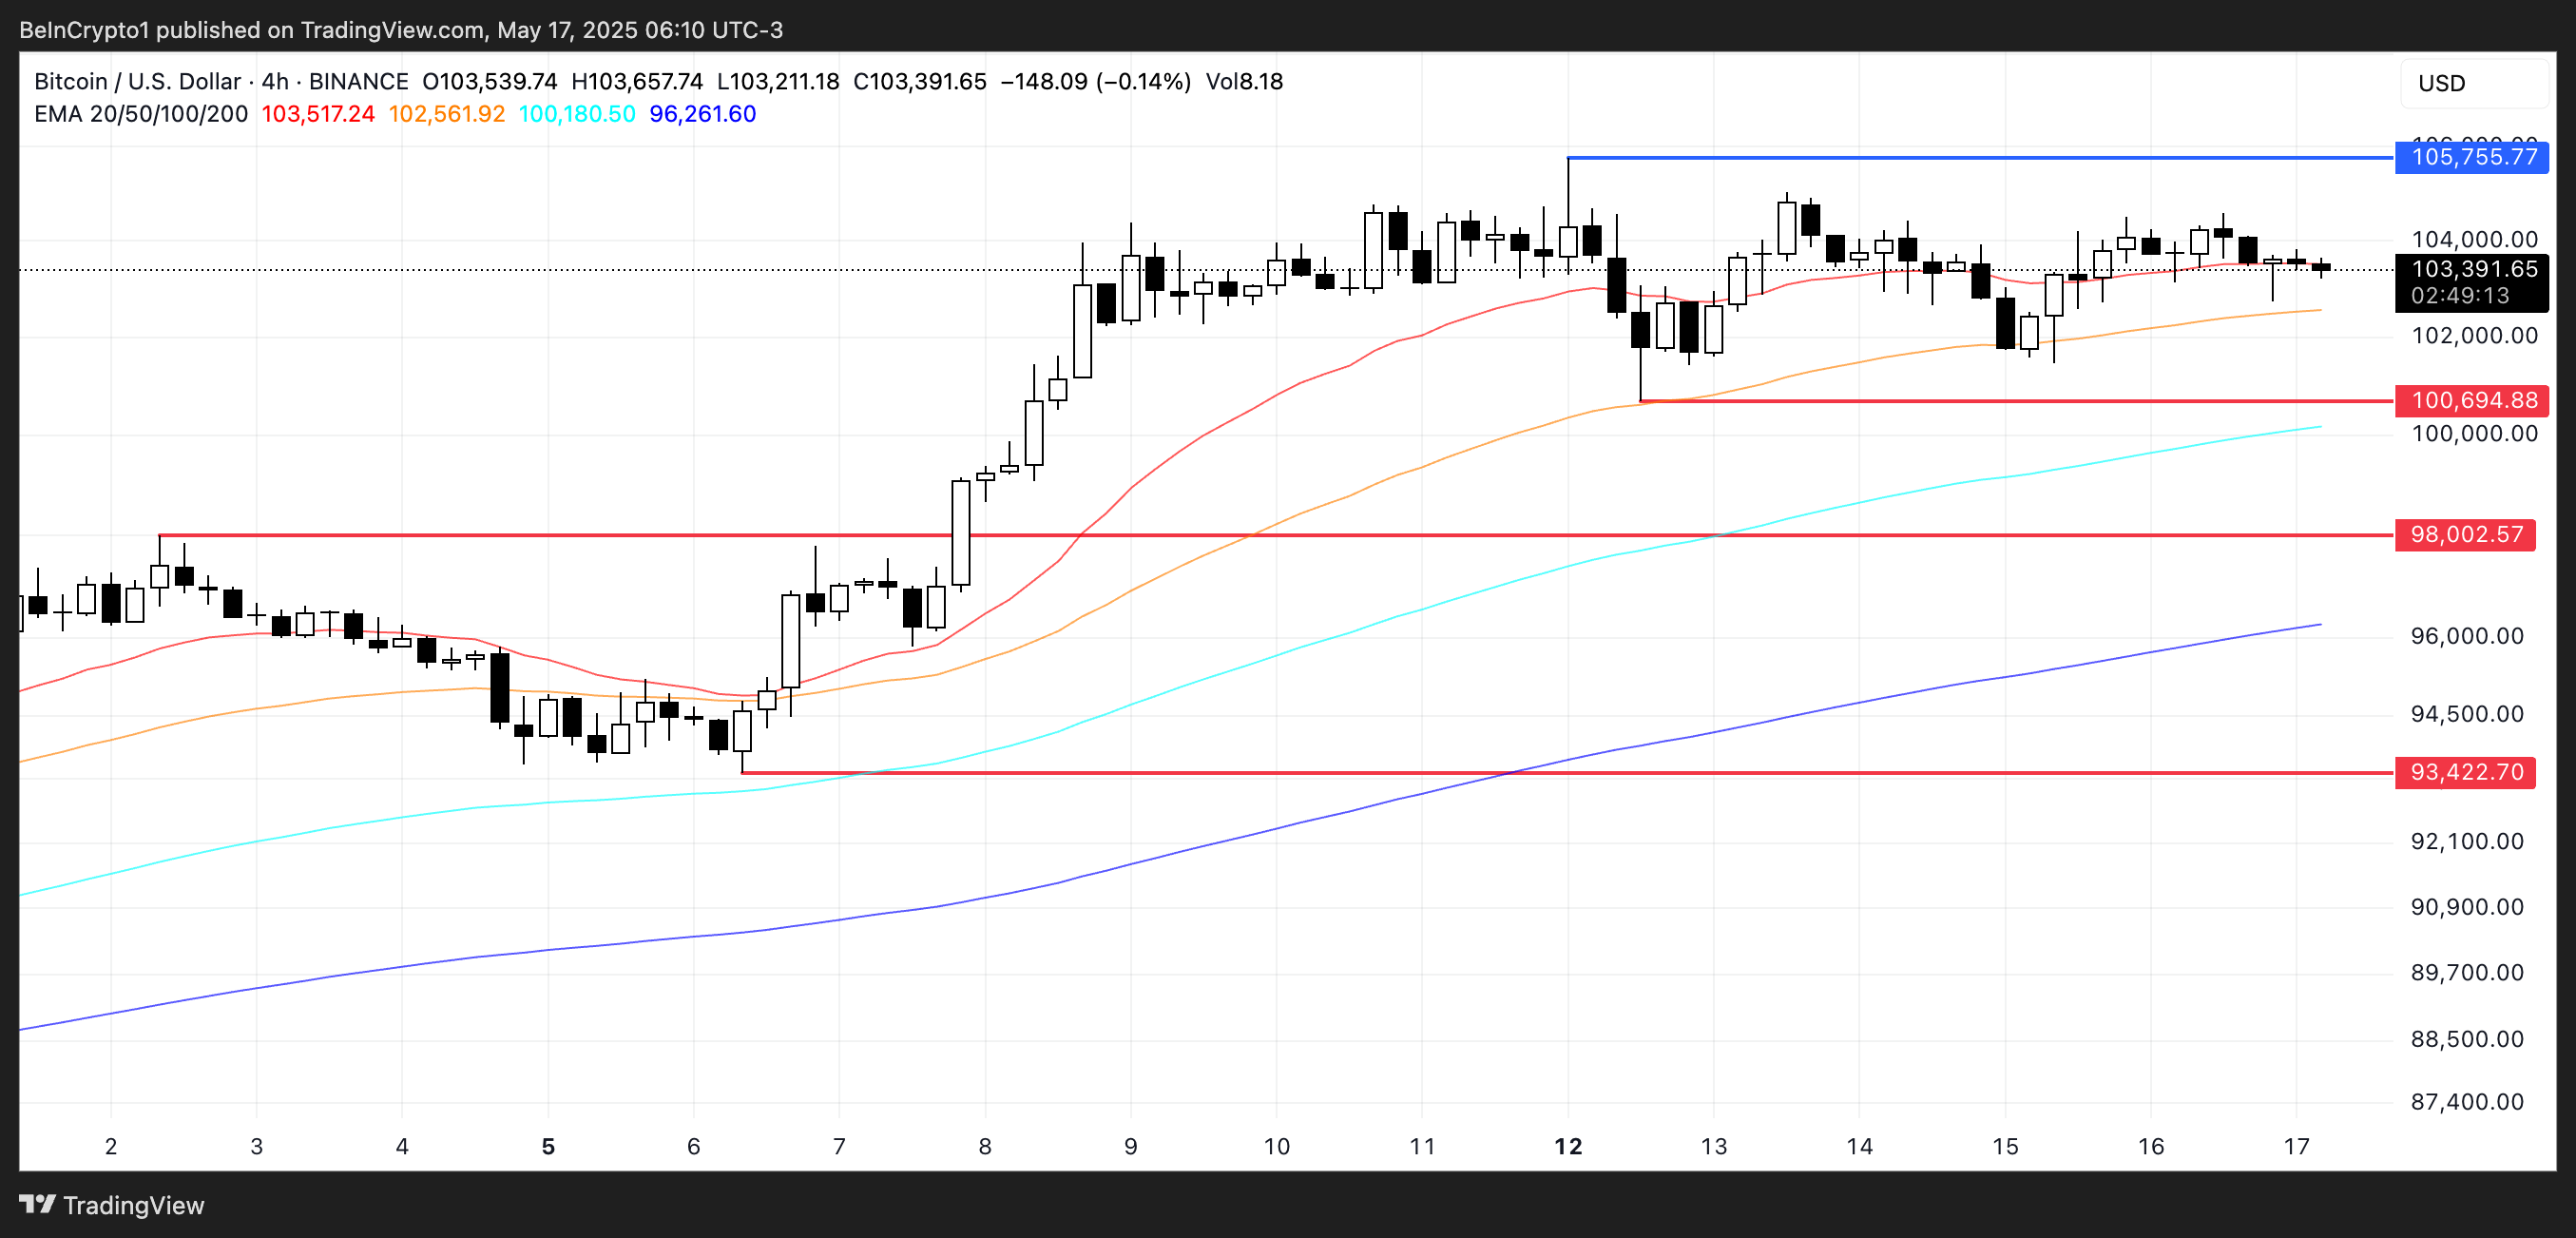
In the short term, however, Bitcoin price remains in a consolidation phase after breaking above $100,000. Its EMA lines are still bullish, with shorter-term averages above longer-term ones, but they are flattening out.
For bullish momentum to resume, BTC would need to push past the $105,755 resistance.
On the downside, holding above the $100,694 support is crucial—losing it could open the door for declines toward $98,002 and potentially $93,422.