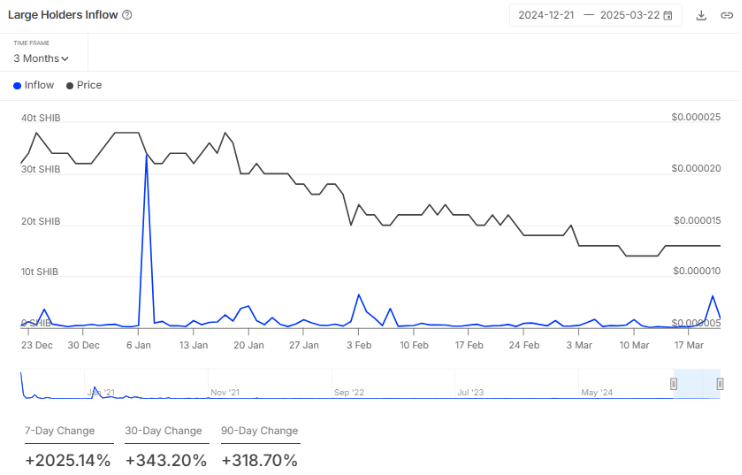
In the current market uncertainty, whale interest appears to have shifted to CAKE, the native token of PancakeSwap. Recently, data from the on-chain analytics firm Santiment reported that PancakeSwap leads all assets in whale activity, having skyrocketed over the past week.
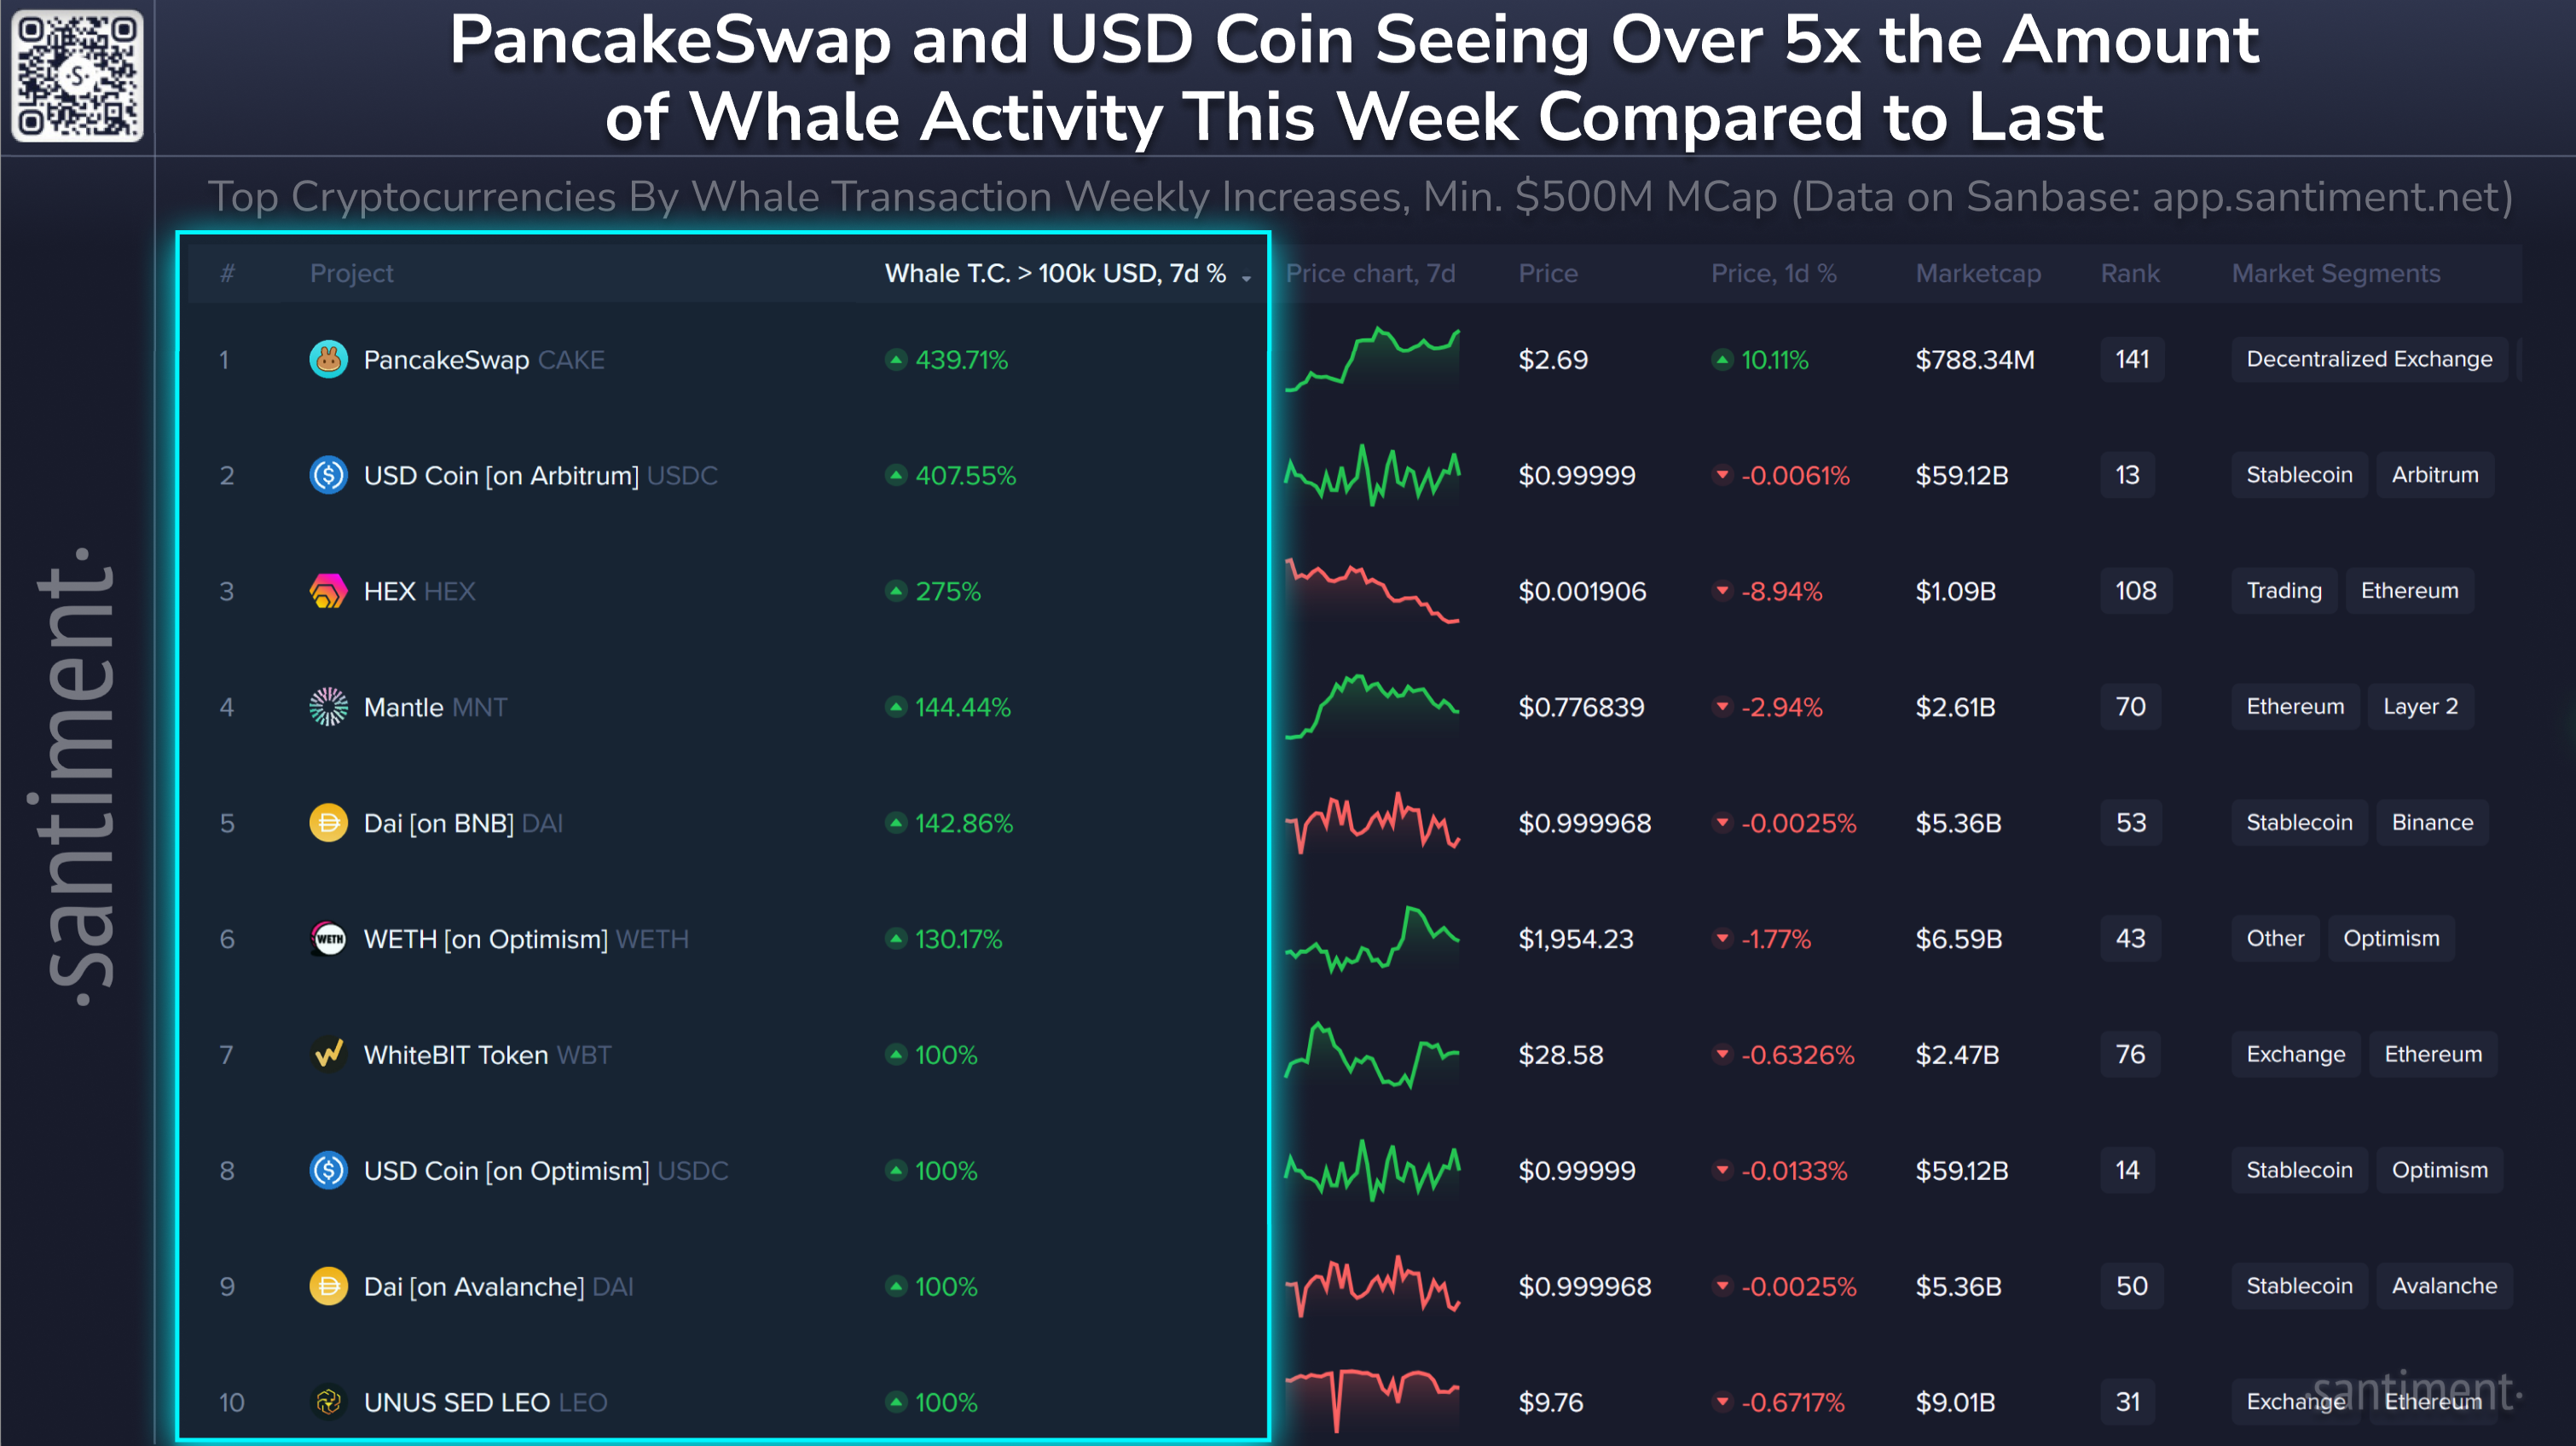
Whale Activity in CAKE Surges 440%
The report revealed that the percentage change in transactions made by whale wallets holding over $100,000 worth of CAKE increased by 439.71% over the past week, followed by HEX and Mantle (MNT), which recorded jumps of 275% and 144.44%, respectively, during the same period.
Source: Santiment
However, this massive whale activity might be the reason behind CAKE’s 56% upside momentum in the past week, while major assets like Bitcoin (BTC), Ethereum (ETH), and XRP struggled to gain traction. Besides this strong rally, CAKE appears to be following a similar pattern.
Current Price Momentum
On March 22, 2025, the asset surged over 4.5% in the past 24 hours and is currently trading near $2.70. During the same period, its trading volume increased by 15%, indicating higher participation from investors and traders compared to the previous day.
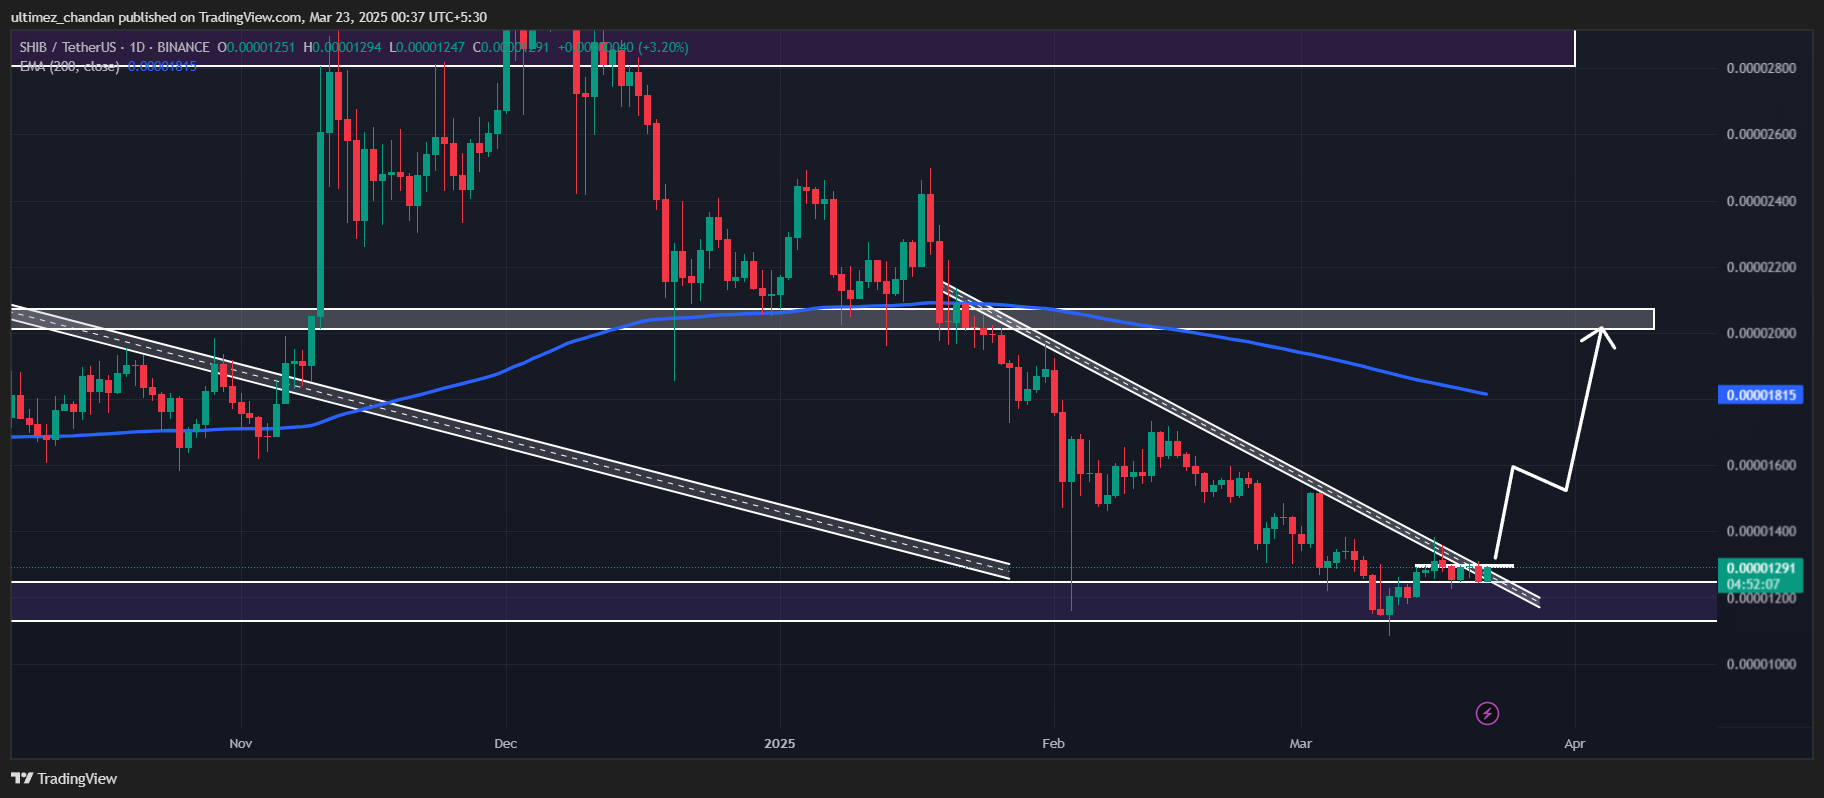
With the massive price surge in recent days, CAKE has reached a crucial resistance level with a strong history of price reversals. In other words, this level has previously acted as a significant selling pressure zone.
Pancakeswap (CAKE) Technical Analysis and Upcoming Levels
According to expert technical analysis, CAKE has reached a strong resistance level at $3 and has been consolidating near this level for the past three days. Based on recent price action and historical momentum, if CAKE breaches this resistance and closes a daily candle above $3.05, there is a strong possibility that the asset could soar by 45% to reach $4.30 in the coming days.
Source: Trading View
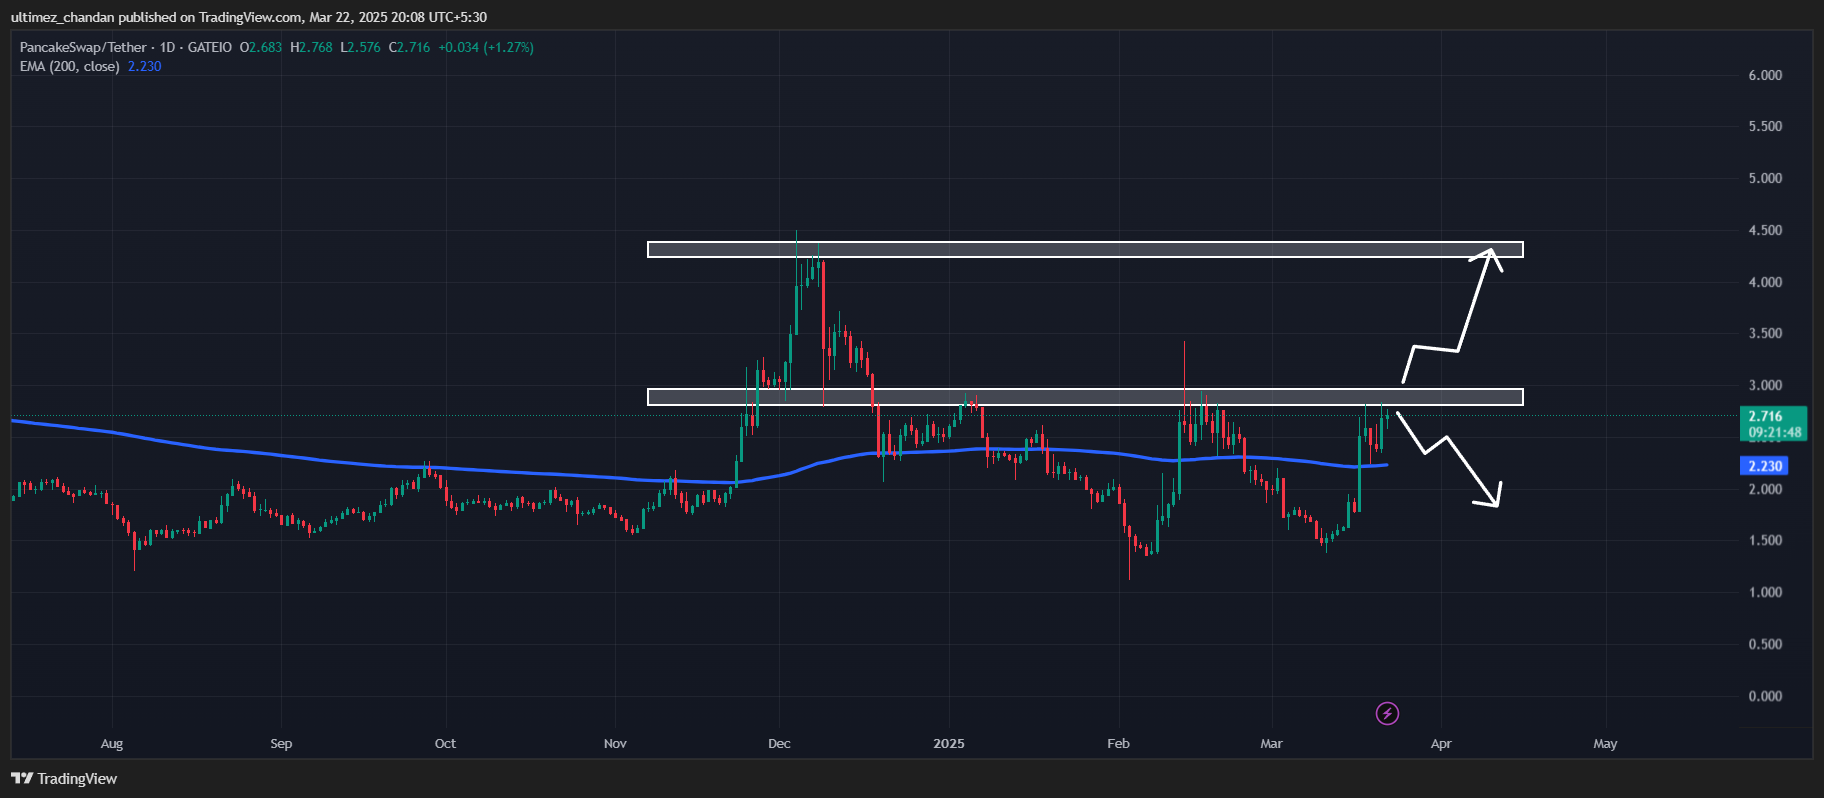
On the other hand, if it fails to break the resistance, the asset could repeat its historical pattern and experience a price decline. Additionally, CAKE is now trading above the 200 Exponential Moving Average (EMA) on the daily timeframe, indicating that the asset is in an uptrend.
Ethereum price dived below $2,000 on March 9, mirroring the broader market downtrend. Institutional investors are offloading ETH, increasing downside risks.
Ethereum Price Dives Below $2,000 as US NFP Tilts Markets Bearish
Ethereum (ETH) experienced significant losses over the weekend as the highly anticipated White House Summit failed to lift market sentiment. Instead, the latest US Non-Farm Payroll (NFP) report dominated investor outlook, highlighting rising unemployment and increasing inflation pressures.
As a result, ETH price tumbled below the psychological $2,000 level, trading as low as $1,998 on Binance on March 9, marking an 8% daily decline. The drop exceeded Bitcoin’s 4% losses within the same timeframe, signaling stronger bearish momentum within ETH spot markets.
Ethereum Price Action
The selling pressure has been exacerbated by mounting fears of further Federal Reserve tightening in response to rising inflation metrics. With investors now eyeing the next Consumer Price Index (CPI) report, ETH price could struggle to gain meaningful traction unless macroeconomic conditions shift favorably.
BlackRock ETF Led Outflows with $11 Million Sell-off After US NFP Data
Amid rising unemployment and inflation triggers, institutional investors are reallocating capital away from crypto markets toward fixed-income securities, driving bond yields higher across global markets. This shift in investor sentiment has translated into substantial outflows from Ethereum ETFs.
According to on-chain analytics provider SosoValue, Ethereum ETFs recorded $23 million in outflows on Friday, the same day the US NFP report was released. Among the largest liquidations, BlackRock’s iShares Ethereum ETF saw an $11 million capital flight, the highest single-day outflow among Ethereum-focused funds.
The rapid outflows in Ethereum ETFs suggest that institutional investors are repositioning their portfolios in anticipation of further downside in crypto markets. If Ethereum ETF outflows continue into the coming week, ETH price could struggle to mount a sustained recovery.
Ethereum price forecast signals have taken a decisive bearish turn, with ETH plunging 8.3% on March 9 to test support near $2,000. The daily chart reveals a concerning technical setup, as ETH struggles below key moving averages, with a confirmed Death Cross between short-term EMAs signaling prolonged downside risks.
If Ethereum closes below the critical $2,000 level, selling pressure could accelerate, targeting the next major support at $1,850, where historical demand has previously stabilized declines.
Ethereum Price Forecast | ETHUSD
The Bollinger Bands show ETH trading at the lower band, suggesting it is in oversold territory. However, the absence of a significant bullish reaction underscores weak buying momentum. The MACD histogram remains in deep negative territory, with its signal line widening against the MACD line—affirming that bearish momentum is strengthening rather than reversing. While a relief bounce cannot be ruled out, any recovery toward $2,250 or $2,433 would likely face intense resistance as sidelined sellers look to re-enter.
The heightened leverage in derivatives markets could amplify price swings. If ETH loses $2,000 decisively, long liquidations may accelerate a cascade effect, making $1,850 the next crucial test for bulls. Conversely, a close above $2,200 could shift sentiment toward a bullish retracement.
Ethereum Price Outlook: Key Levels to Watch This Week
For Ethereum to break its bearish grip, ETF inflows must show signs of stabilization, particularly from major asset managers like BlackRock. If institutional demand returns, ETH could attempt to reclaim the $2,100 level and challenge the $2,250 resistance zone.
On the flip side, if macroeconomic headwinds persist and ETF outflows accelerate, Ethereum risks dropping below $1,950, potentially testing lower support at $1,850. With US CPI data and Federal Reserve commentary on the horizon, traders should remain cautious, as Ethereum’s price action could see heightened volatility in response to broader market shifts.
Overall, Ethereum remains vulnerable to further downside unless it reclaims key resistance levels and sees a resurgence in institutional demand.
A total of 22,000 Bitcoin options contracts will expire today with overall market activity remaining subdued as BTC price oscillates in a tight range between $82,000-$84,000. Amid tightening volatilities, traders have been ramping up selling activity recently. Analysts are predicting a BTC move either to $44,000 or to $112,000 based on macro conditions and other factors. another positive indicator is that Bitcoin ETF inflows have resumed once again with BlackRock’s IBIT leading the show.
22,000 Bitcoin Options to Expire Amid Flat Market Conditions
A total of 22,000 Bitcoin (BTC) options, with a Put/Call ratio of 0.84, are set to expire, carrying a notional value of $1.83 billion and a max pain point of $85,000, as per the data from Deribit.
Source: Deribit
Over the last week, the crypto market saw subdued market activity with the total number of option deliveries dropping by nearly 50%. Furthermore, short-term implied volatility (IV) saw a sharp decline, falling below 50% across the board for BTC, ahead of today’s Bitcoin options expiry.
Data shows that institutional options market makers are ramping up selling activity while tightening implied volatilities. This signals the expectations of a short-term sideways movement for Bitcoin ahead.
Where’s BTC Price Heading Next?
BTC price has struggled to break past the $84,000 resistance despite the recent initial thrust after the FOMC meeting. This shows that bulls have not mustered enough strength for a rally ahead. As the impact of the Trump tariff war on the US equity market intensifies, President Donald Trump has asked the US Federal Reserve to announce rate cuts soon.
Crypto market veterans like Arthur Hayes expect the Fed rate cuts to come by April which could push the Bitcoin price even higher. Crypto analyst Ali Martinez has outlined pivotal support and resistance levels for Bitcoin (BTC) using pricing bands. He noted:
A break and hold above $94,000 could propel Bitcoin toward a surge to $112,000.
Conversely, a drop below $76,000 would place the next critical support levels at $58,000 and $44,000.
Source: Ali Martinez
BTC’s daily trading volume has dropped by 31% to $25 billion ahead of today’s Bitcoin options expiry. It will be interesting to see whether BTC resumes the uptrend in the near time.
Bitcoin ETF Inflows Resume Again
US Bitcoin ETFs have recorded five consecutive sessions of inflows. On Thursday, March 20, Bitcoin spot ETFs recorded a total net inflow of $166 million, signaling growing investor interest in the market. BlackRock’s IBIT led the surge, achieving the highest single-day net inflow among Bitcoin spot ETFs at $172 million, as per data from Farside Investors.