Nasdaq-listed Bit Digital is the latest company to adopt the Ethereum standard, offloading all its Bitcoin holdings for the largest altcoin. The move has sent Bit Digital’s stock rallying by nearly 20% in a day as the company eyes becoming the largest Ethereum Treasury player Bit Digital Abandons Bitcoin For Ethereum Treasury According to a
A wave of renewed optimism in the broader crypto market has reignited interest in meme coins, with trading volume in the sector jumping 60% in the past 24 hours.
Leading the charge is Pudgy Penguins (PENGU), which has soared 17% today, making it the top-performing crypto asset in the market.
PENGU Breaks Out of Slump as Bulls Return
PENGU’s price has struggled to gain meaningful traction recently. Its lackluster performance dampened investor sentiment and triggered a spike in short positions. Even during moments of intraday recovery, traders remained largely unconvinced, holding back from placing bullish bets.
However, the tide now appears to be turning, as renewed buying pressure and improved technical indicators suggest that the bulls are finally regaining control.
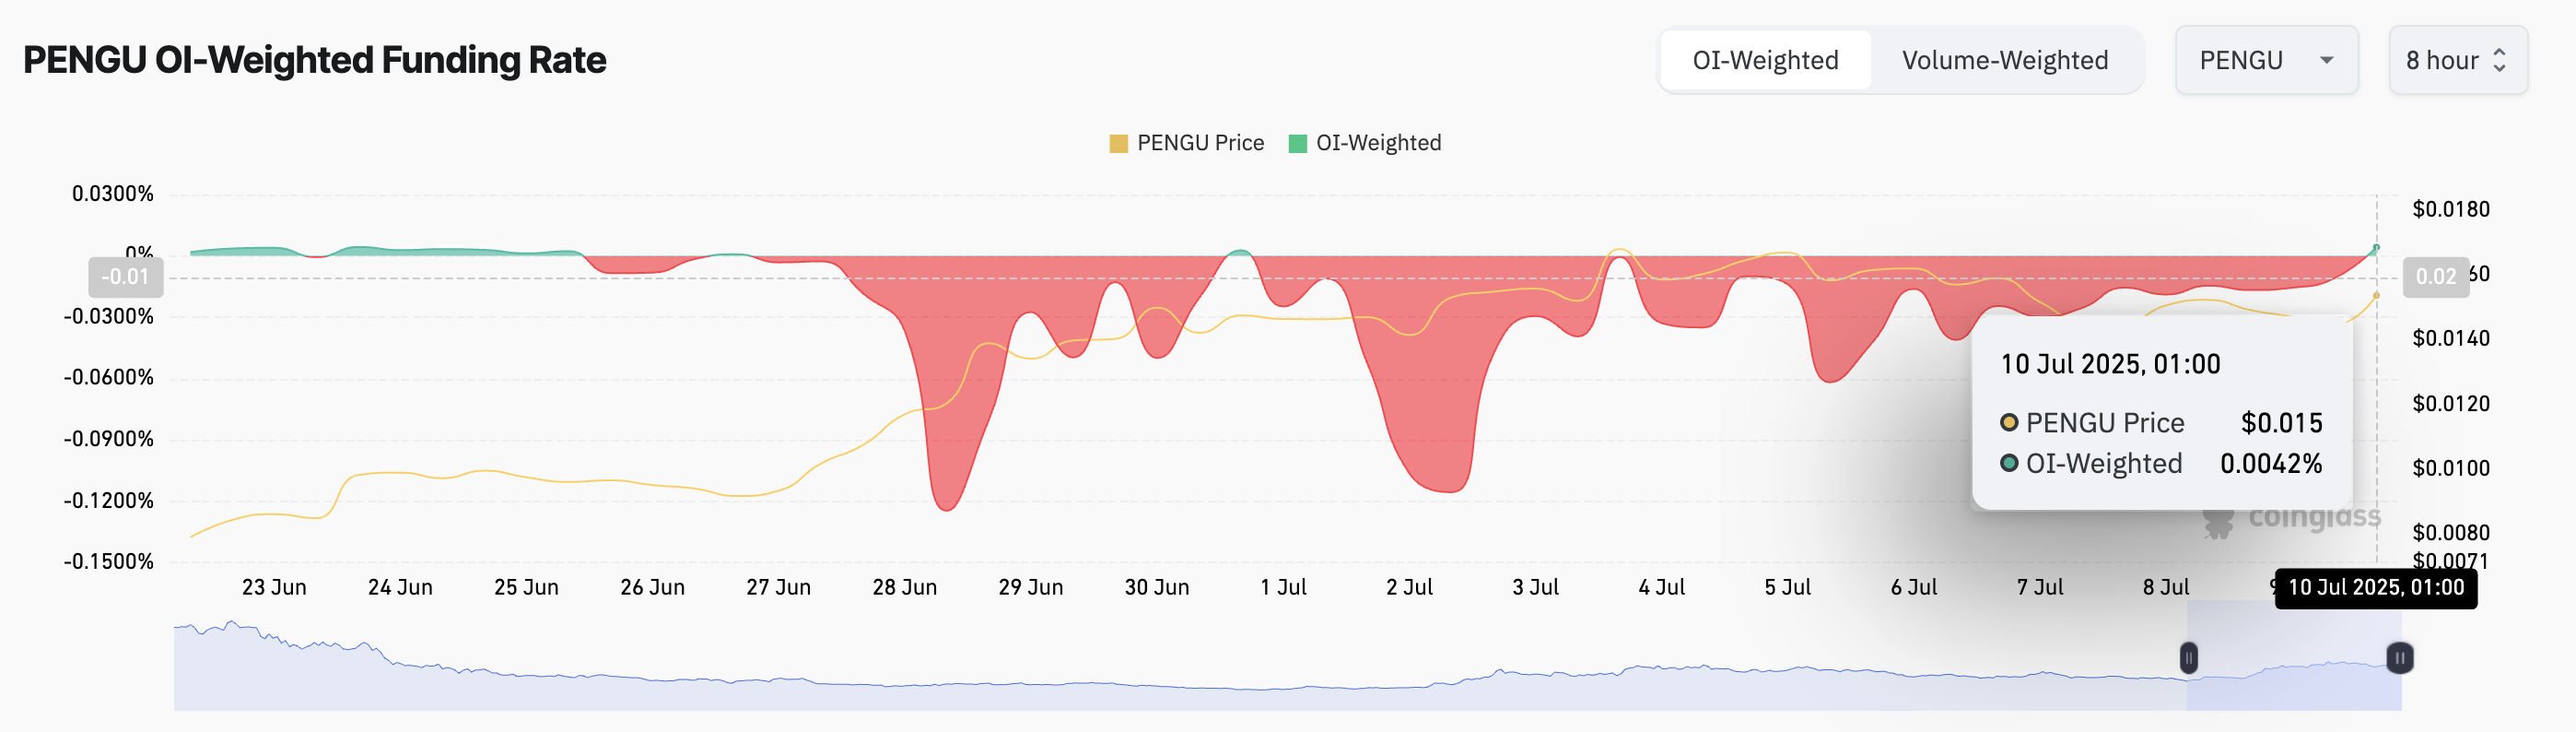
PENGU’s funding rate has flipped positive for the first time since the beginning of July, suggesting that traders are now increasingly placing long bets. As of this writing, this stands at 0.0042%.
The funding rate is a periodic payment exchanged between long and short traders in perpetual futures contracts to keep prices aligned with the spot market. When positive, long traders pay shorts, indicating bullish sentiment and higher demand for leveraged long positions.
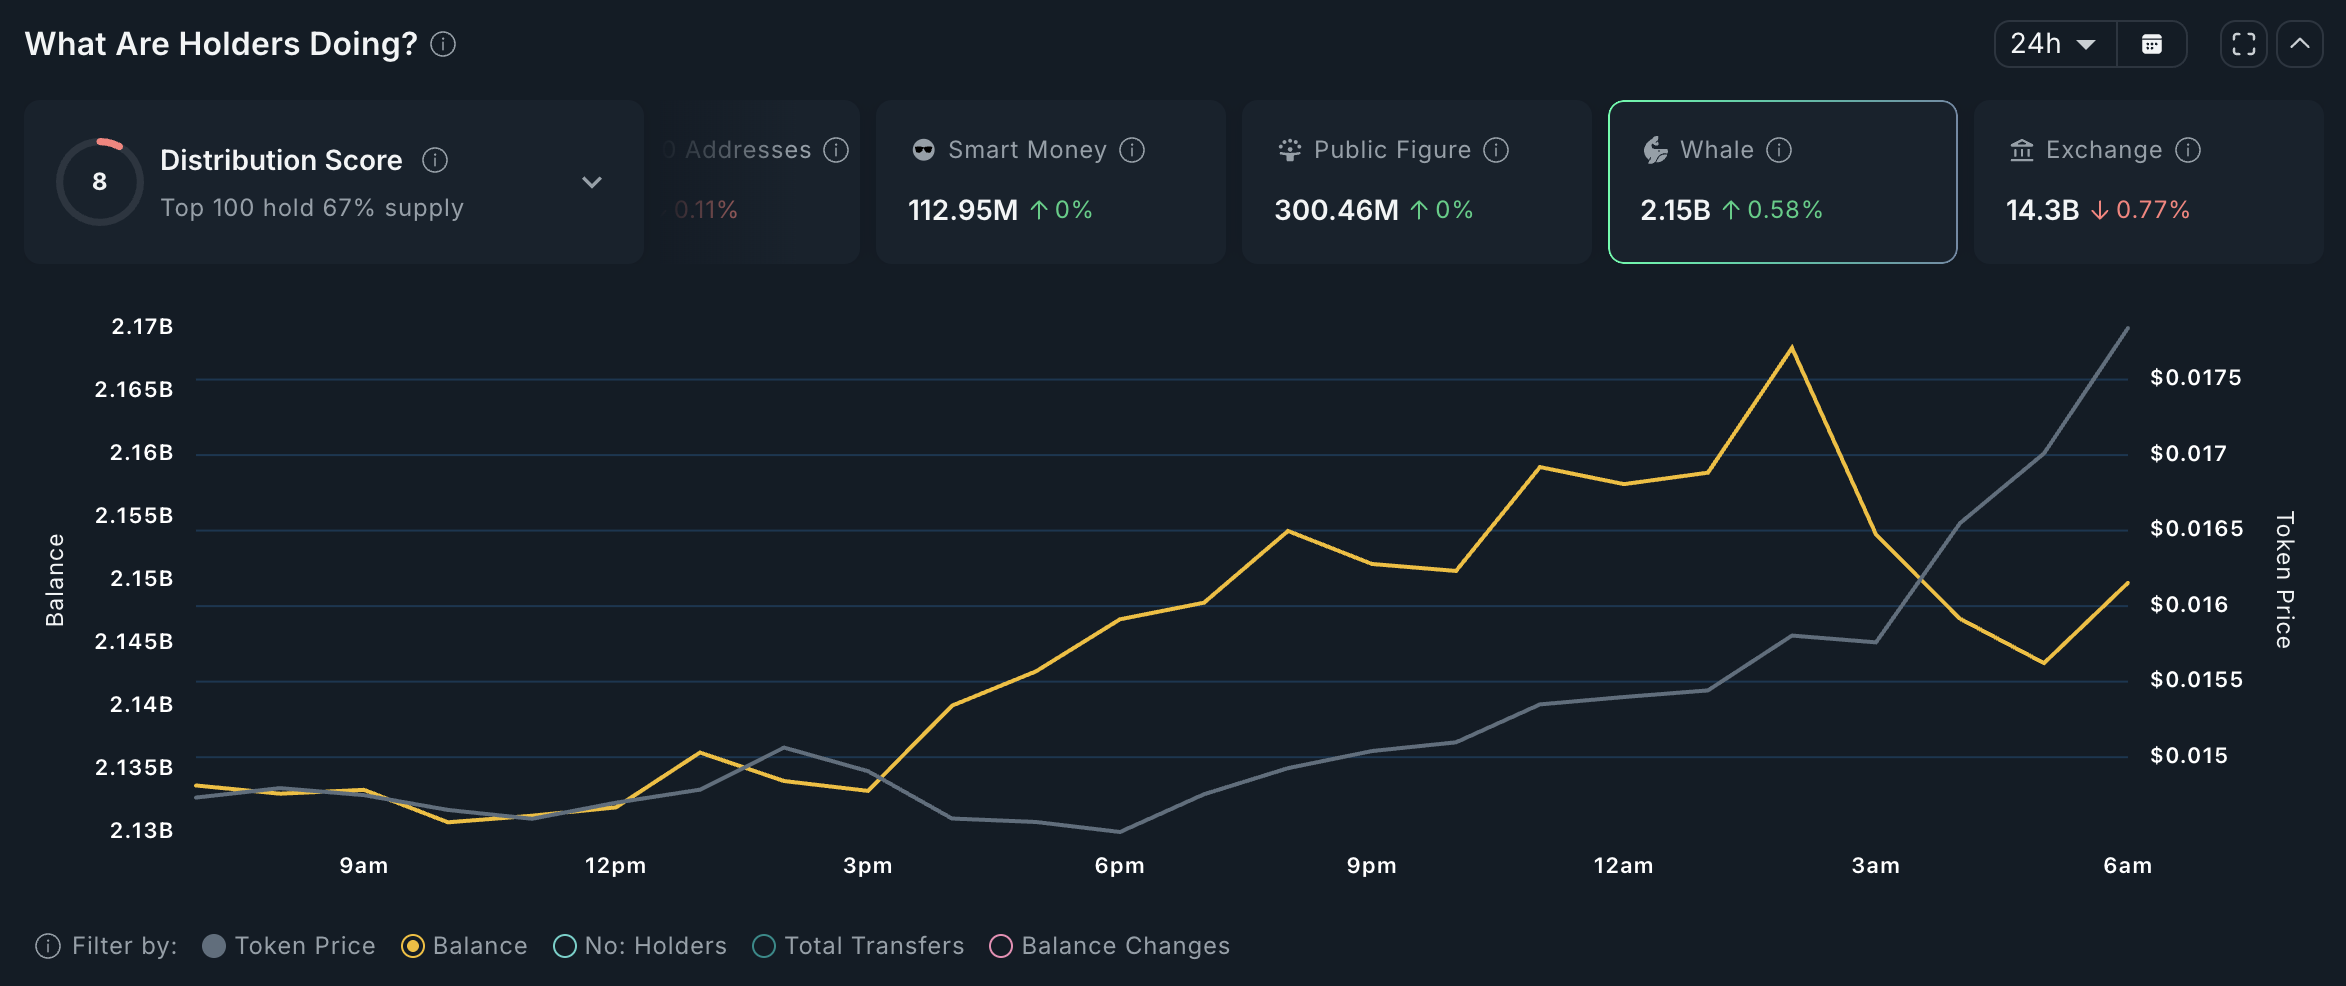
Amid this renewed momentum, whale activity around PENGU has picked up. According to Nansen, wallet addresses holding over $1 million in PENGU have modestly increased their balances by 1% in the past 24 hours.
This group now holds 2.15 billion tokens, representing 2.8% of the meme coin’s circulating supply. While the accumulation is subtle, increased whale presence signals growing confidence and could provide short-term price support if the trend continues.
Bullish Signals Mount as PENGU Clears the Cloud
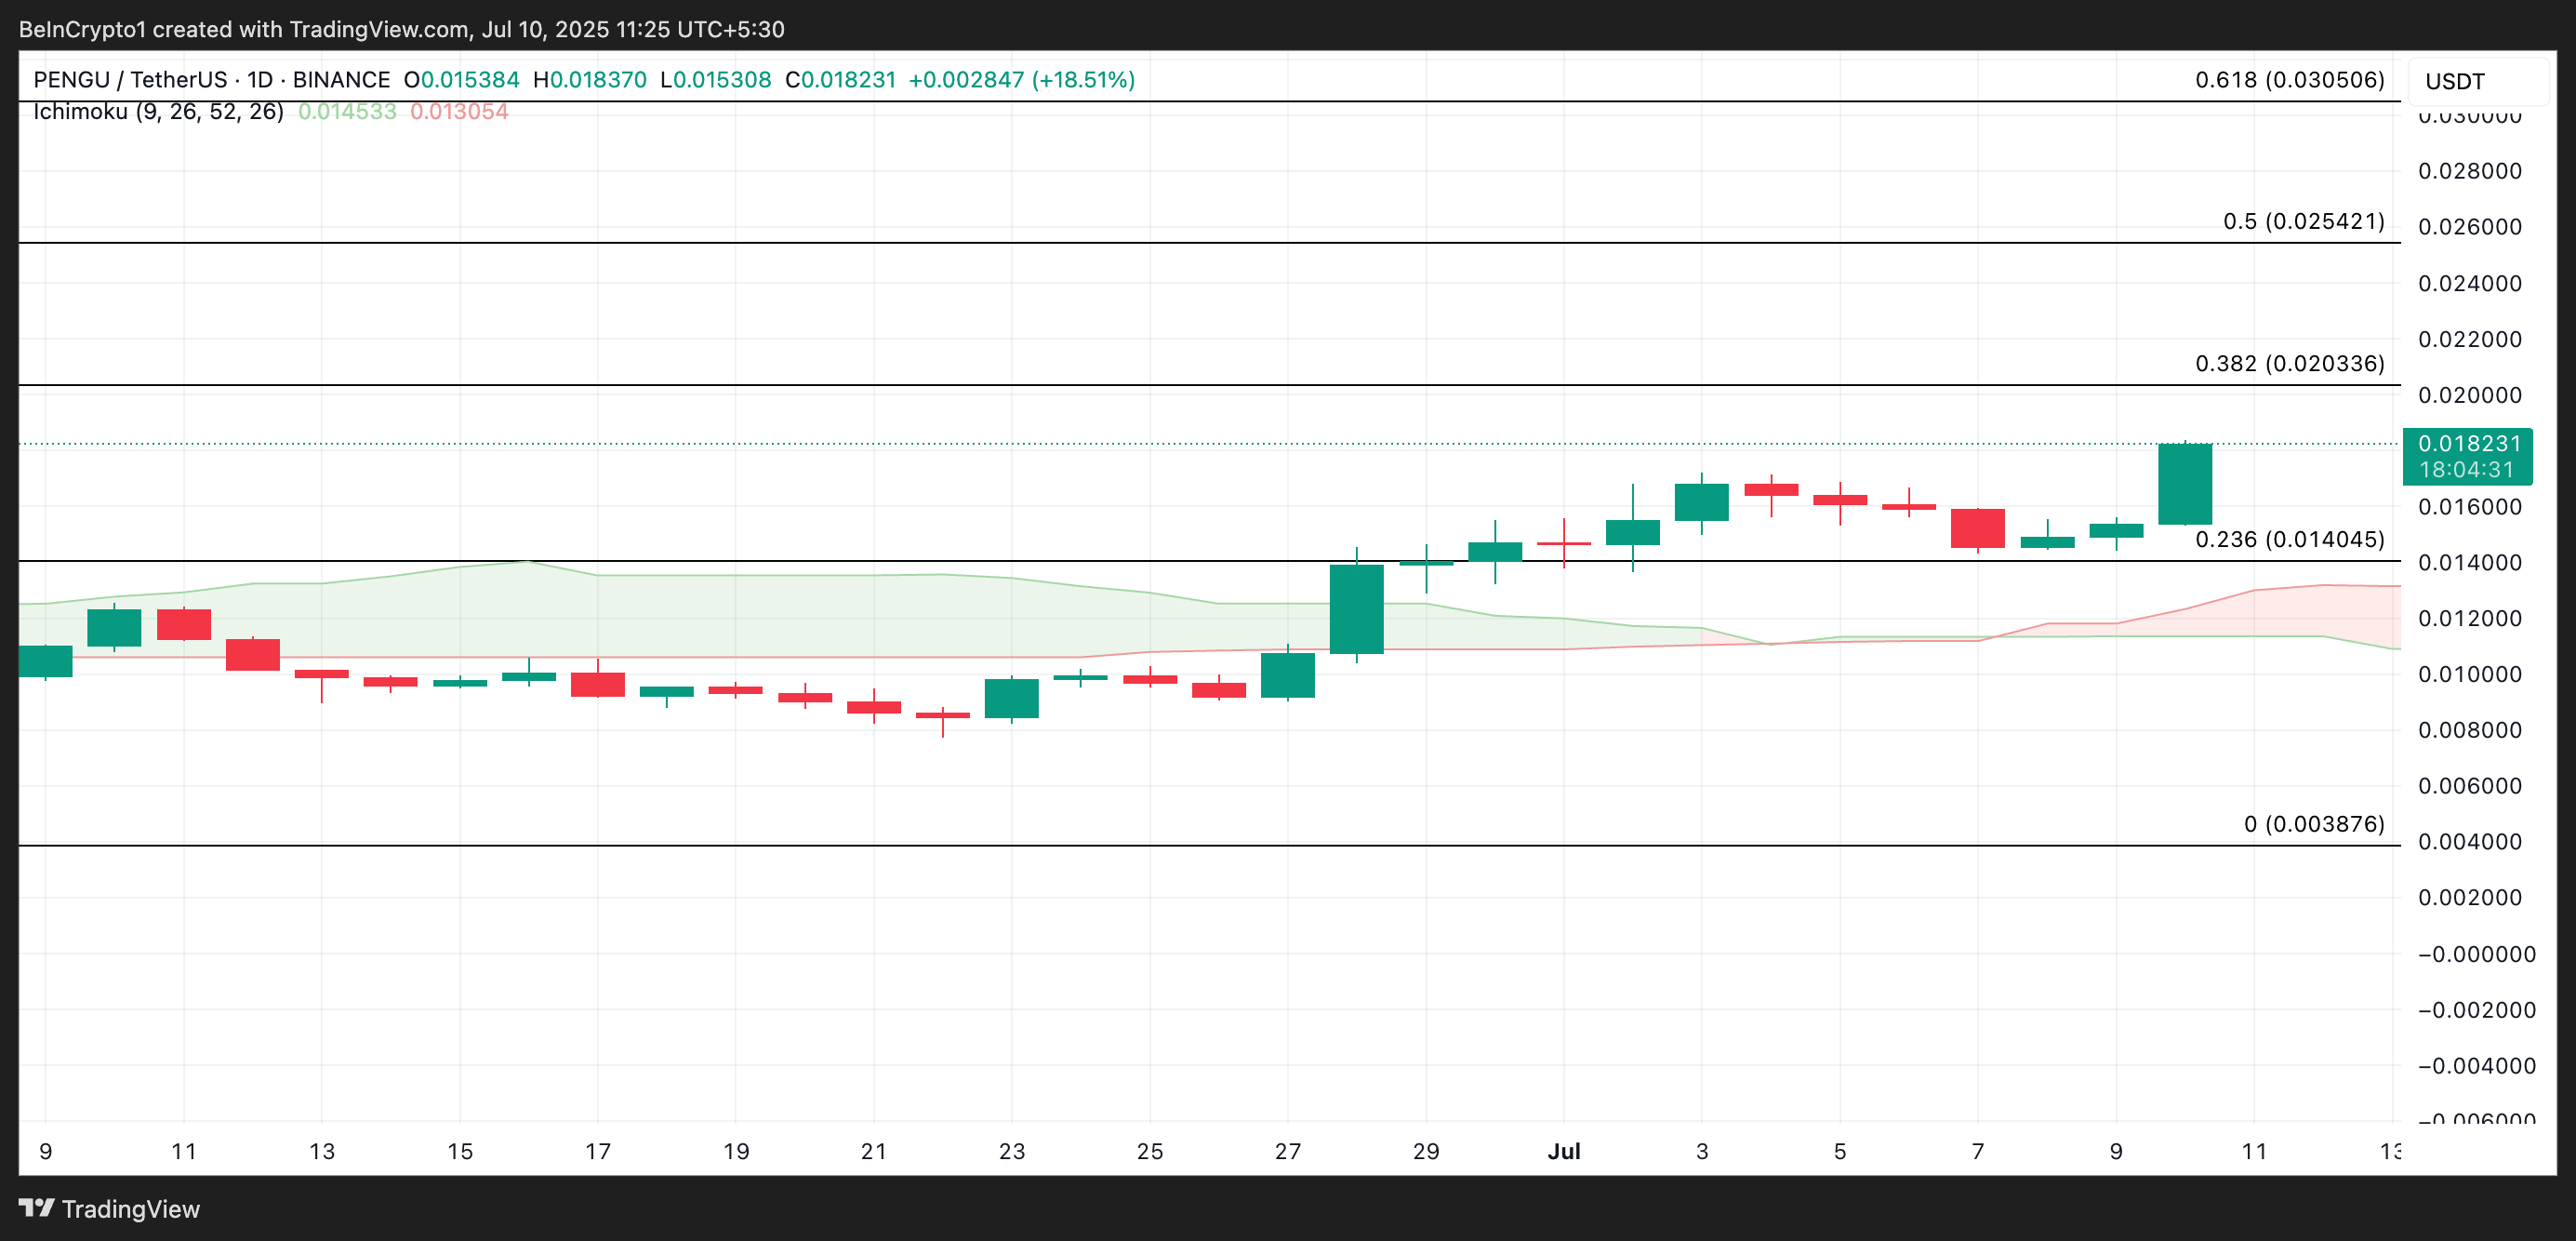
As of this writing, PENGU trades at $0.018. Readings from the PENGU/USD one-day chart show the meme coin exchanging hands above its Ichimoku Cloud.
At press time, this indicator’s Leading Spans A and B form support below PENGU’s price at $0.01405 and $0.0135, respectively.
The Ichimoku Cloud tracks the momentum of an asset’s market trends and identifies potential support/resistance levels. When an asset trades above this cloud, it reflects the bullish pressure in the market. This means demand is strengthening, with bearish pressures kept at bay.
If accumulation continues, PENGU could extend its rally toward $0.0203.
As President Donald Trump’s exclusive gala dinner for top TRUMP coin holders approaches on May 22, analysis of the official winners list reveals a notable dominance of non-US investors. According to reports from CNBC and Bloomberg, the leaderboard of 220 invitees is heavily populated by wallet addresses linked to exchanges that don’t service US customers many top holders are international investors. Trump coin leaderboard shows non-US holder dominance The official TRUMP token leaderboard reveals the top 10 holders control enormous quantities of the meme coin. Many holders even use pseudonymous usernames that offer little insight into their real identities. According to the website, the top holder Sun with a VIP designation controls 1,432,003,302 TRUMP tokens. The second-largest holder, listed as “MeCo,” holds 1,391,538.19 tokens, while the sixth-ranked “Woo” possesses an even 1,000,001 tokens. Other top-10 holders include “CASE” (400,000 tokens), “GAnt” (500,034.299 tokens), and “REKT” (443,686.993 tokens). Source: Trump MEME… Read More at Coingape.com