Coinbase announced that it is delisting MOVE, which subsequently plunged over 16%. The exchange did not describe any specific reasoning for this action, leading community speculation to flourish.
New evidence alleges that Movement Labs was directly or indirectly involved in a market maker dumping 66 million MOVE tokens. Coinbase may have lost confidence in the project between those rumors and a delayed airdrop.
Why Did Coinbase Delist MOVE?
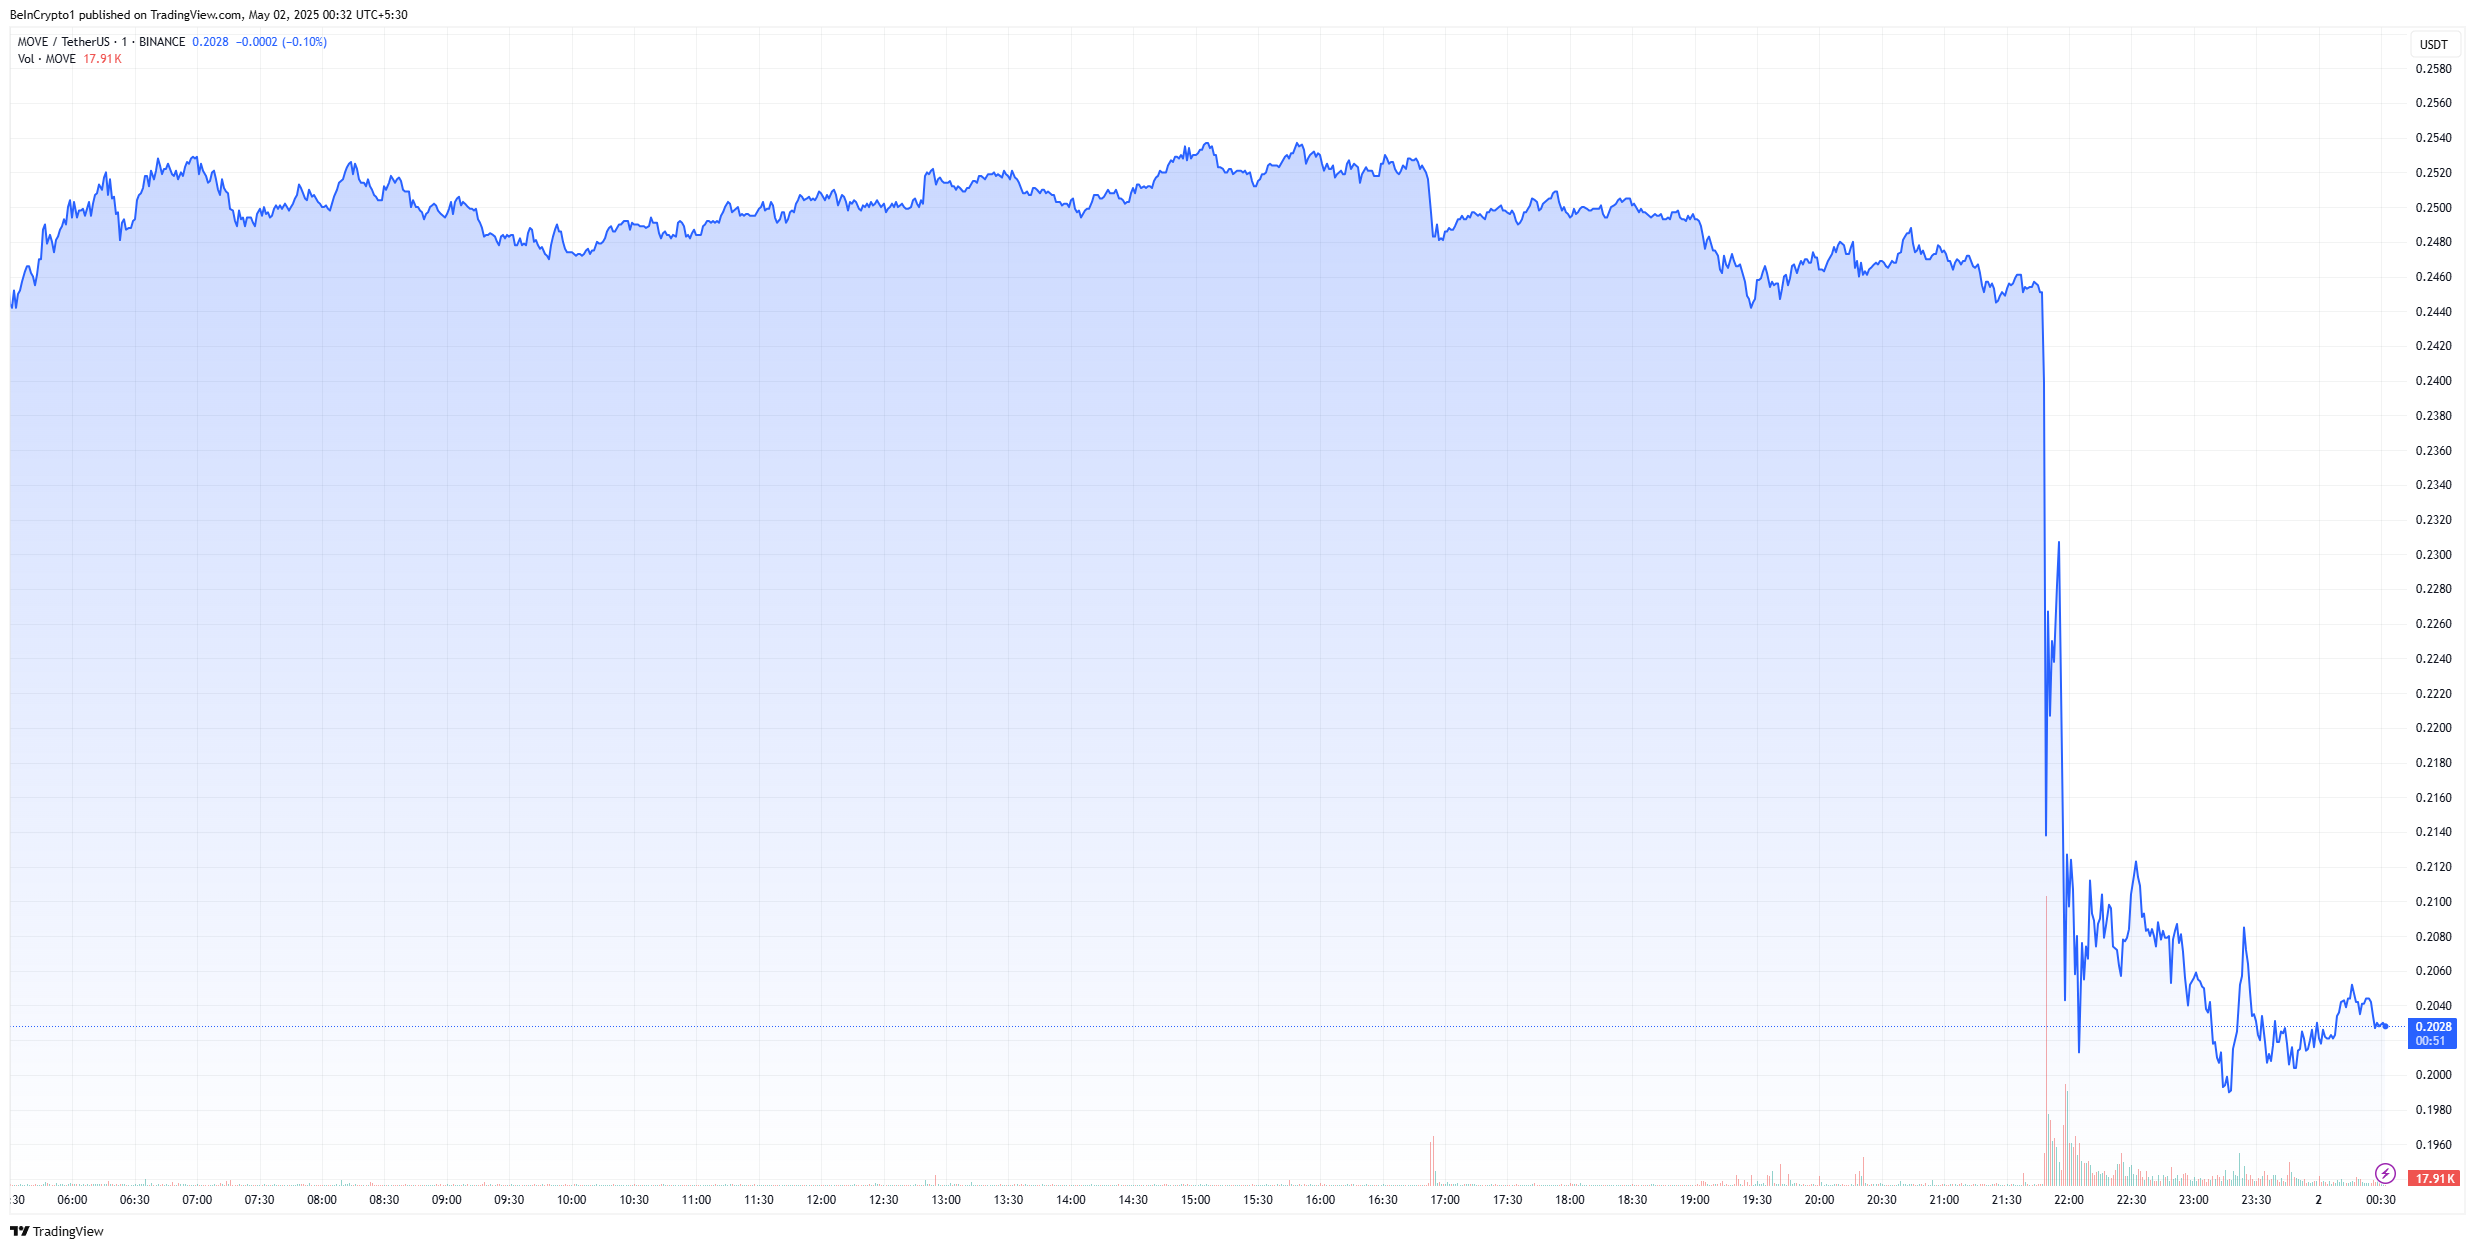
Although Coinbase has the well-documented ability to boost certain cryptoassets by listing them, the reverse is apparently also true. The exchange will suspend all MOVE trading in exactly two weeks, immediately causing the asset to plummet.
In addition to this 16% price drop, MOVE’s daily trading volume surged 130%. This suggests that MOVE holders are selling their assets after Coinbase’s delisting announcement.
This is a serious blow to Movement Network’s credibility and reputation. The project showed significant potential and even outperformed Bitcoin and Ethereum during the Q1 2025 cycle. It also raised $100 million in VC funding earlier this year, backed by notable investors.
However, Coinbase’s delisting is not unfounded. Earlier today, Movement Labs announced that a planned airdrop was being delayed, helping spark frustration. That may have been the final straw for Coinbase, on top of pre-existing problems.
Specifically, Movement Labs claimed it would investigate an instance of potential fraud in mid-March. A market maker dumped 66 million MOVE tokens, triggering a sharp price drop.
New evidence has come to light, leading users to allege that Movement Labs was directly or indirectly complicit in these dealings. The company allegedly loaned 50% of MOVE’s supply to investment platform Web3Port, which proceeded to dump a large volume of tokens.
Based on these incidents, the community fears a repeat of MANTRA’s historic OM crash. Meanwhile, Movement Labs is backed by the Trump Family’s World Liberty Financial. The DeFi project holds more than 7 million MOVE tokens.
The post MOVE Crashes 16% After Coinbase Delisting – Here’s What Happened appeared first on BeInCrypto.