After 11 consecutive weeks of relentless Bitcoin buying, Strategy (formerly MicroStrategy) is bracing for another purchase announcement. Michael Saylor has dropped a clue for an incoming purchase that can send Strategy’s holdings above 600,000 BTC. Michael Saylor Flashes Buy Signal For Strategy Strategy founder Michael Saylor has shared the leading indicator for an incoming Bitcoin
As geopolitical tensions intensify and investor sentiment deteriorates, bearish pressure has continued spreading across Bitcoin’s spot and derivatives markets.
The uncertainty surrounding global macroeconomic stability has led many market participants to take a risk-off approach, with the coin showing signs of vulnerability as the second quarter draws to a close.
Bitcoin Futures Turn Bearish
With the coin struggling to rally momentum around the $103,000 price mark, Bitcoin futures traders have increasingly positioned against the coin.
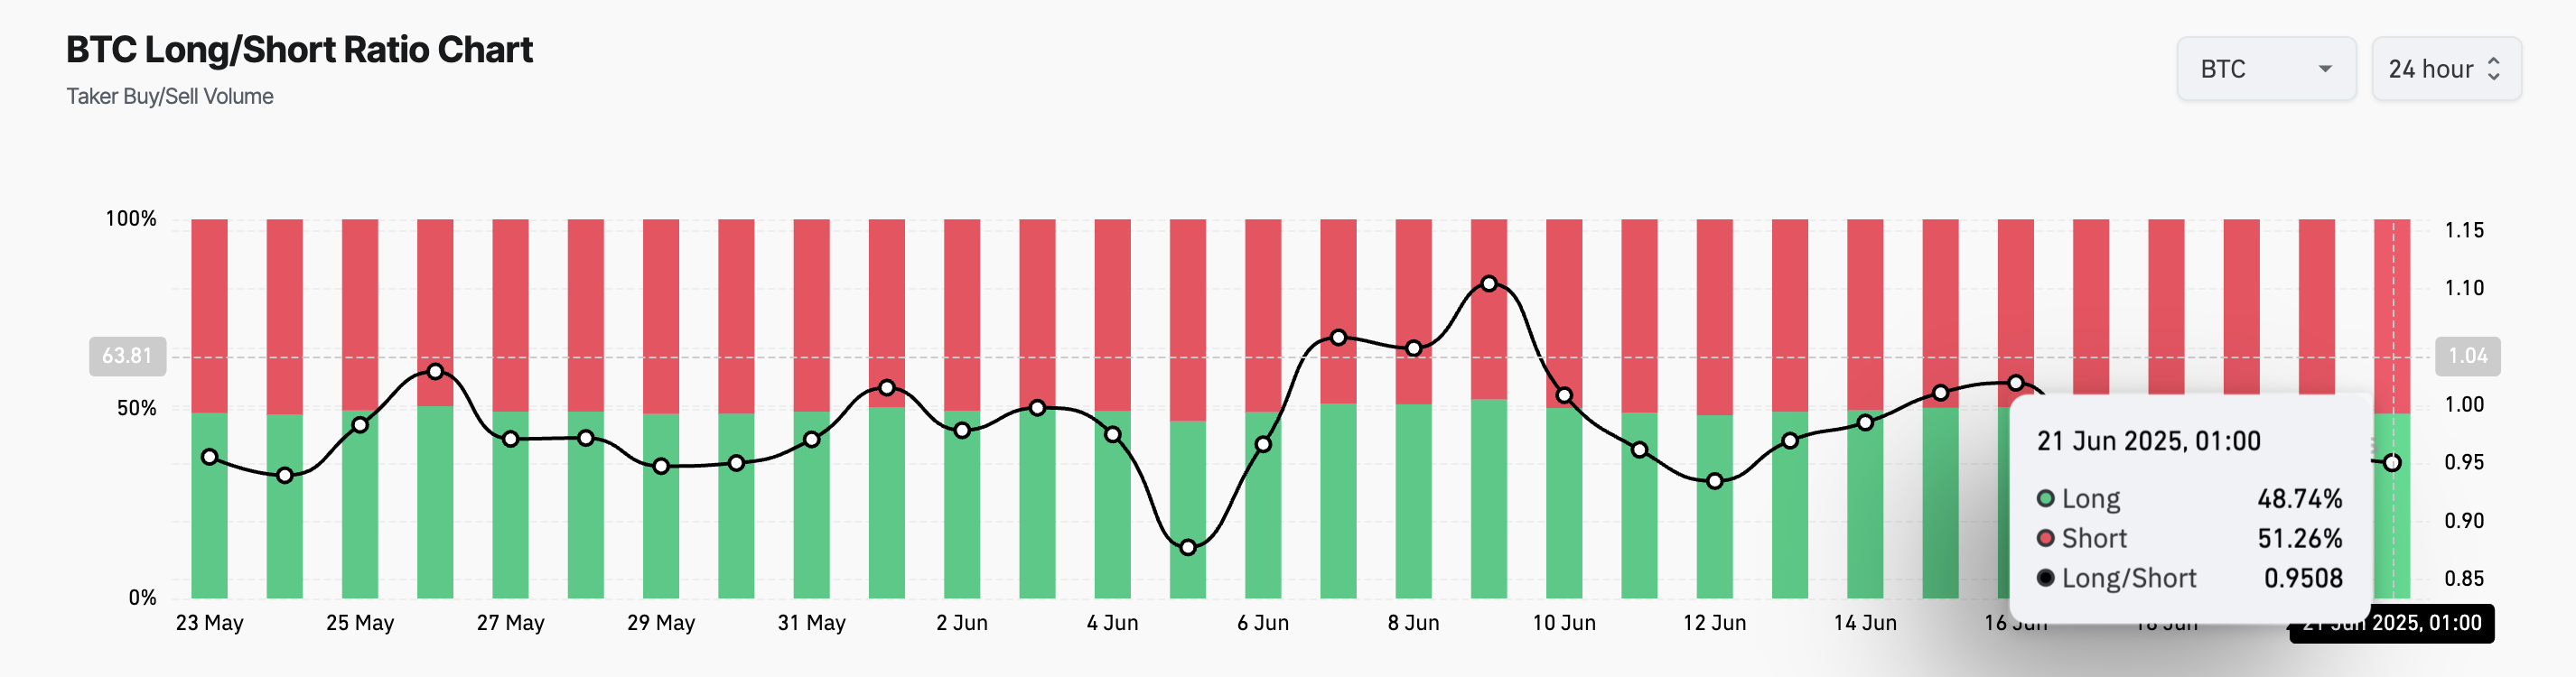
According to Coinglass, the coin’s long/short ratio — a key measure of trader sentiment — has tilted heavily toward shorts since June 17, indicating a growing belief that BTC’s recent rally may be losing momentum. At press time, the ratio is 0.95, indicating more traders are betting against the altcoin.
This ratio compares the number of long and short positions in a market. When an asset’s long/short ratio is above 1, there are more long than short positions, indicating that traders are predominantly betting on a price increase.
Conversely, as seen with BTC, a ratio below one indicates that most traders are positioning for a price drop. This reflects heightened bearish sentiment and growing expectations of continued downside movements in the short term.
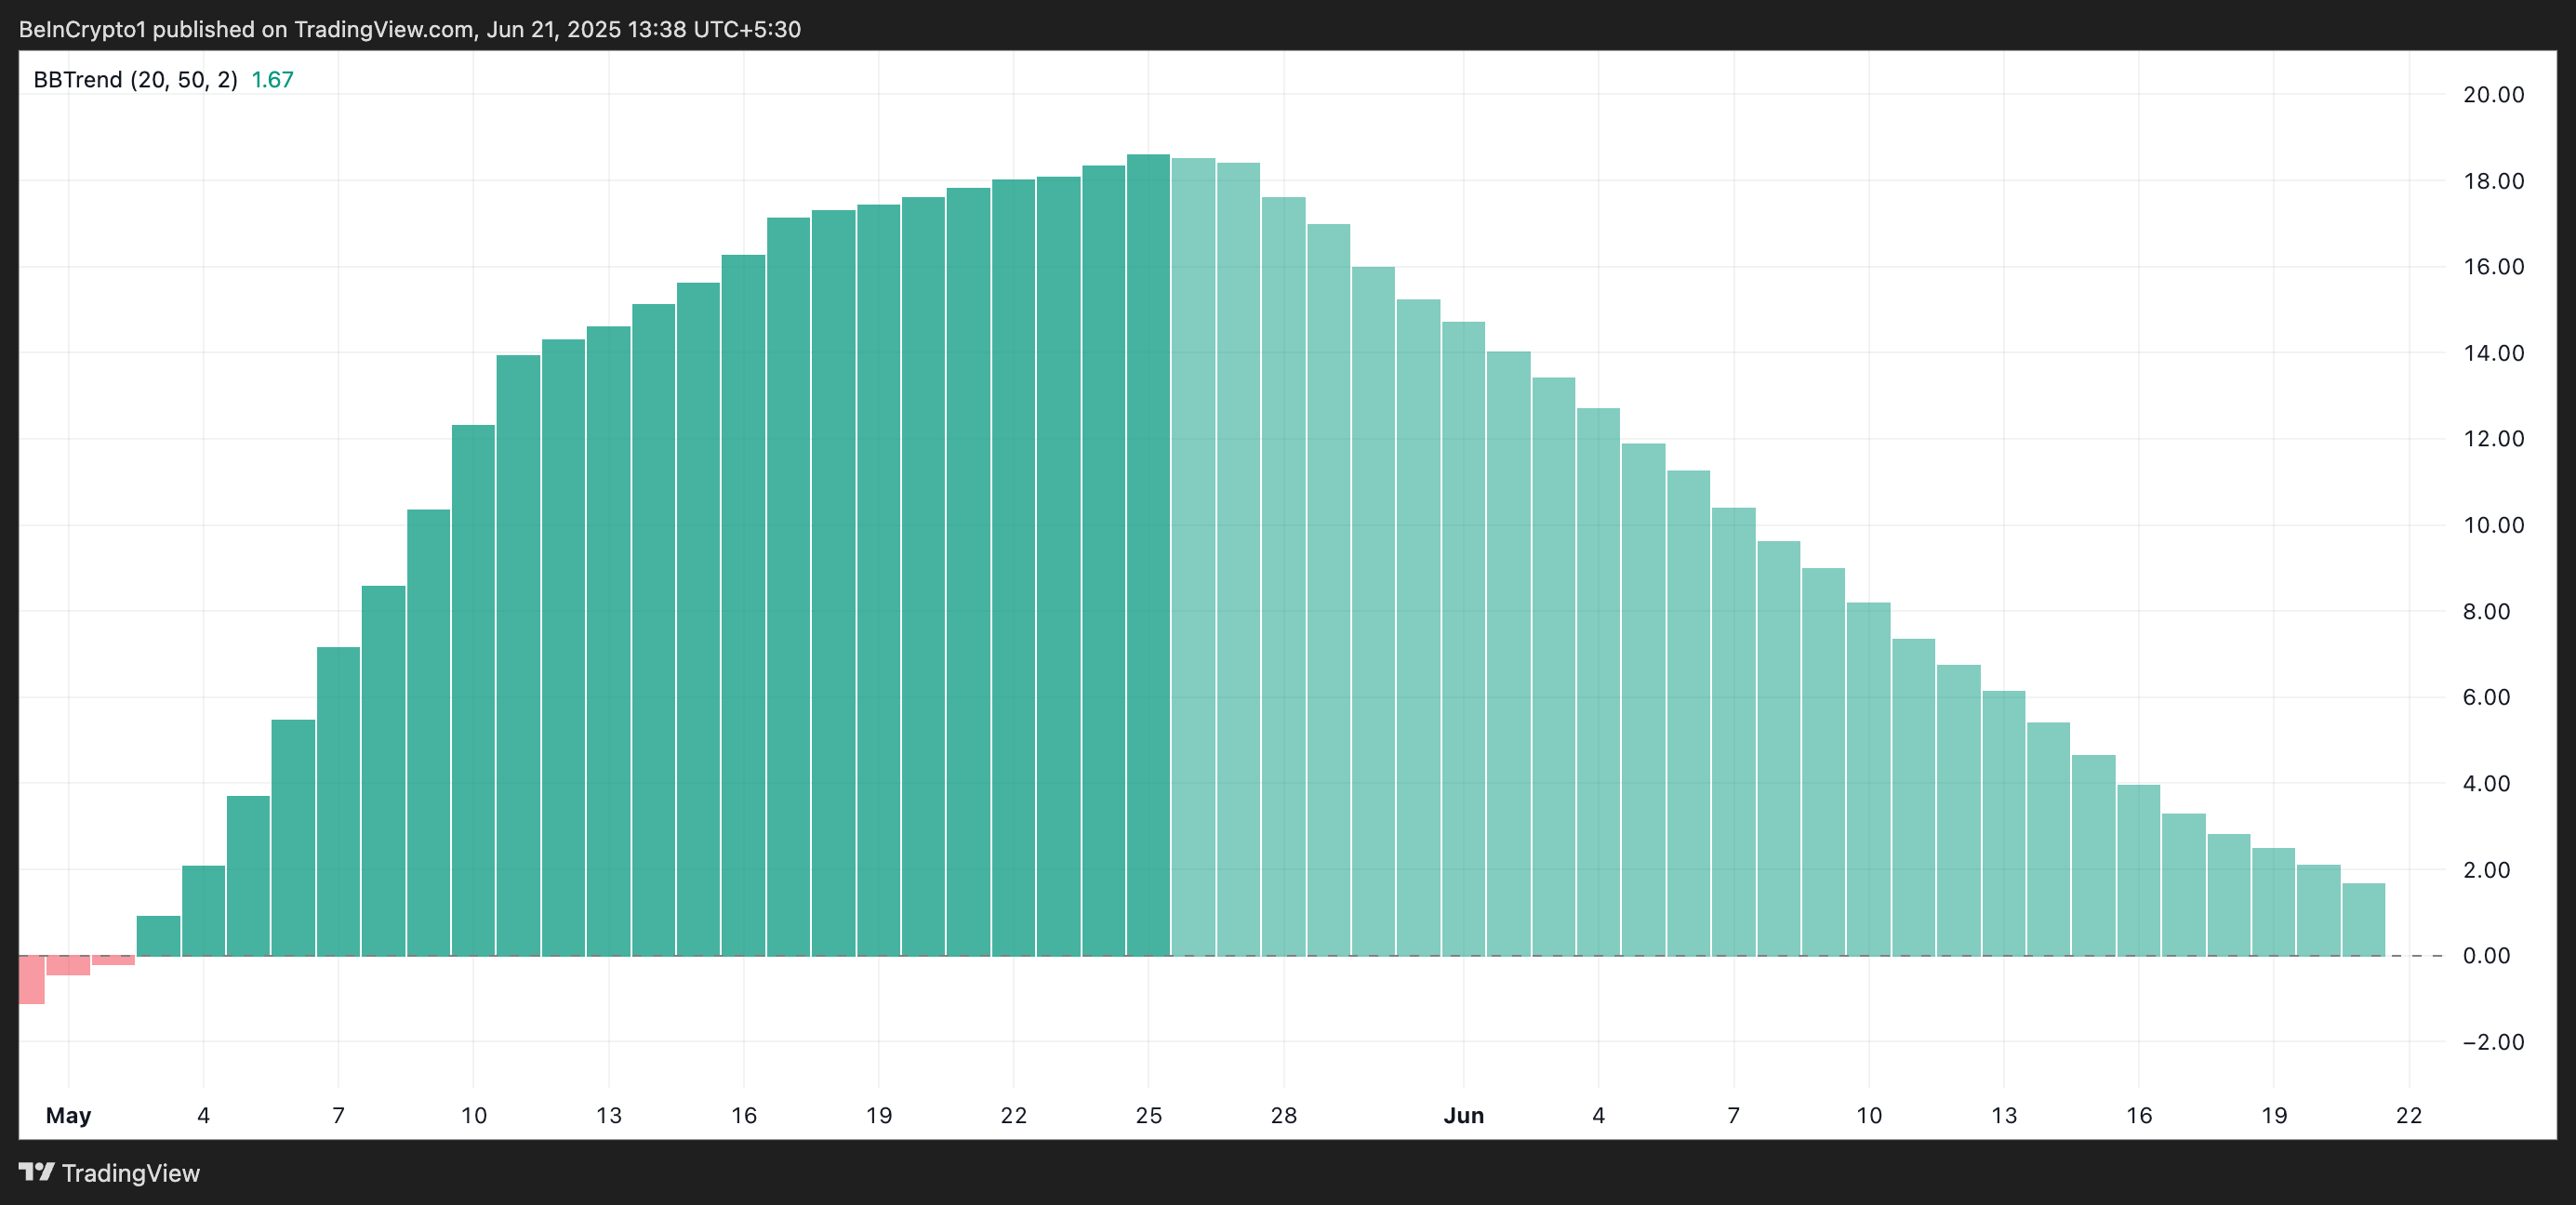
Moreover, daily chart readings from BTC’s BBTrend indicator reinforce the bearish outlook. As BTC’s price momentum weakens, the green histogram bars on the indicator have steadily fallen in size, signaling a decline in buying pressure and a loss of bullish strength.
The BBTrend is used to gauge the strength and direction of price trends. It appears as histogram bars — green when the trend is bullish and red when bearish.
When the BBTrend turns negative or the green bars shrink, upward momentum is fading, and the asset may be entering a consolidation phase or facing a reversal.
A consistently negative BBTrend suggests that selling pressure is dominating, increasing the likelihood of an extended price correction for BTC.
BTC Slips to Two-Week Low: Will Support at $102,000 Hold?
Yesterday, BTC’s price fell to a 15-day low of $102,345. Although it rebounded and closed at $103,297, bearish pressure remains, with the coin still down 2% over the past 24 hours.
If new demand continues to be limited, BTC’s price could extend its dip toward $101,520. Should the bulls fail to defend this critical support level, the asset could plunge further to $97,658.
Bitcoin Price Analysis. Source: TradingView
On the other hand, if buying pressure strengthens, BTC could rebound and attempt a break above $103,952. A successful move past this level may open the door for a rally toward $106,295.
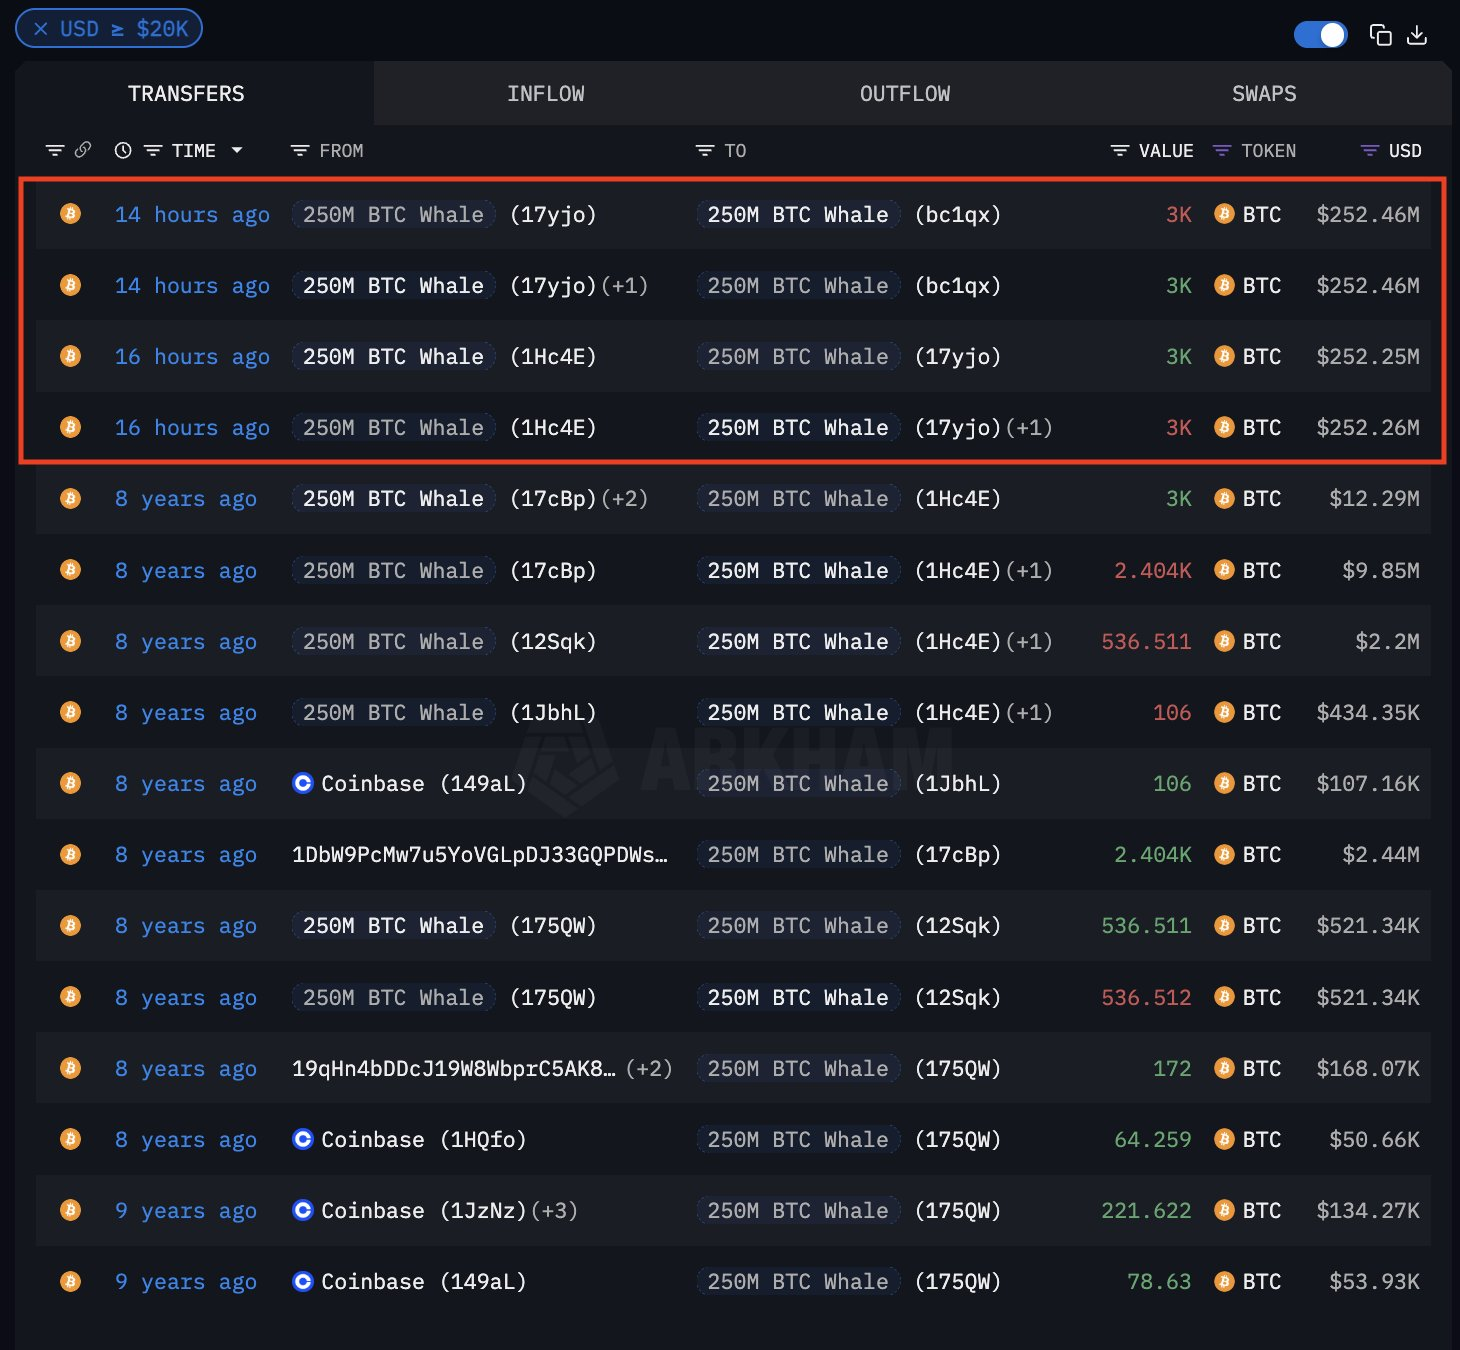
An early Bitcoin investor has resurfaced after nearly a decade of inactivity, drawing attention across the crypto space.
On March 22, the Bitcoin whale transferred 3,000 BTC—worth over $250 million at the time of the move. A Bitcoin whale is an individual or entity that holds more than 1000 BTC.
Why is the Bitcoin Whale Active After 8 Years?
According to Arkham, the Bitcoin whale’s wallet dates back to late 2016, when Bitcoin was trading below $1,000.
The investor’s original stake—estimated at around $3 million—has since grown into a massive fortune, reflecting the asset’s long-term potential.
During this holding period, Bitcoin hit an all-time high of almost $110,000 in January 2025. Though the price has since pulled back to around $84,274, the whale’s ROI remains staggering.
The motive behind the transfer remains unclear. However, analysts noted that the funds were moved to another wallet—not an exchange—indicating the holder may be restructuring rather than preparing to sell.
This detail appears to have calmed fears of a market dump. BeInCrypto data shows that the broader crypto market has stayed stable despite the whale’s activity. Bitcoin and other top assets have shown little price volatility in response.
Meanwhile, this transfer is not an isolated case. Over the past year, several long-dormant wallets have shown signs of activity.
Some analysts believe early holders are reassessing their positions as Bitcoin trades near historic highs. Others suggest these investors may be preparing for more complex strategies involving futures or options.
Nevertheless, this case reinforces Bitcoin’s reputation as a long-term store of value. The whale’s decision to hold for nearly a decade shows how the asset has outperformed traditional stores of wealth like gold and the US dollar.
ARB, the native token of the leading Layer-2 scaling solution Arbitrum (ARB), is today’s top-performing token. It is up over 16% today, fueled by growing speculation surrounding a potential partnership with Robinhood.
Interestingly, on-chain data suggests that the rally may be short-lived as key metrics flash warning signs.
Arbitrum Tops Gainers as Robinhood Speculation Runs Hot
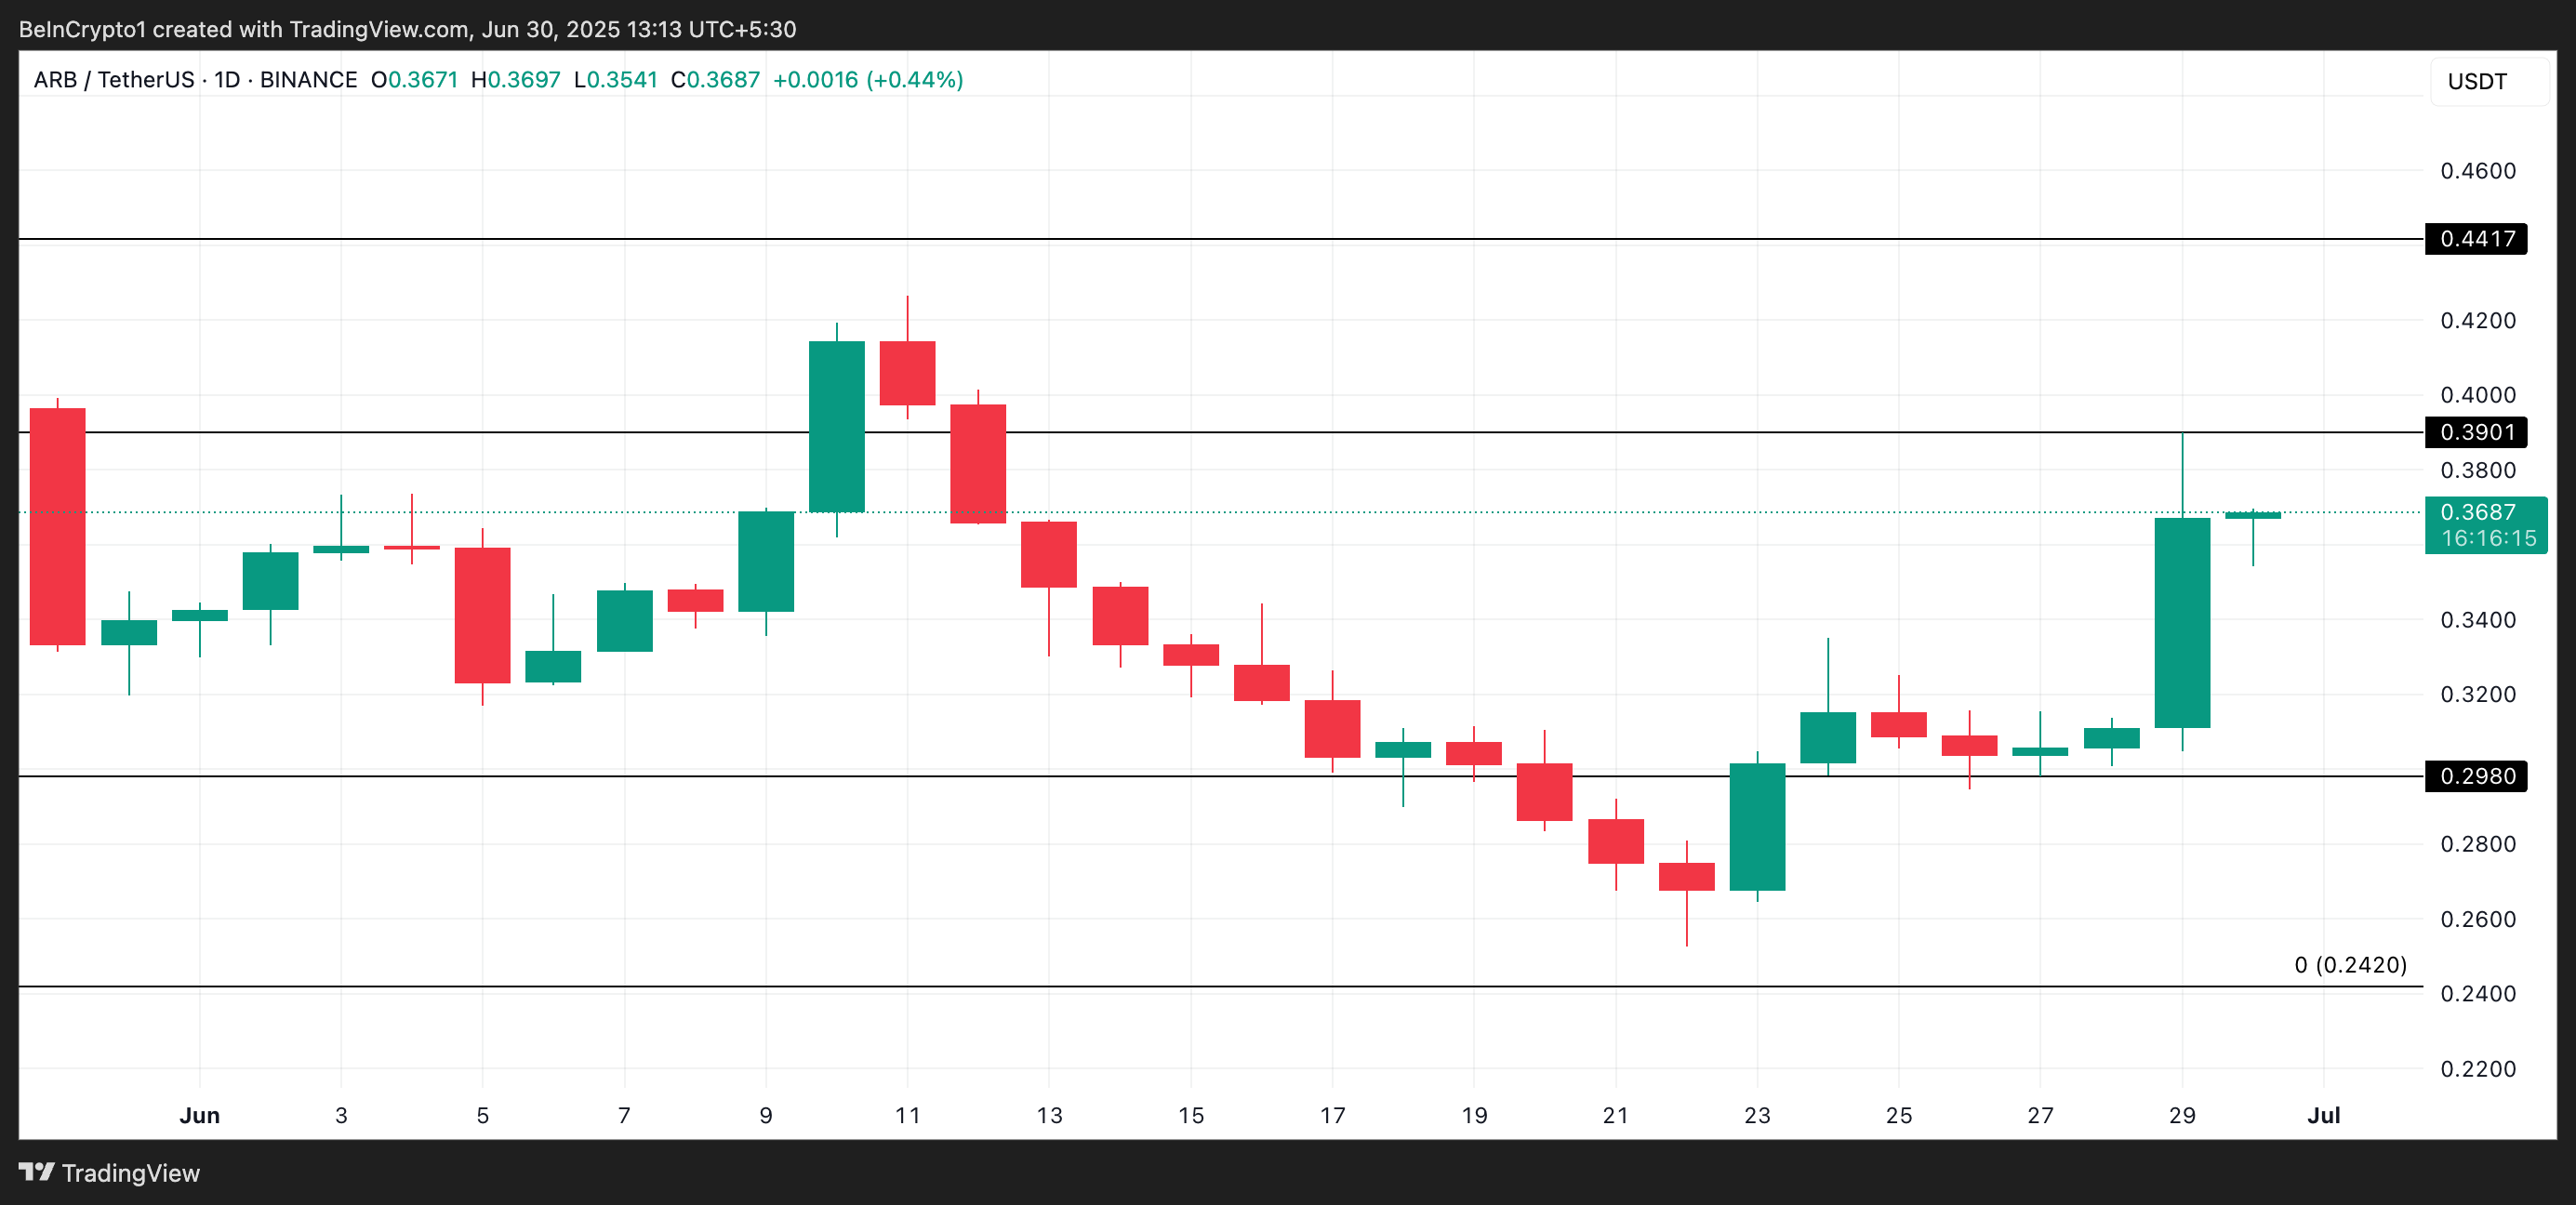
ARB is up by double digits today and currently trades at $0.36. This comes ahead of the Monday fireside chat between Ethereum co-founder Vitalik Buterin, Robinhood Crypto General Manager Johann Kerbrat, and A.J. Warner, the Chief Strategy Officer at Offchain Labs, the team behind Arbitrum.
This upcoming meeting has fueled speculation that Arbitrum could be announced as a partner for Robinhood’s blockchain plans. The buzz is partly driven by a May 8 Bloomberg report, which revealed that the US-based platform is developing a blockchain-based platform, with Arbitrum reportedly being considered a potential partner for the venture.
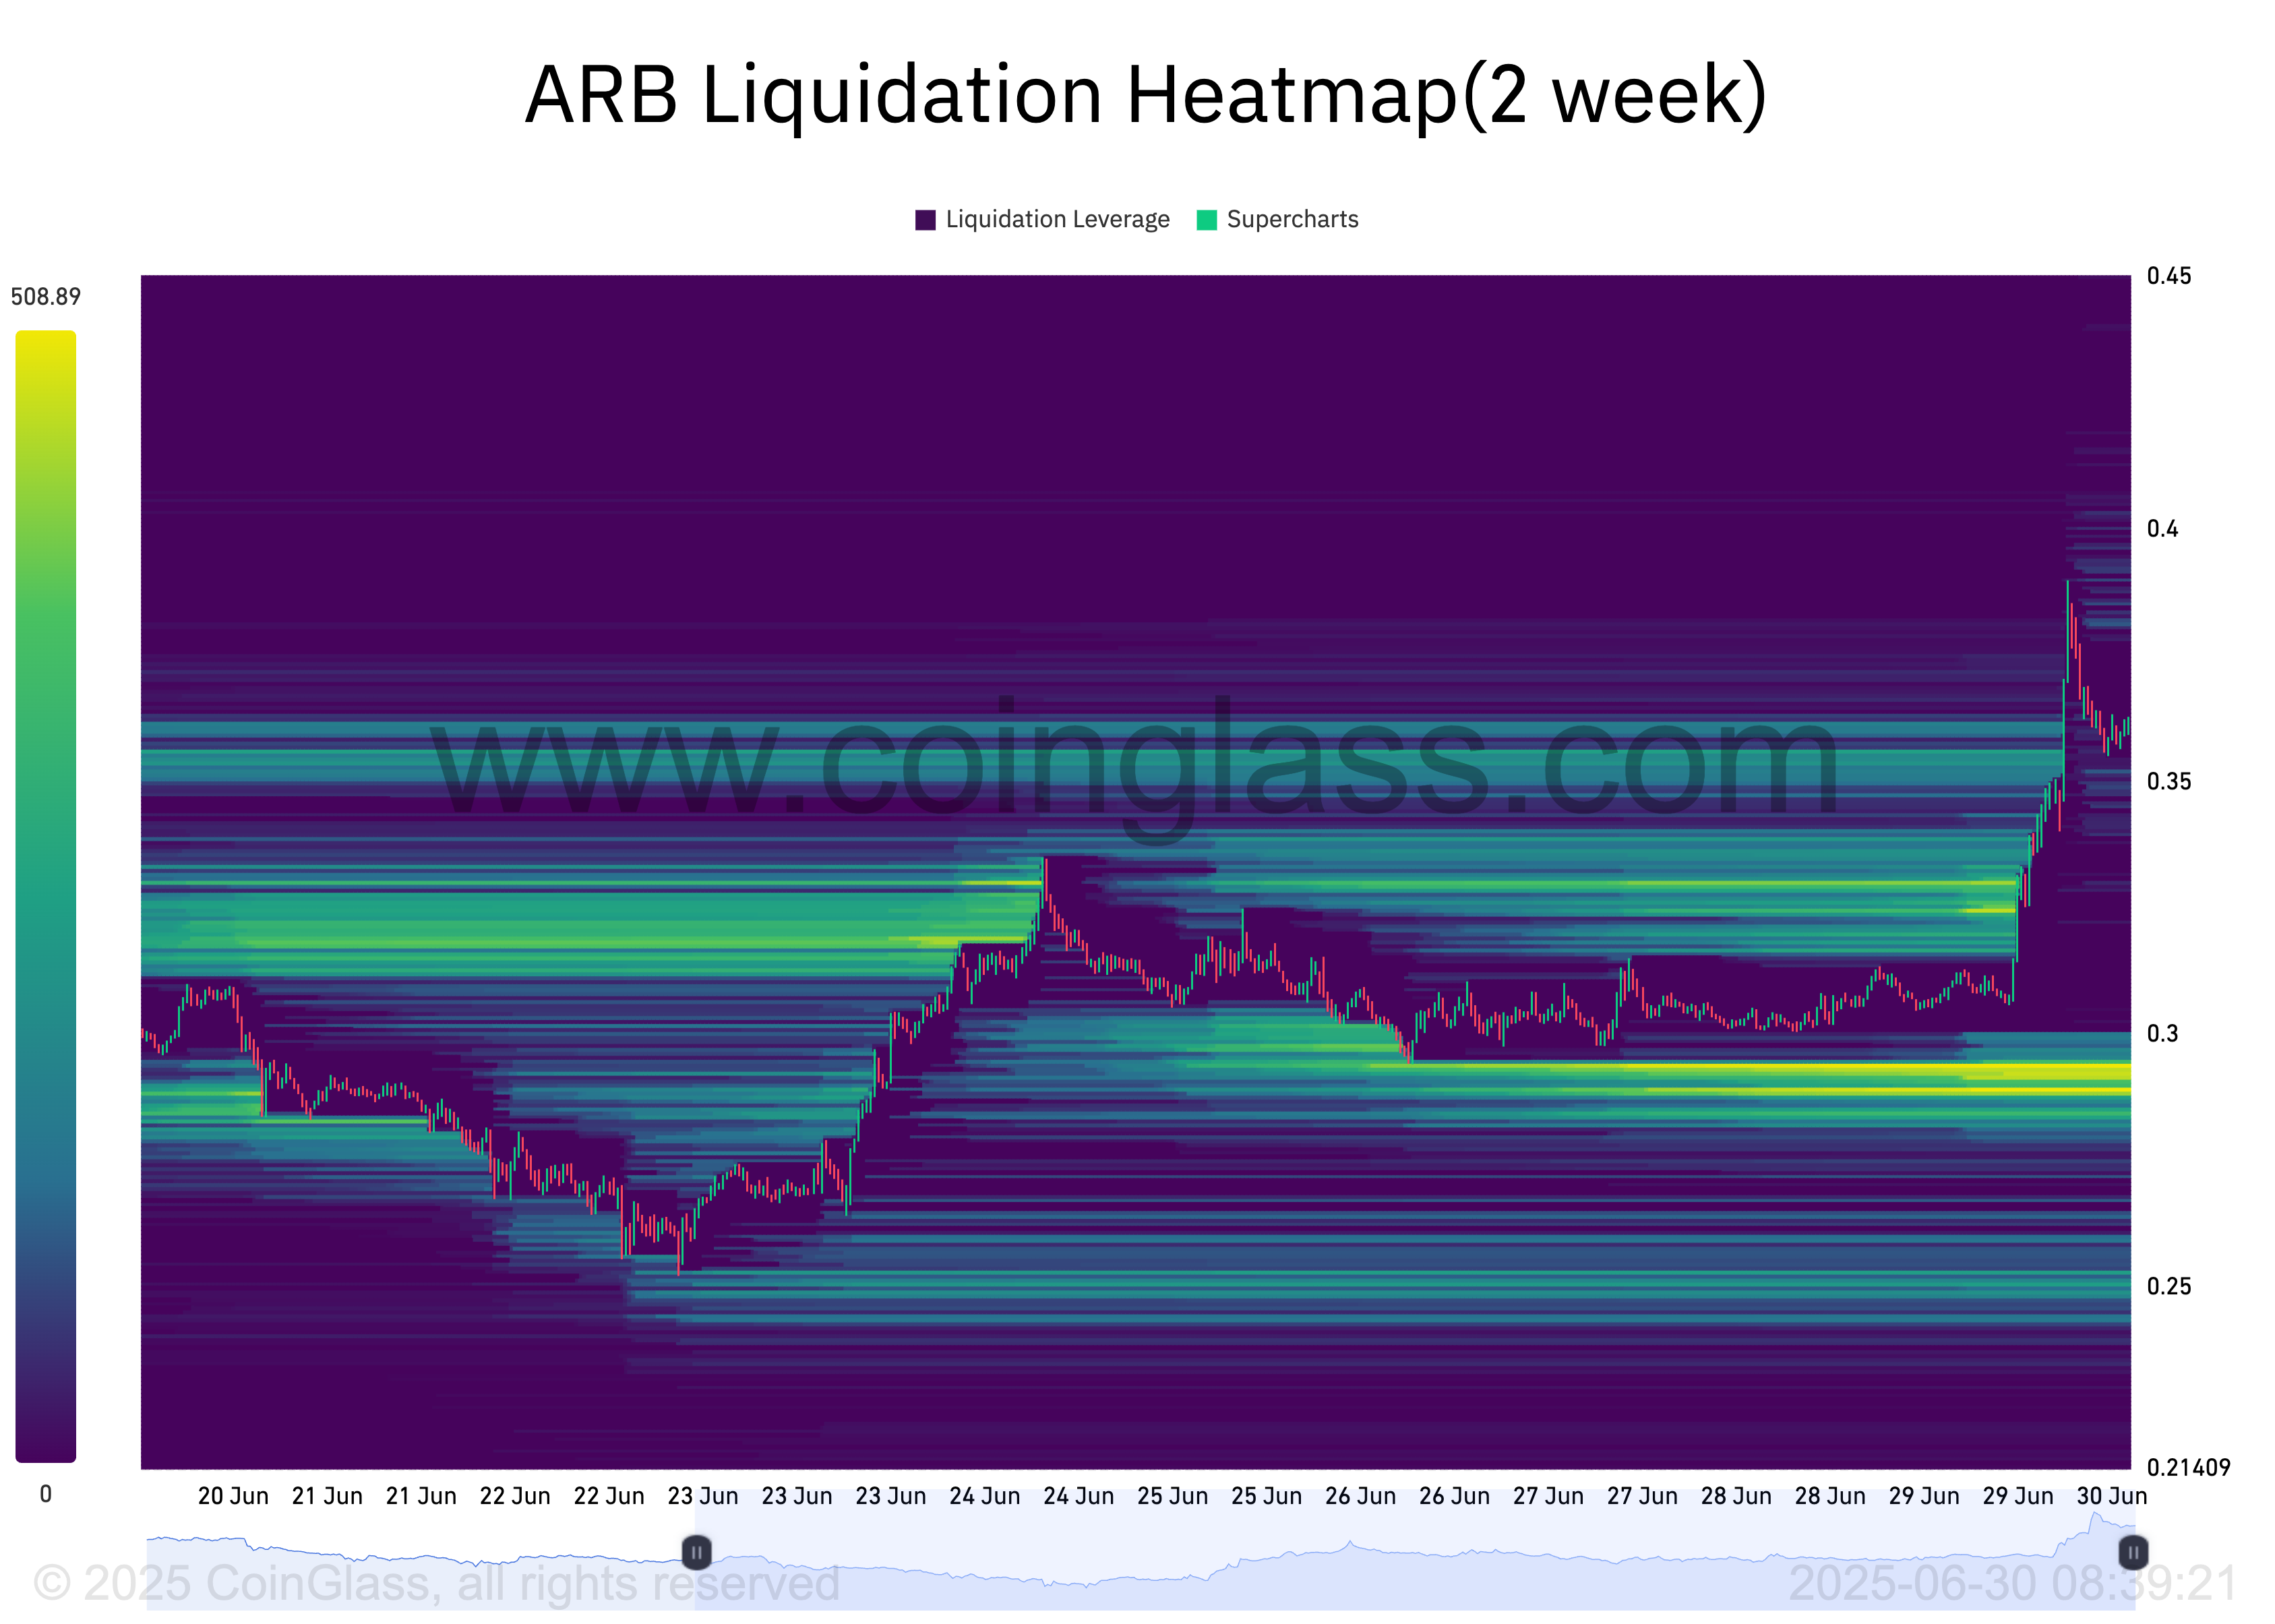
However, despite the bullish price action, on-chain data indicates that the rally may face some challenges in the short term. For example, the token’s liquidation heatmap shows a substantial liquidity cluster below ARB’s price at $0.29, suggesting that a pullback could be on the horizon.
Liquidation heatmaps are visual tools traders use to identify price levels where large clusters of leveraged positions are likely to be liquidated. These maps show areas of high liquidity, often color-coded to show intensity, with brighter zones representing larger liquidation potential.
When the heatmap shows a liquidity cluster below an asset’s price, many leveraged long positions have liquidation levels in that area. This acts as a magnet for price retracement, as the market may move down to trigger those liquidations before continuing in either direction.
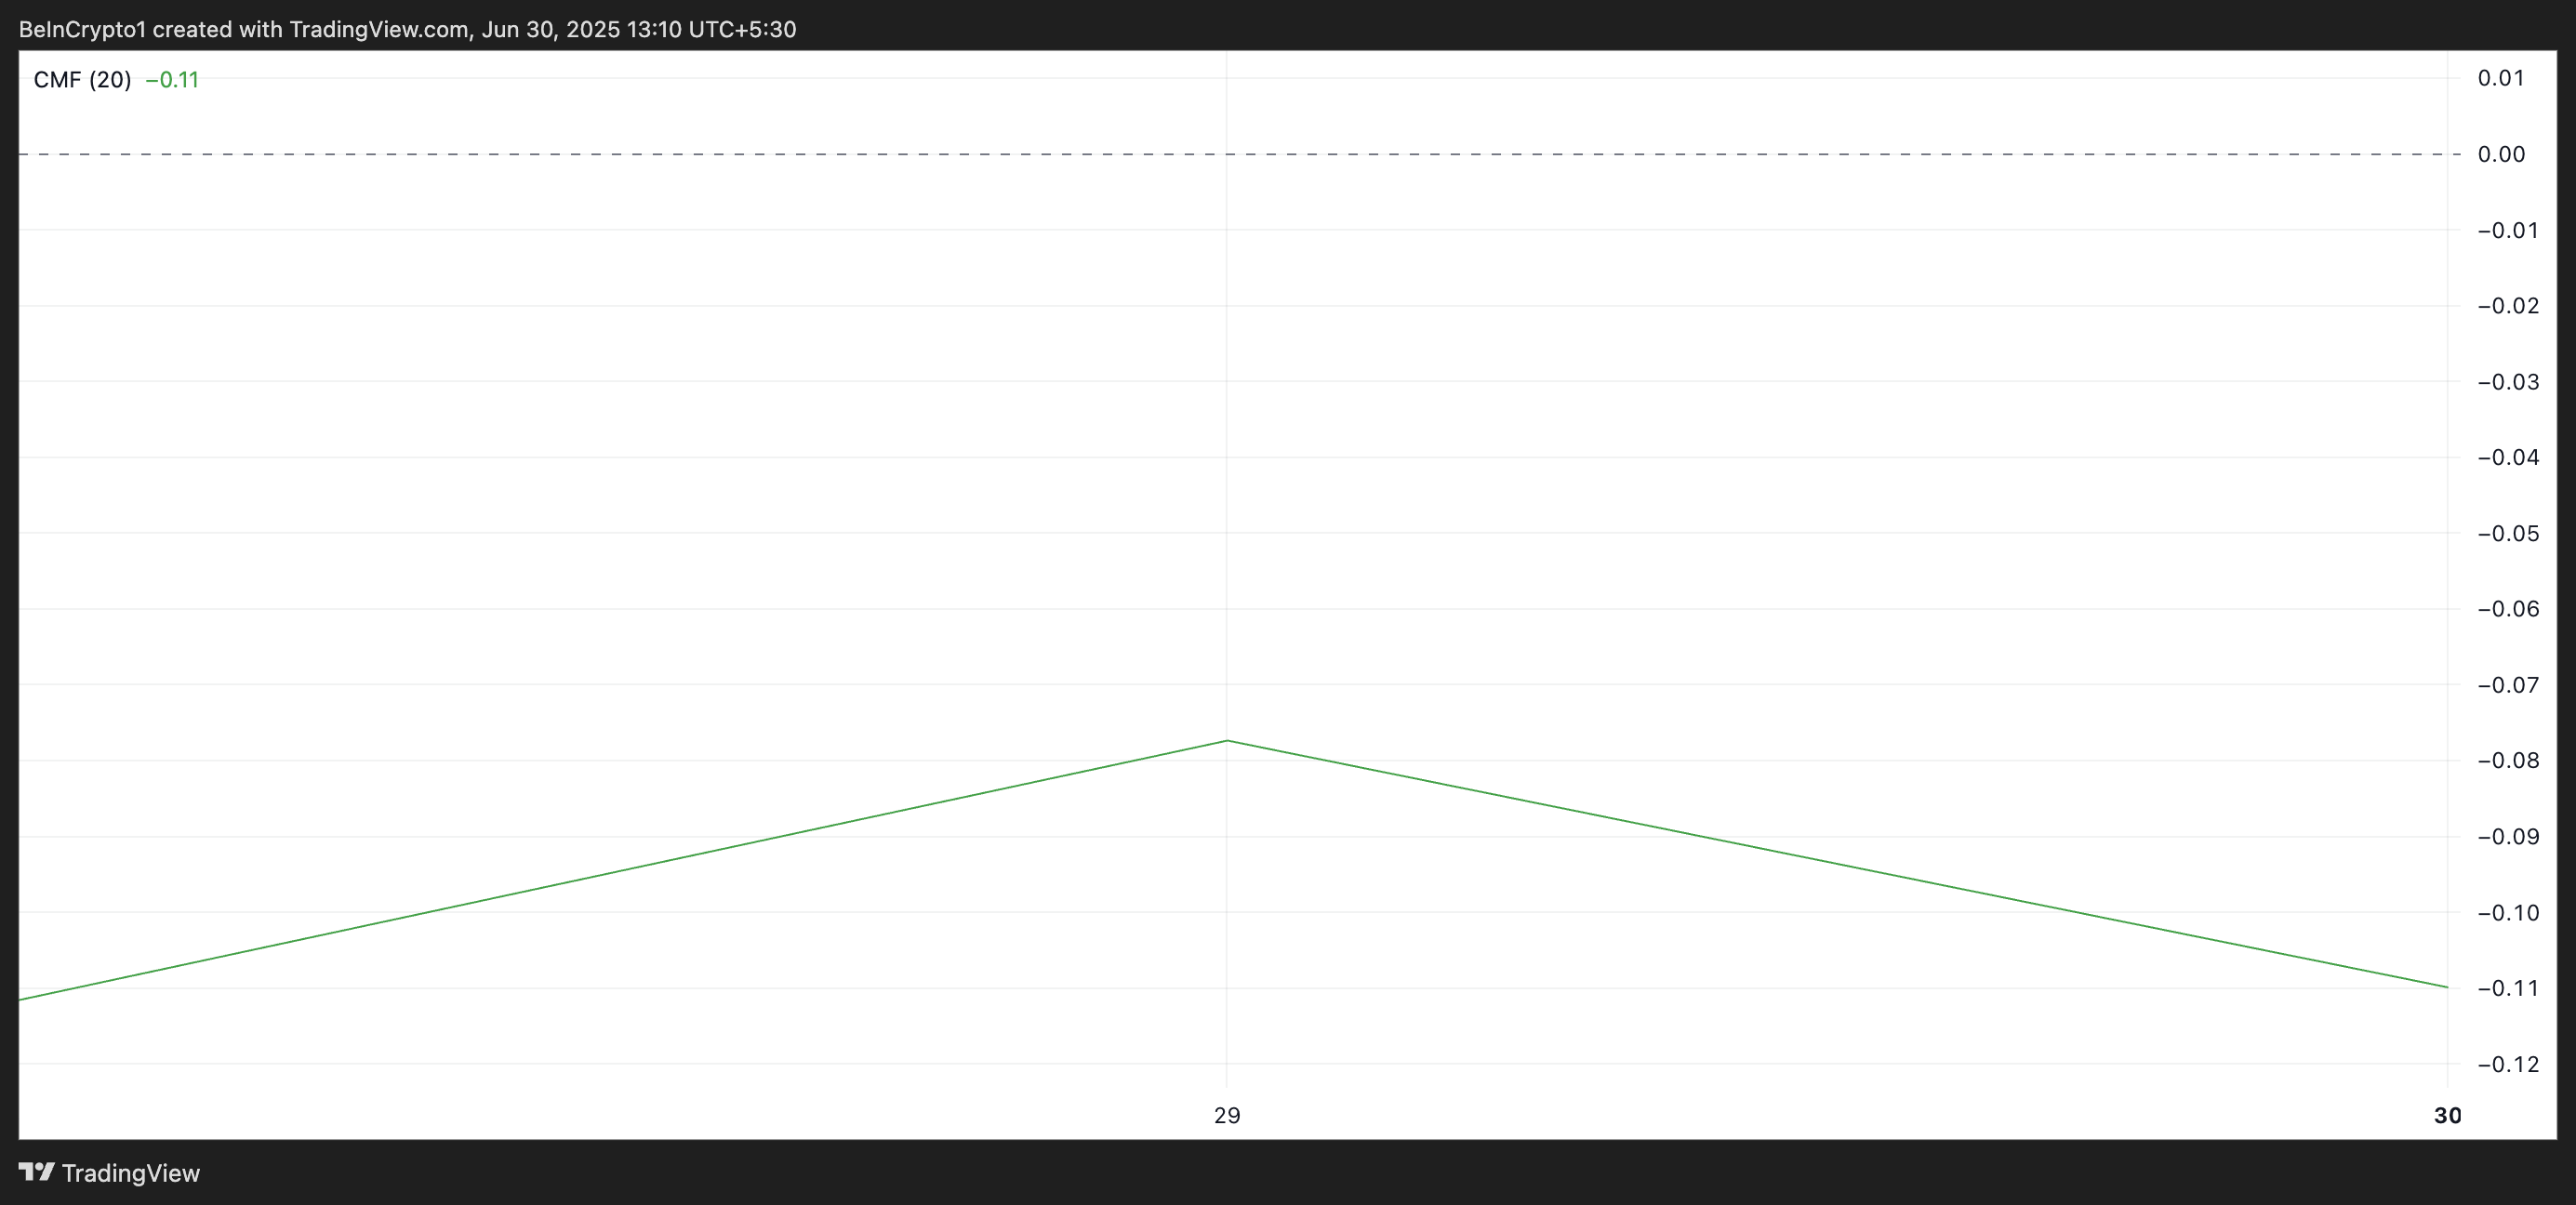
Moreover, while its price climbs, the altcoin’s Chaikin Money Flow (CMF) indicator shows a noticeable downtrend. It is at -0.12 at press time, forming a bearish divergence with ARB’s price.
This bearish divergence occurs when prices rise while money flow falls, indicating weakening buying pressure behind the rally. ARB could soon witness a correction if this trend persists, risking reversing some of its recent gains.
Arbitrum Bulls Face a Critical Test
At its current market price, ARB trades above key support at $0.29. This price point represents the crucial barrier preventing the token from revisiting its all-time low of $0.24.
If ARB’s rally continues to lack sufficient bullish backing, a breakdown below this level remains possible.