Layer-1 (L1) coin LTC is today’s top gainer, climbing 10% in the past 24 hours. The double-digit surge comes following a regulatory setback, as the US SEC delayed its decision on Canary Capital’s application for a spot Litecoin ETF.
However, the current LTC token upward momentum may be on shaky ground as technical indicators suggest a potential bearish reversal.
On Tuesday, after the SEC called for public comments on Canary Capital’s application for a spot Litecoin ETF, LTC plunged to a two-week low of $81.03.
However, the resurgence in trading activity across the broader crypto market over the past day has helped LTC rebound from this dip. It now trades at $91.68, with daily trading volume exceeding $850 million.
But, there is a catch. Key technical and on-chain indicators suggest a potential bearish reversal in the short term, as buyer exhaustion appears on the horizon.
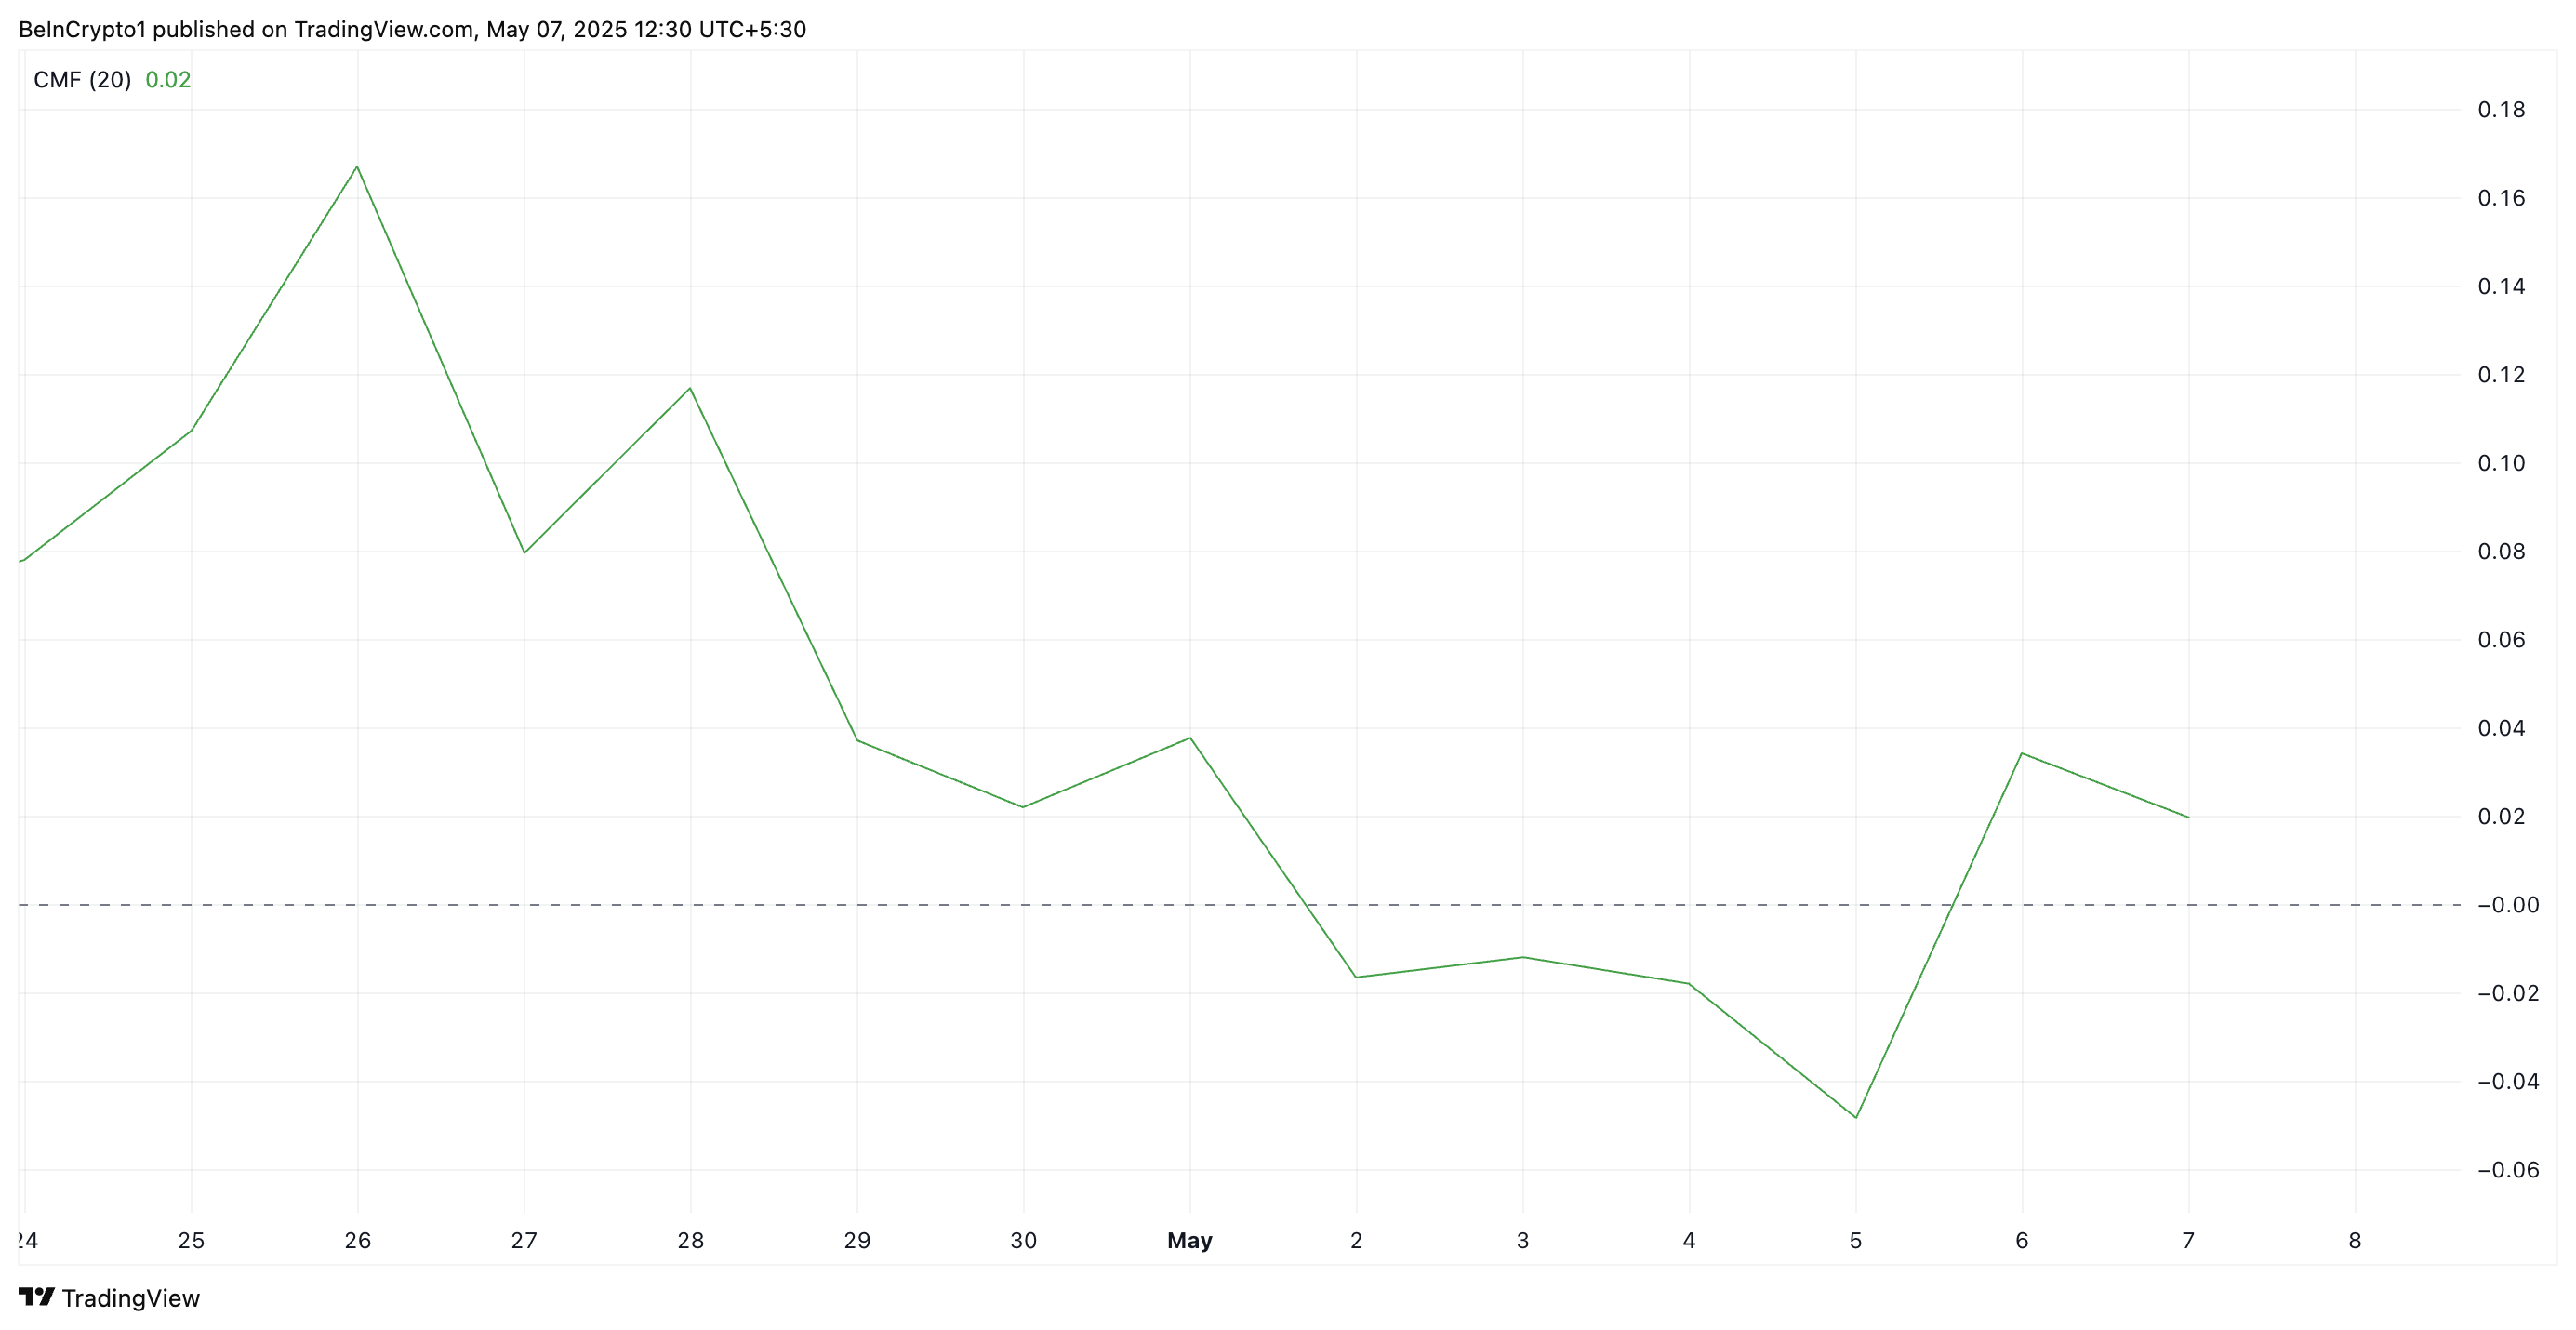
For example, despite LTC’s rally, its Chaikin Money Flow (CMF), which measures buying and selling pressure, has declined, forming a bearish divergence. Readings from the daily chart show that this momentum indicator is declining and poised to breach the center line.
A CMF bearish divergence occurs when the price of an asset makes higher highs while the indicator makes lower highs. This suggests that buying pressure is weakening despite rising prices. The trend indicates a potential reversal or loss of upward momentum in the LTC market.
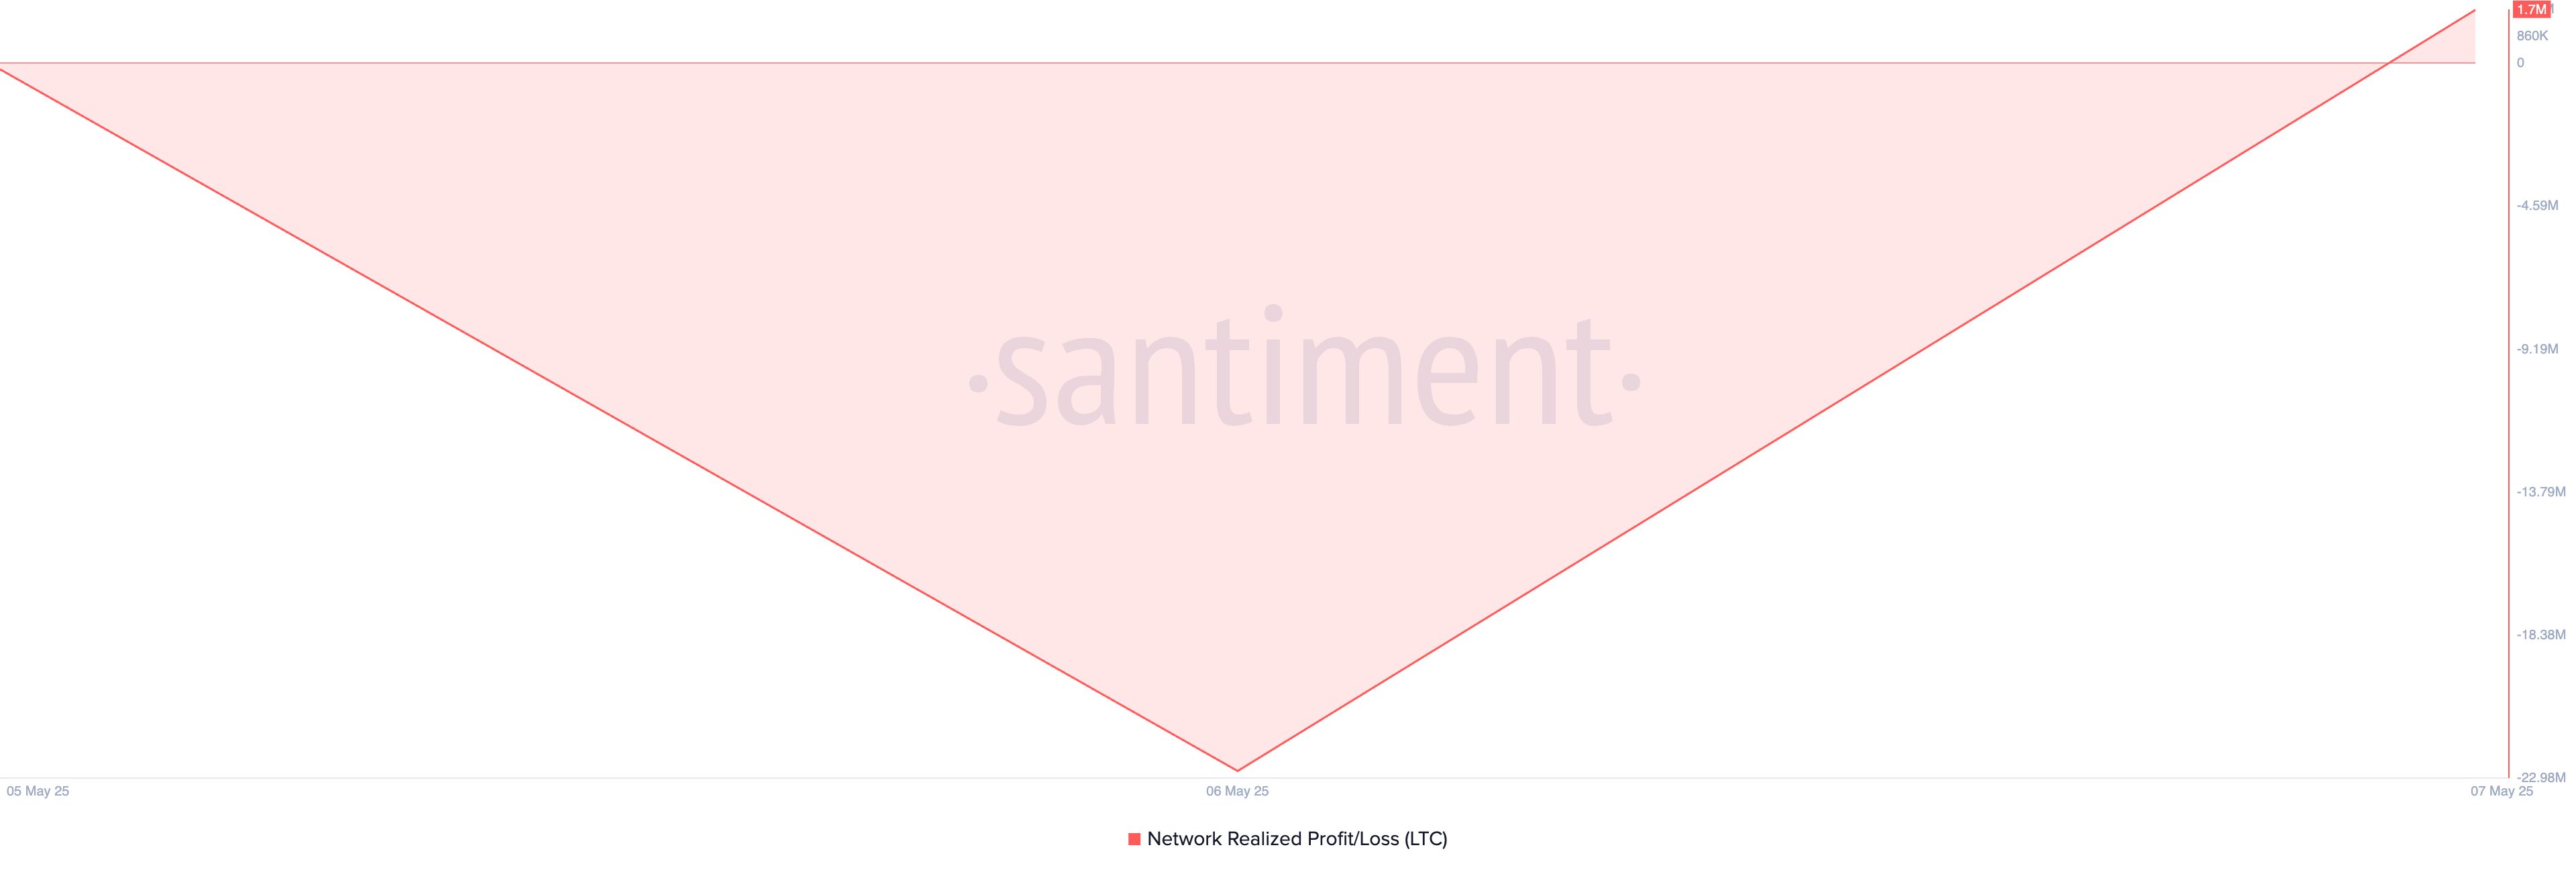
Moreover, on-chain readings show that LTC’s Network Realized Profit/Loss (NPL) is rising, indicating that coin holders are sitting on unrealized gains and may be tempted to sell. At press time, the NPL sits at 1.7 million.
This metric reflects the net profit or loss of all coins moved on-chain, based on the price at which they were last moved. A rising NPL suggests increasing profitability across the network.
This, in combination with LTC’s weakening buy pressure as reflected by its CMF, heightens the risk of short-term selling pressure as traders look to lock in profits.
Can Litecoin Hold Its Gains?
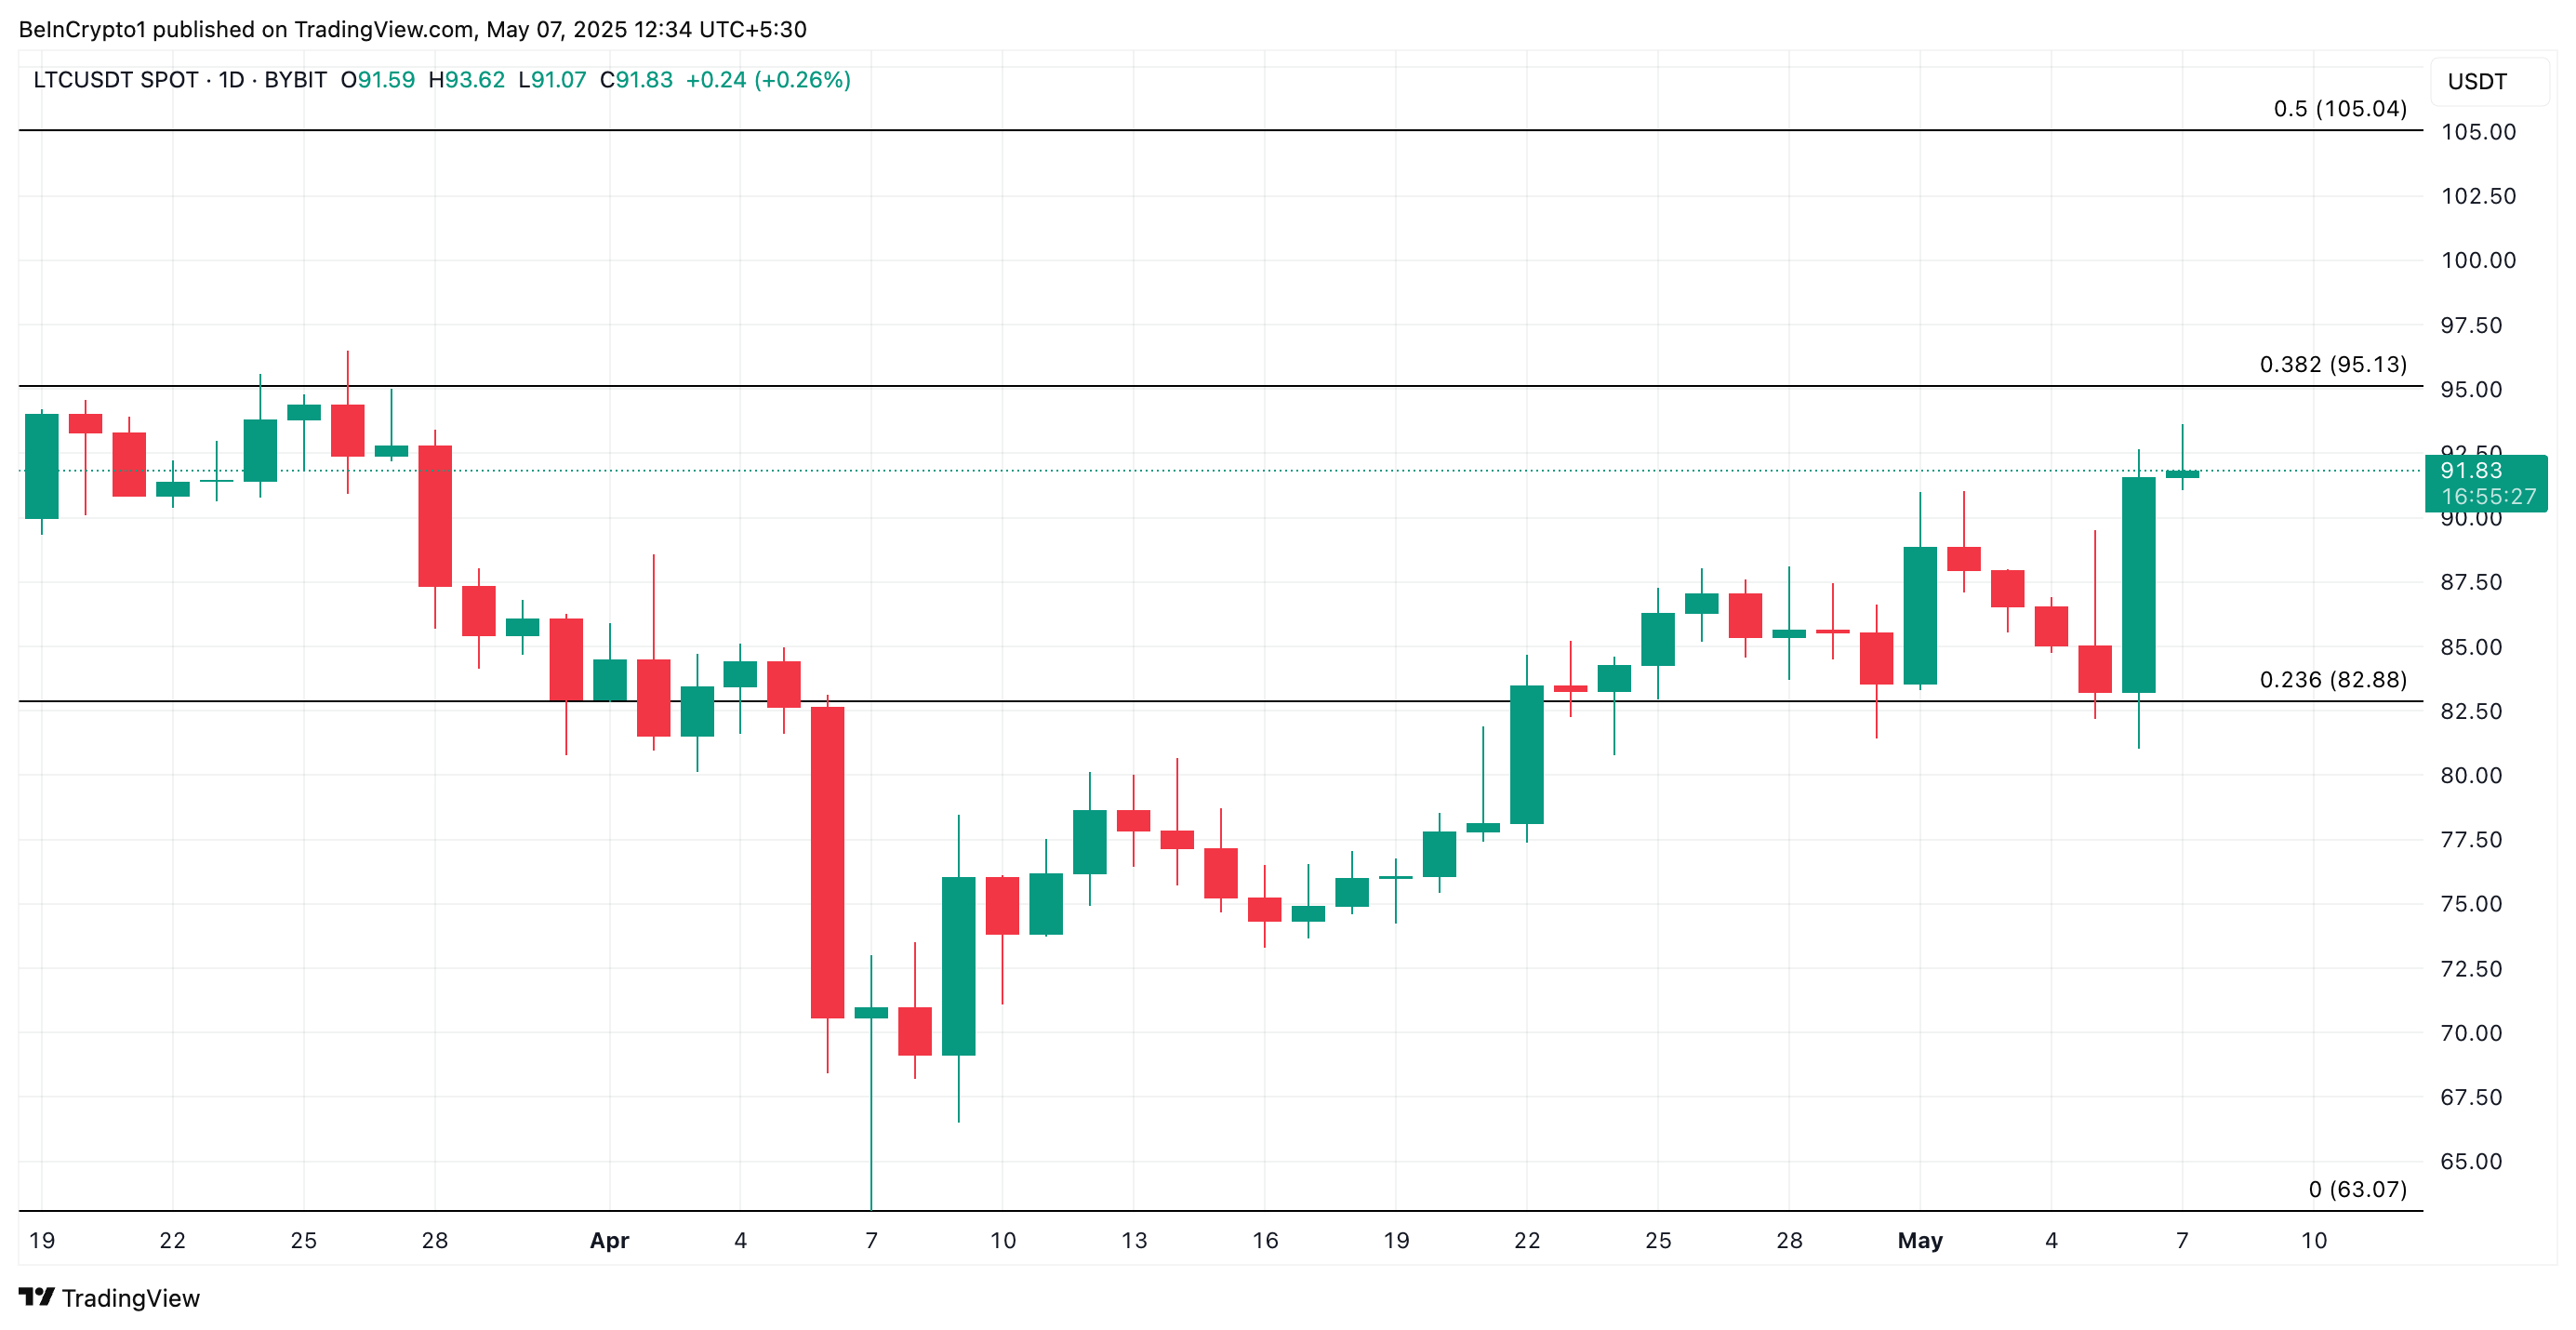
With strengthening bearish pressure, LTC buyers risk facing exhaustion soon. If new demand fails to come into the spot markets to support the LTC token rally, it could lose its current gains and fall to $82.88.
However, a bullish shift in market sentiment could prevent this. If buying activity soars, it could drive LTC’s price to $95.13. A breach of this resistance could catapult the altcoin toward $105.04.
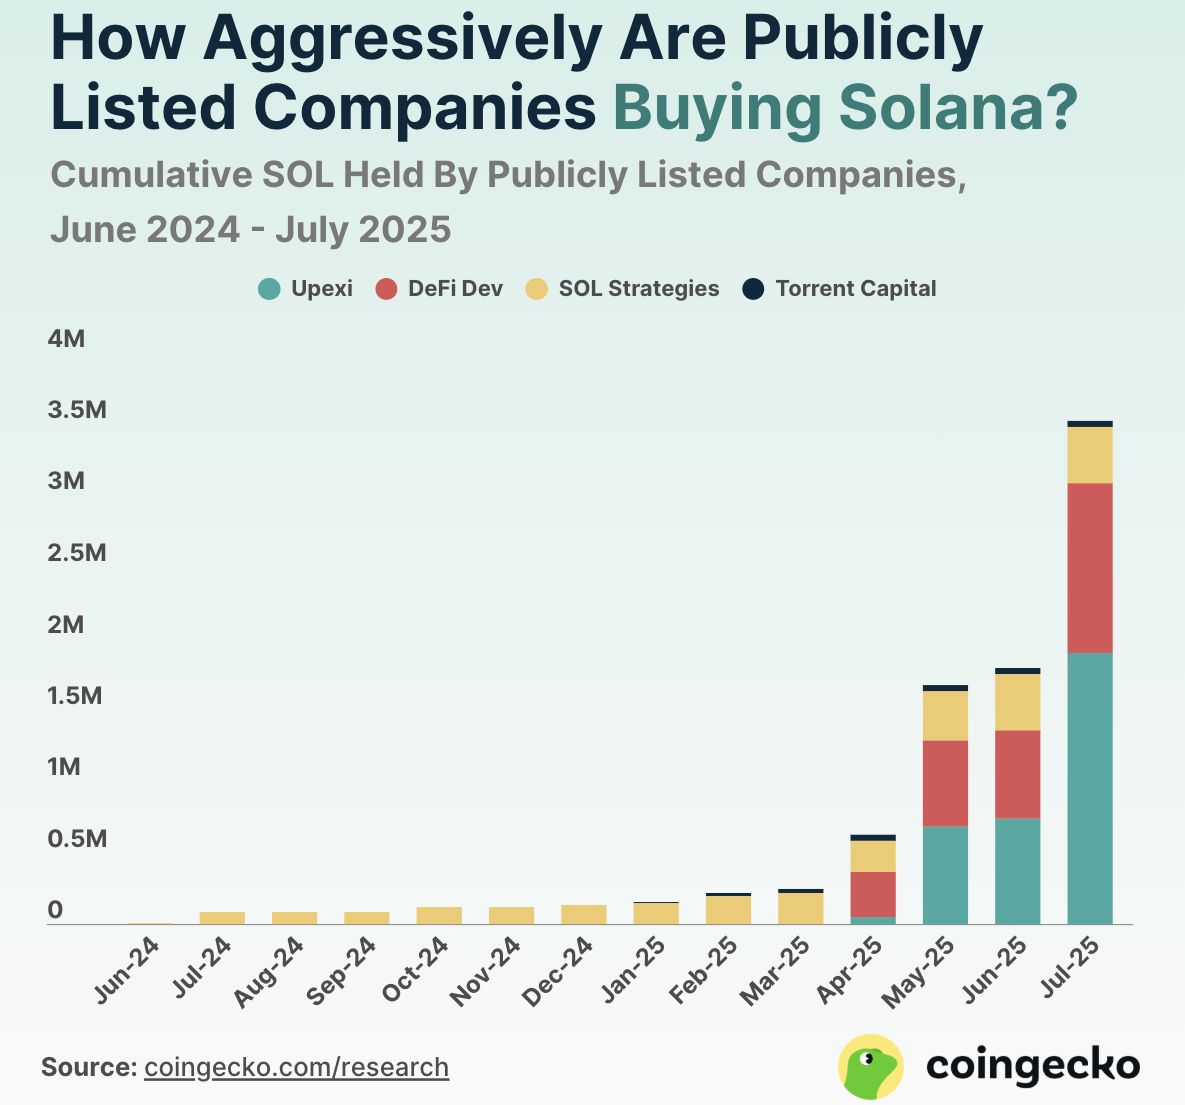
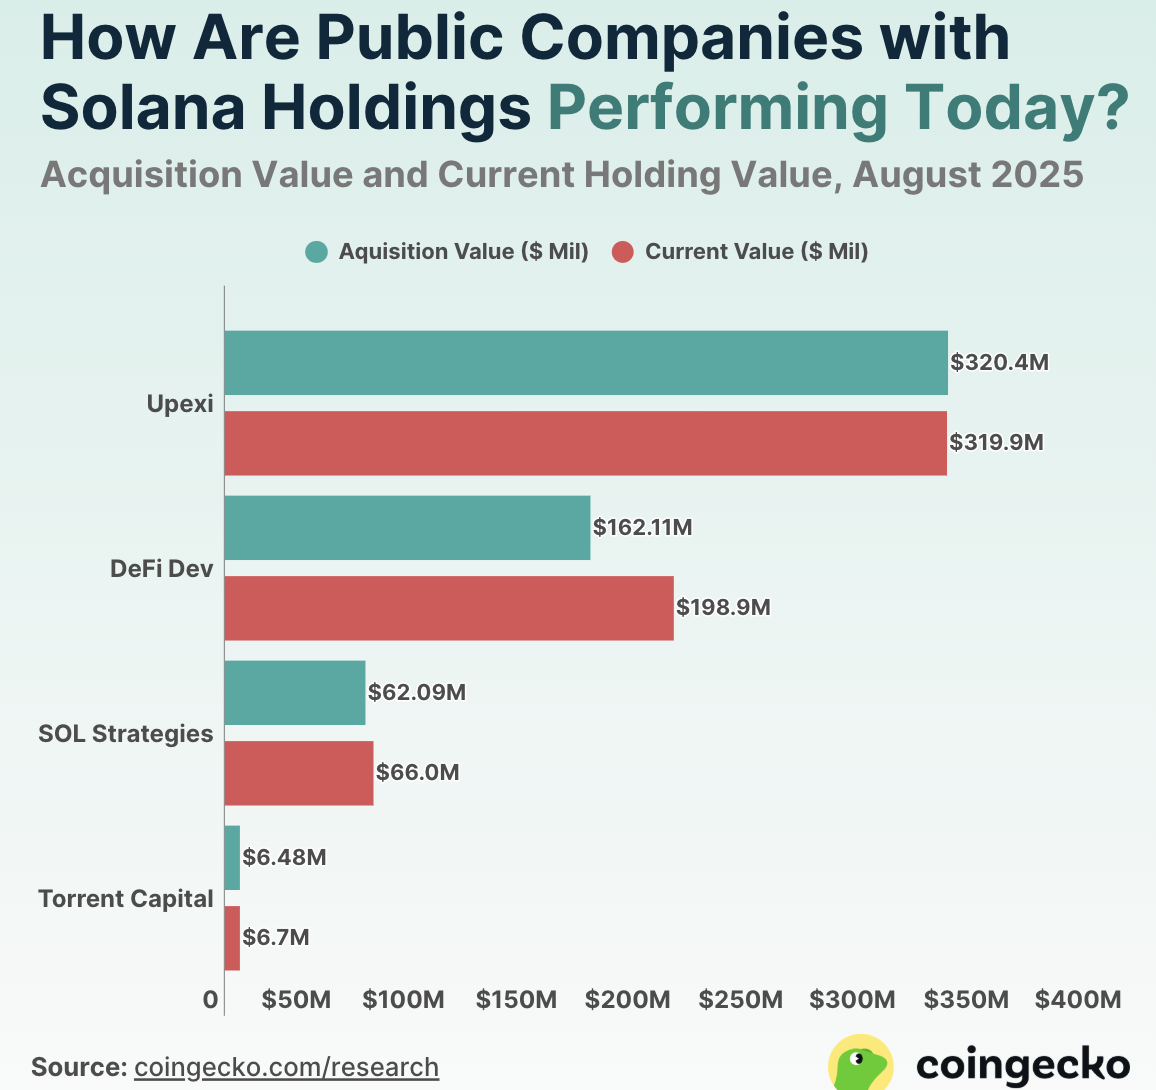
CoinGecko released a report on Solana treasury firms, yielding several important insights. The sector is much less crowded than corporate Bitcoin and Ethereum investors, but interest is rapidly growing.
However, Solana’s price has been more volatile. In July, its largest corporate holder lost $.09 million on this investment. So far, a handful of companies have exhibited a race to outdo each other, establishing a firm head start.
As this data shows, newcomers have repeatedly disrupted this market sector. SOL Strategies is by far the oldest player in this space, making substantial investments before this tactic was on anyone’s radar.
Meanwhile, Upexi started small with its own Solana treasury, but supercharged its spending in July. The firm currently holds 1.9 million SOL, towering above DeFi Development’s 1.1 million.
Solana’s Volatility Remains a Challenge
Clearly, the Solana treasury market is defined by fierce competition, but it remains quite small. There are only four serious stockpilers, and Torrent Capital holds only 40,000 SOL.
So far, Upexi’s aggressive expansions have come at a cost. By stockpiling so much Solana directly before a downturn, the firm actually lost around $0.9 million.
The past week saw a brief rebound across the crypto market, following reports of a ceasefire agreement between Israel and Iran.
This development injected renewed optimism into risk markets, leading to a short-lived recovery that might extend into the first week of July. With the broader market sentiment bullish today, some altcoins are poised to keep climbing.
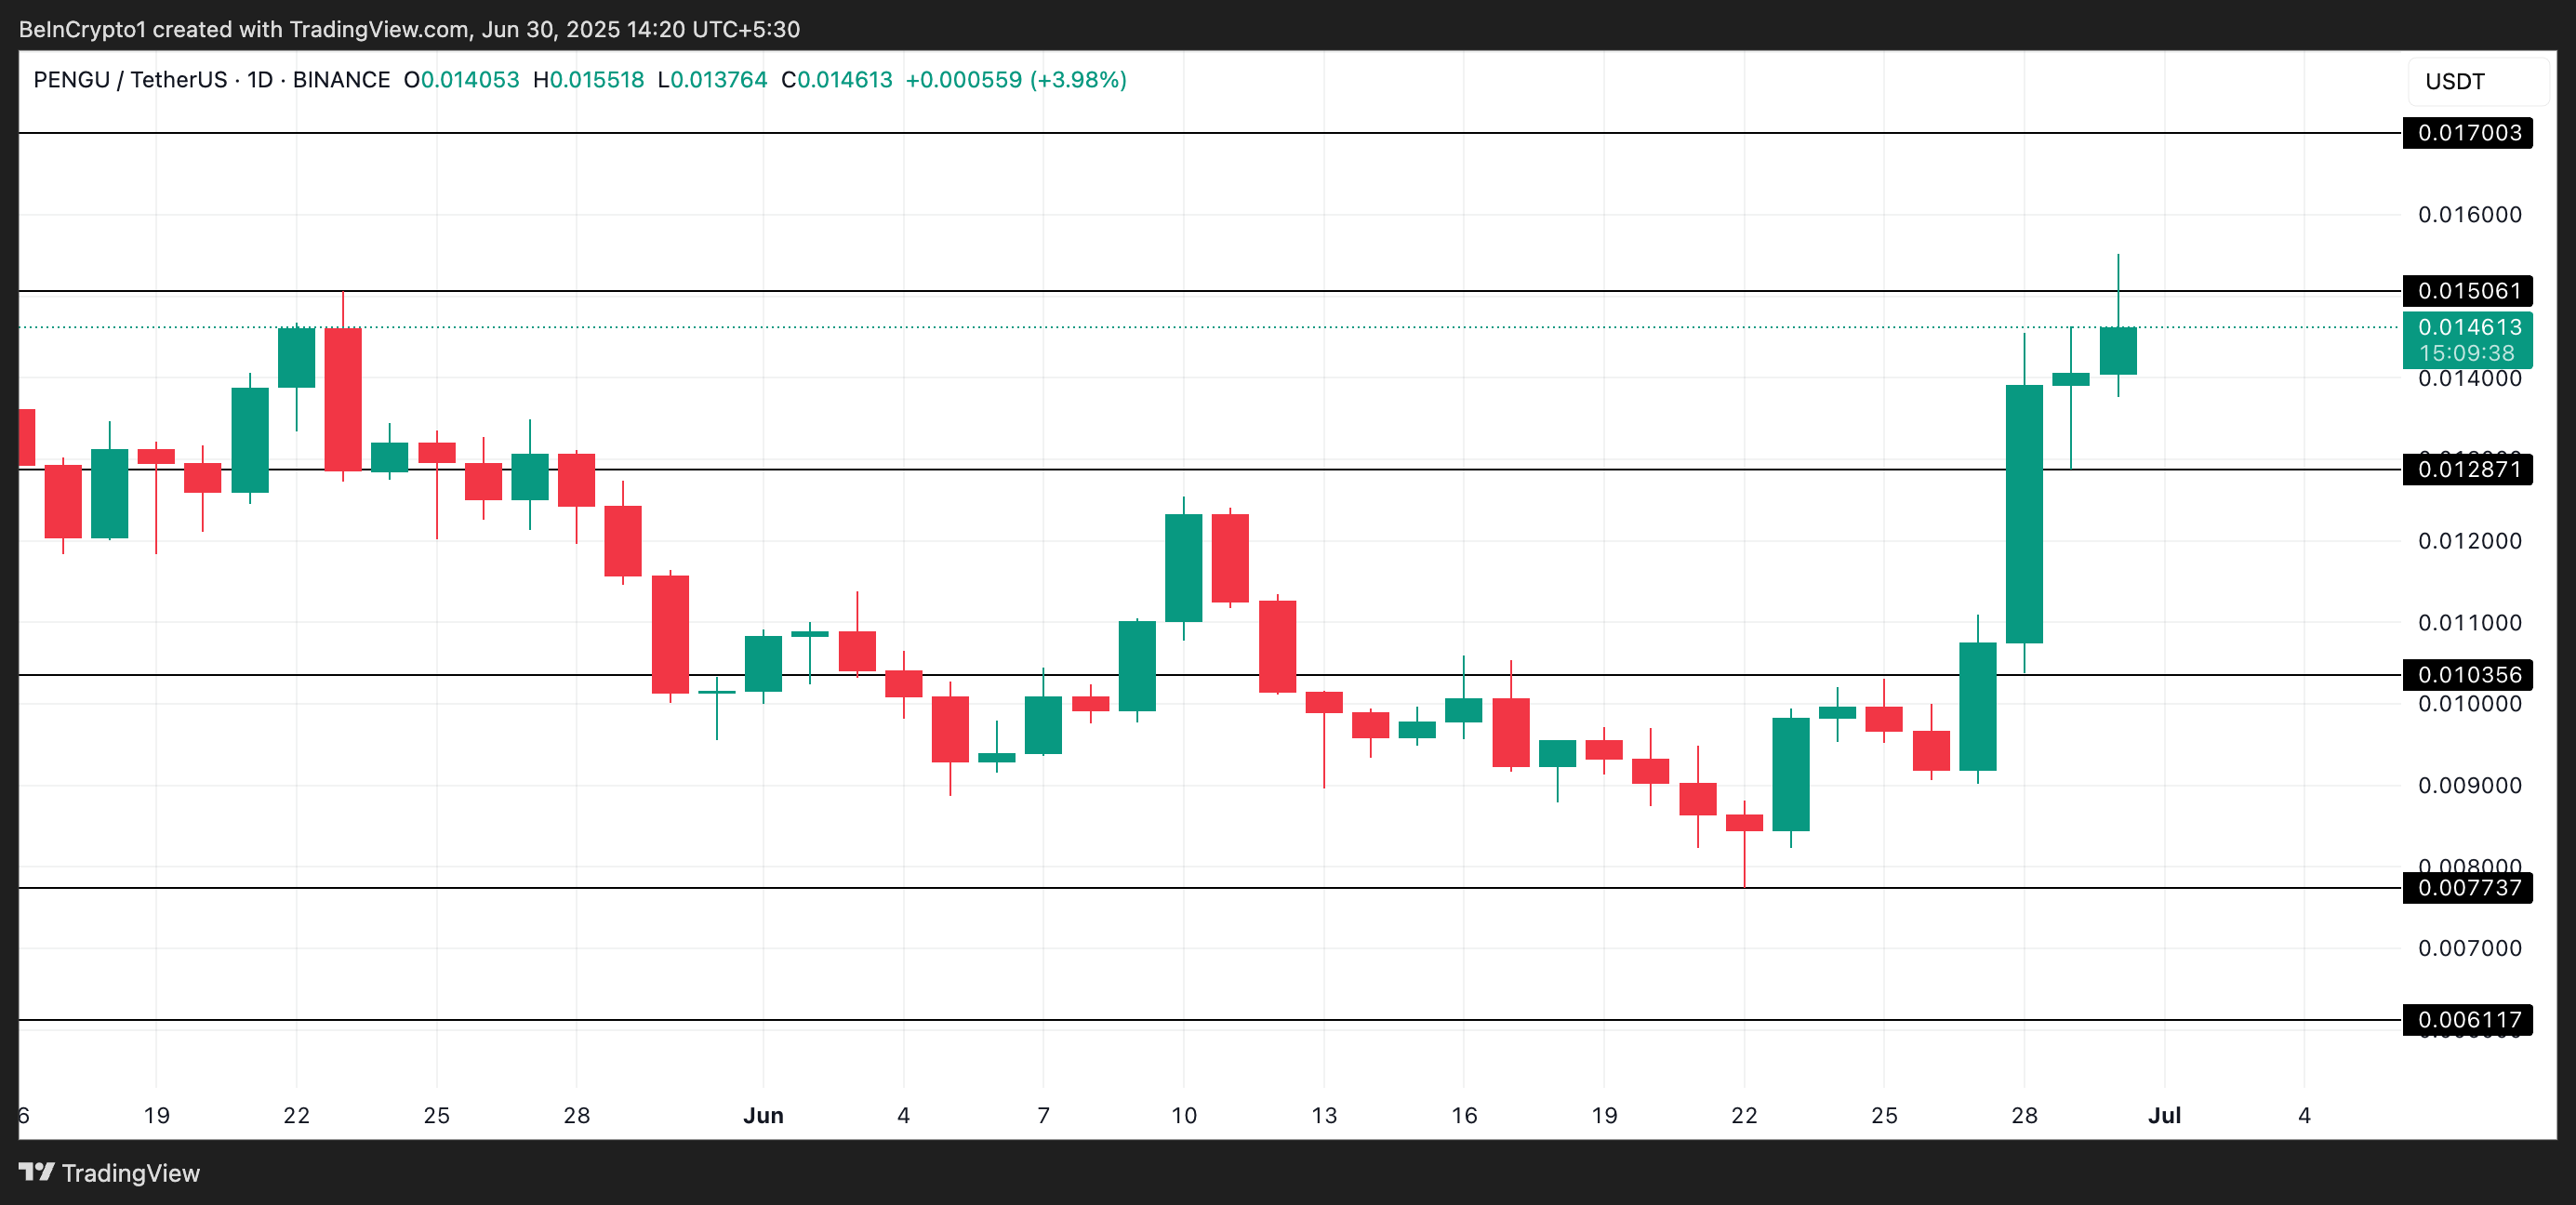
Pudgy Penguins (PENGU)
PENGU is up 70% over the past week and currently trades at $0.014. During Monday’s early Asian trading session, the altcoin surged to a 47-day high of $0.0155 as demand soared.
Apart from improvements in the broader market’s sentiment, PENGU’s rally is driven by the climbing demand for Pudgy Penguins’ non-fungible tokens (NFTs). According to CryptoSlam, the collection recorded $1.44 million in sales over the past seven days, representing a 34% increase compared to the previous week.
The surge in trading activity was not limited to volume alone. The number of sales transactions also climbed to 63 during the same period, marking a 31% uptick week-over-week.
If this demand rises, PENGU could see a demand spike pushing its price to $0.015. A breach of this resistance could propel the altcoin to $0.017.
On the other hand, if demand falls, PENGU could fall to $0.012
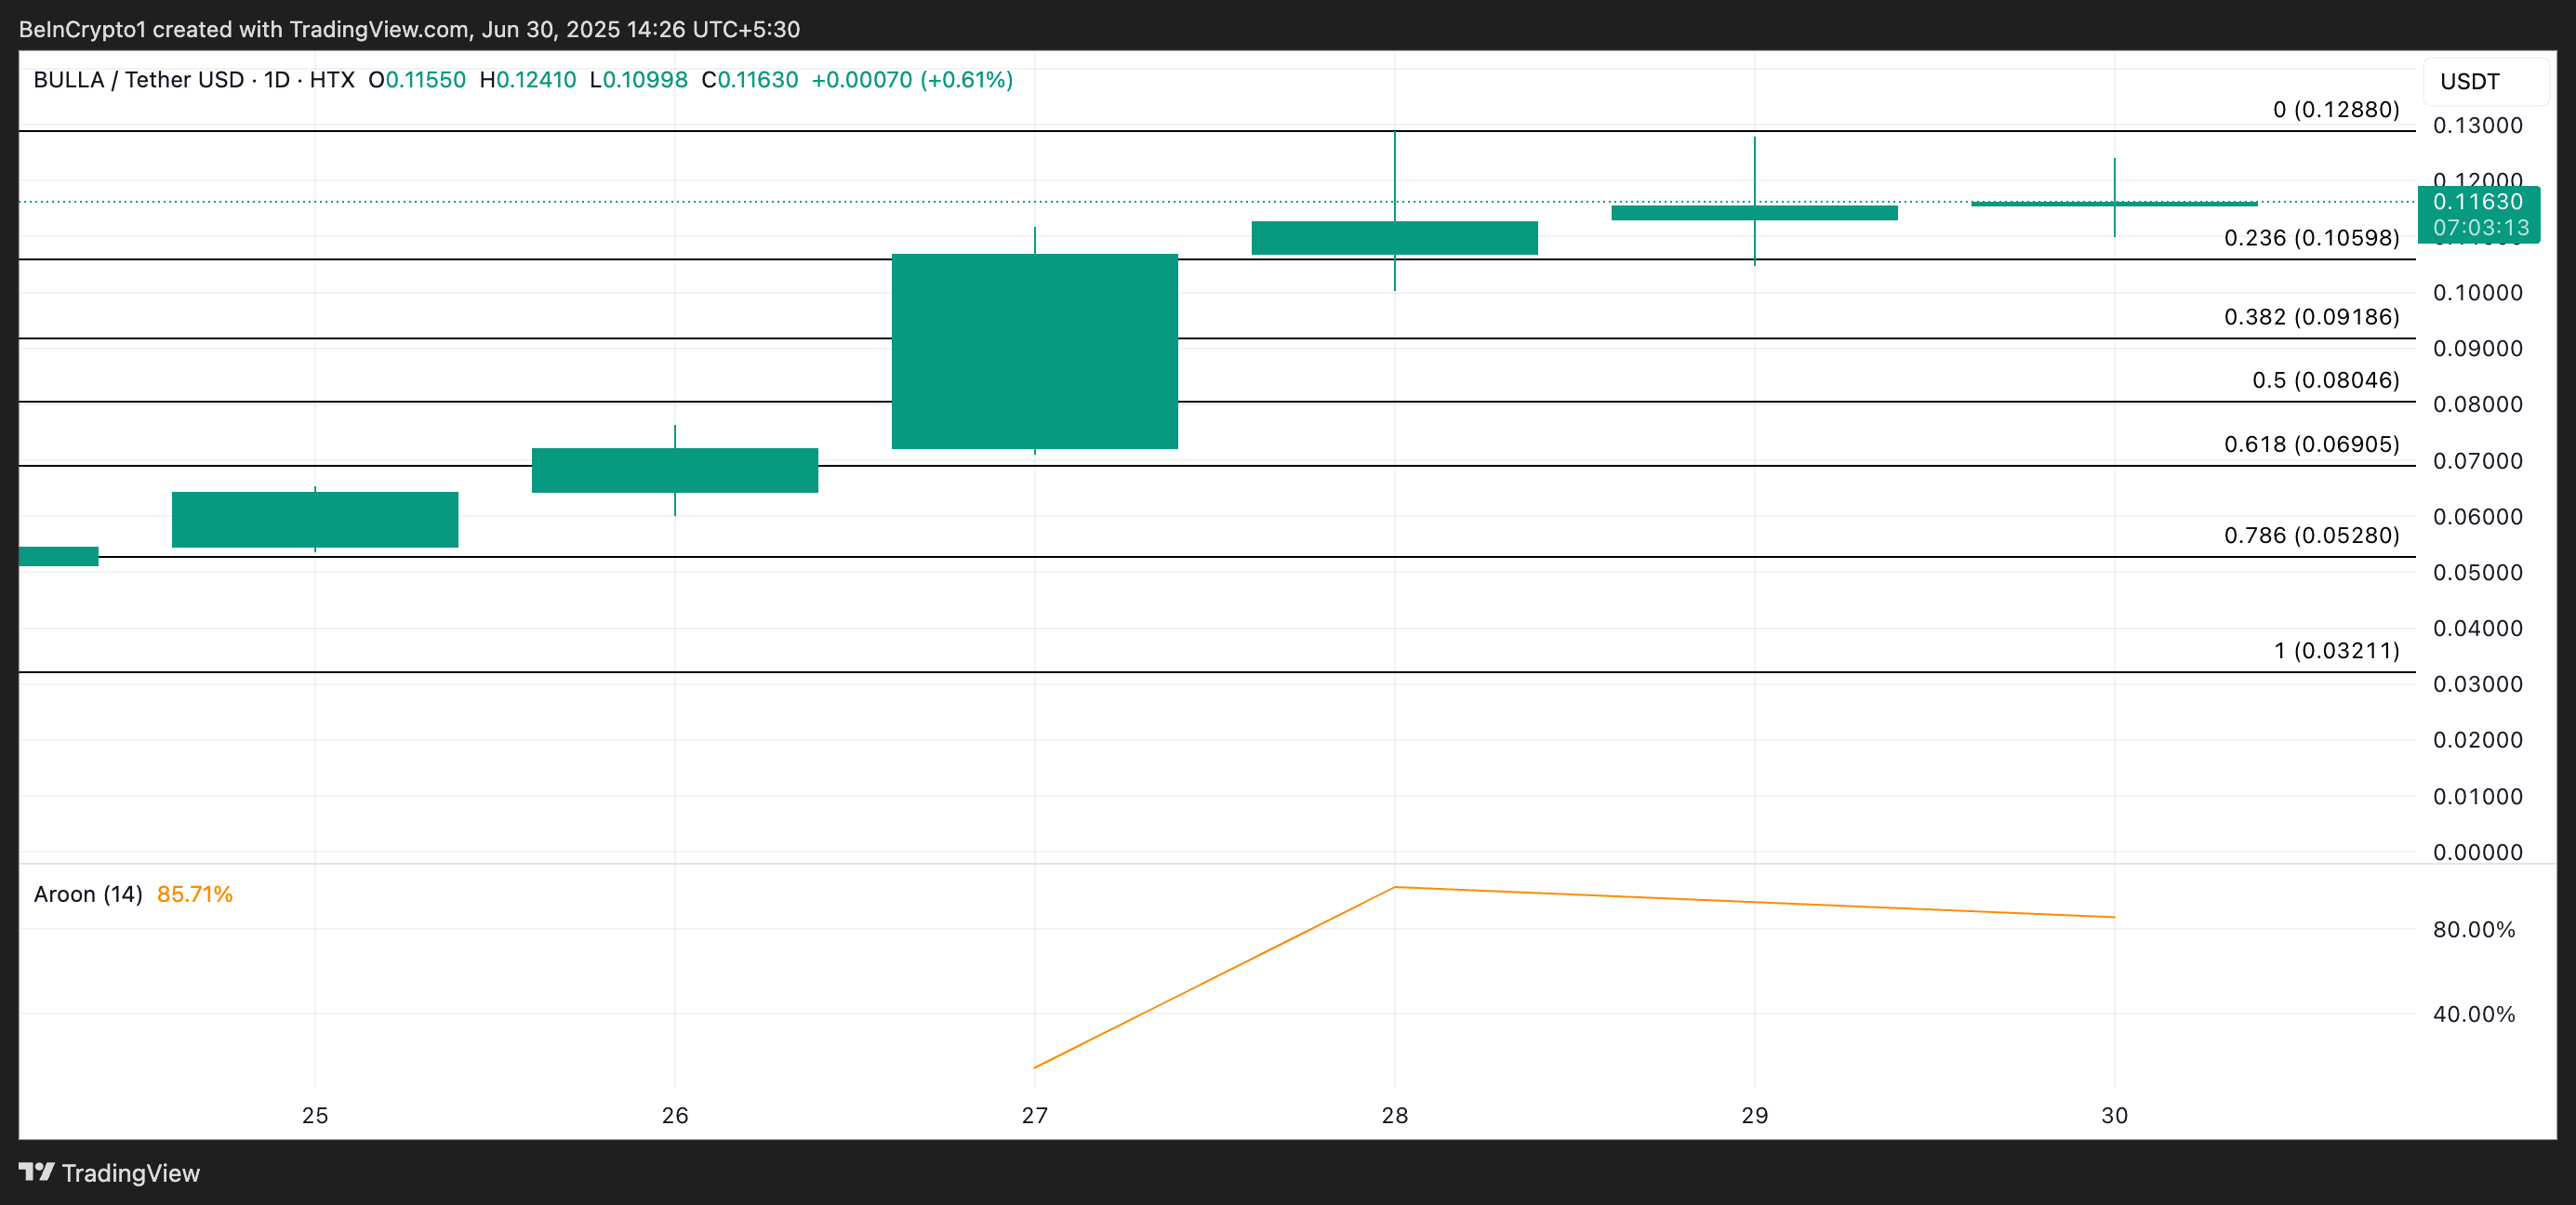
BULLA
Described as “the king of memes and the official mascot of the bull market,” BULLA is another top Coingecko gainer to pay attention to in the first week of July. As of this writing, it trades at $0.1173, climbing by 178% over the past week.
On the BULLA/USD one-day chart, the token’s Aroon Up Line is at 85.71%, confirming the rally’s strength. The Aroon indicator measures the strength and direction of a trend. It comprises two lines: Aroon Up, which tracks bullish momentum, and Aroon Down, which tracks bearish pressure.
When an asset’s Aroon Up line is at or close to 100%, it has recently hit a new high, signaling strong upward momentum and a dominant bullish trend.
If demand remains high, BULLA’s price could revisit its all-time high of $0.128.
On the other hand, if demand falls, the token’s price could fall to $0.105
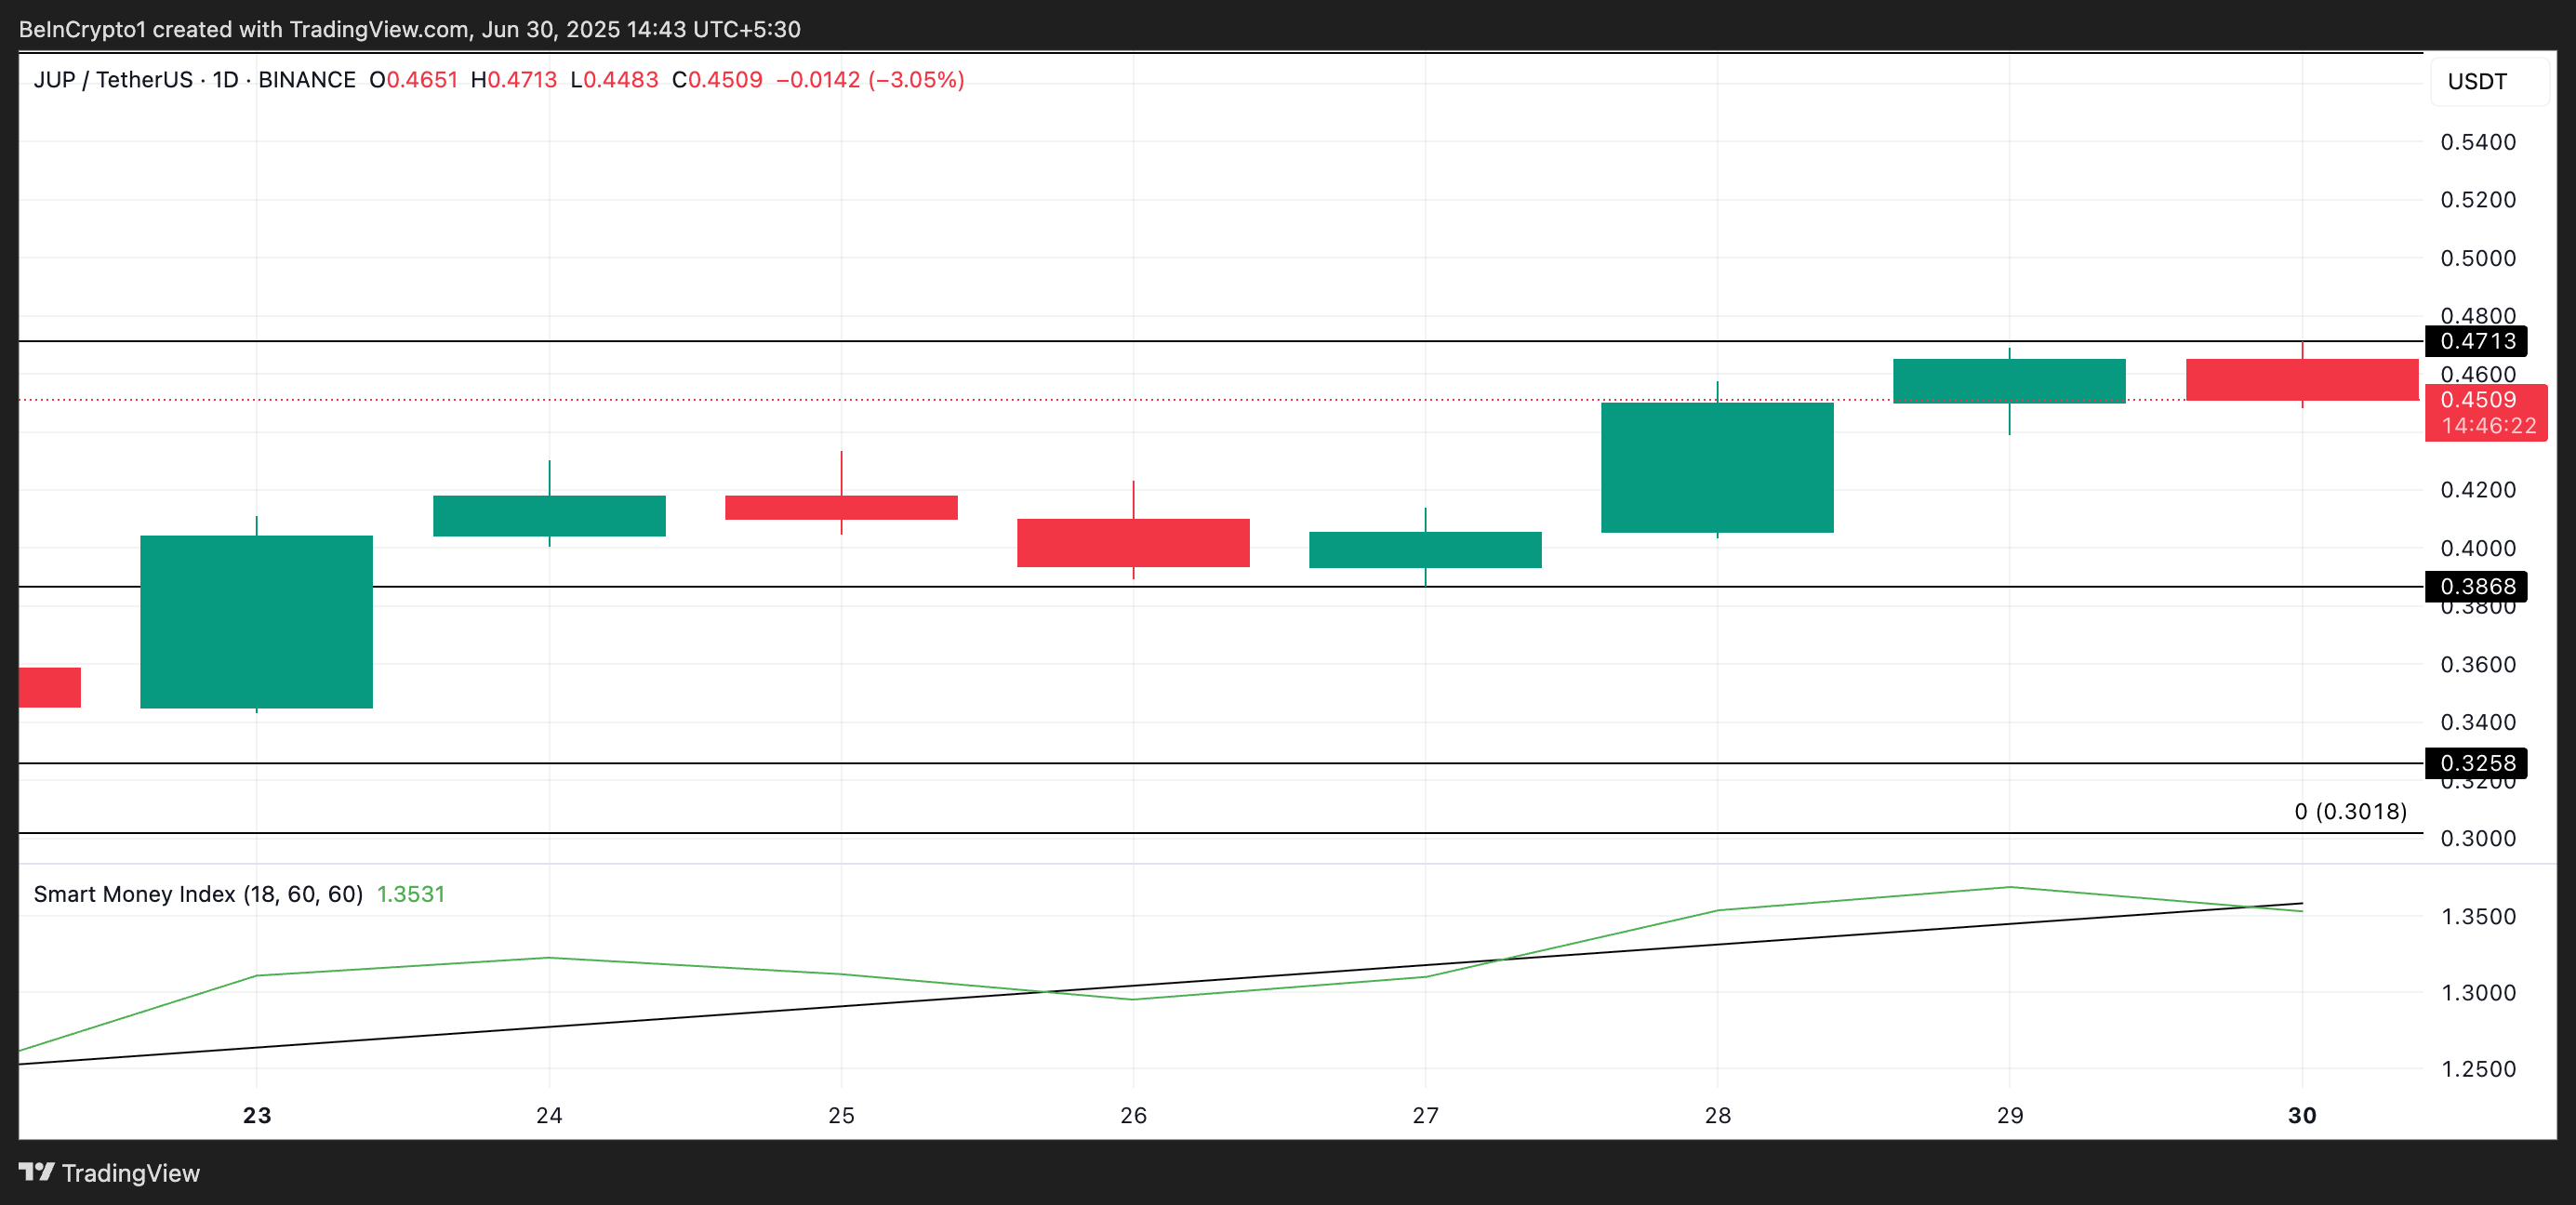
Jupiter (JUP)
JUP, the native token of the Solana-based decentralized exchange (DEX) Jupiter, is one of Coingecko’s top-performing assets to watch this week. It is up 29% during the review period, exchanging hands at $0.44 at press time.
Readings from the JUP/USD one-day chart show a steady rise in the token’s Smart Money Index in the past seven days, highlighting increased demand from key token holders. This is currently at 1.35, climbing 8% in the past week.
An asset’s SMI tracks the activity of experienced or institutional investors by analyzing market behavior during the first and last hours of trading.
When it drops, it suggests selling activity from these holders, pointing to expectations of price declines.
Conversely, as with JUP, when the indicator rises, it indicates increased buying activity, signaling growing confidence in the asset.
If demand continues to increase, JUP’s price could break above $0.47.
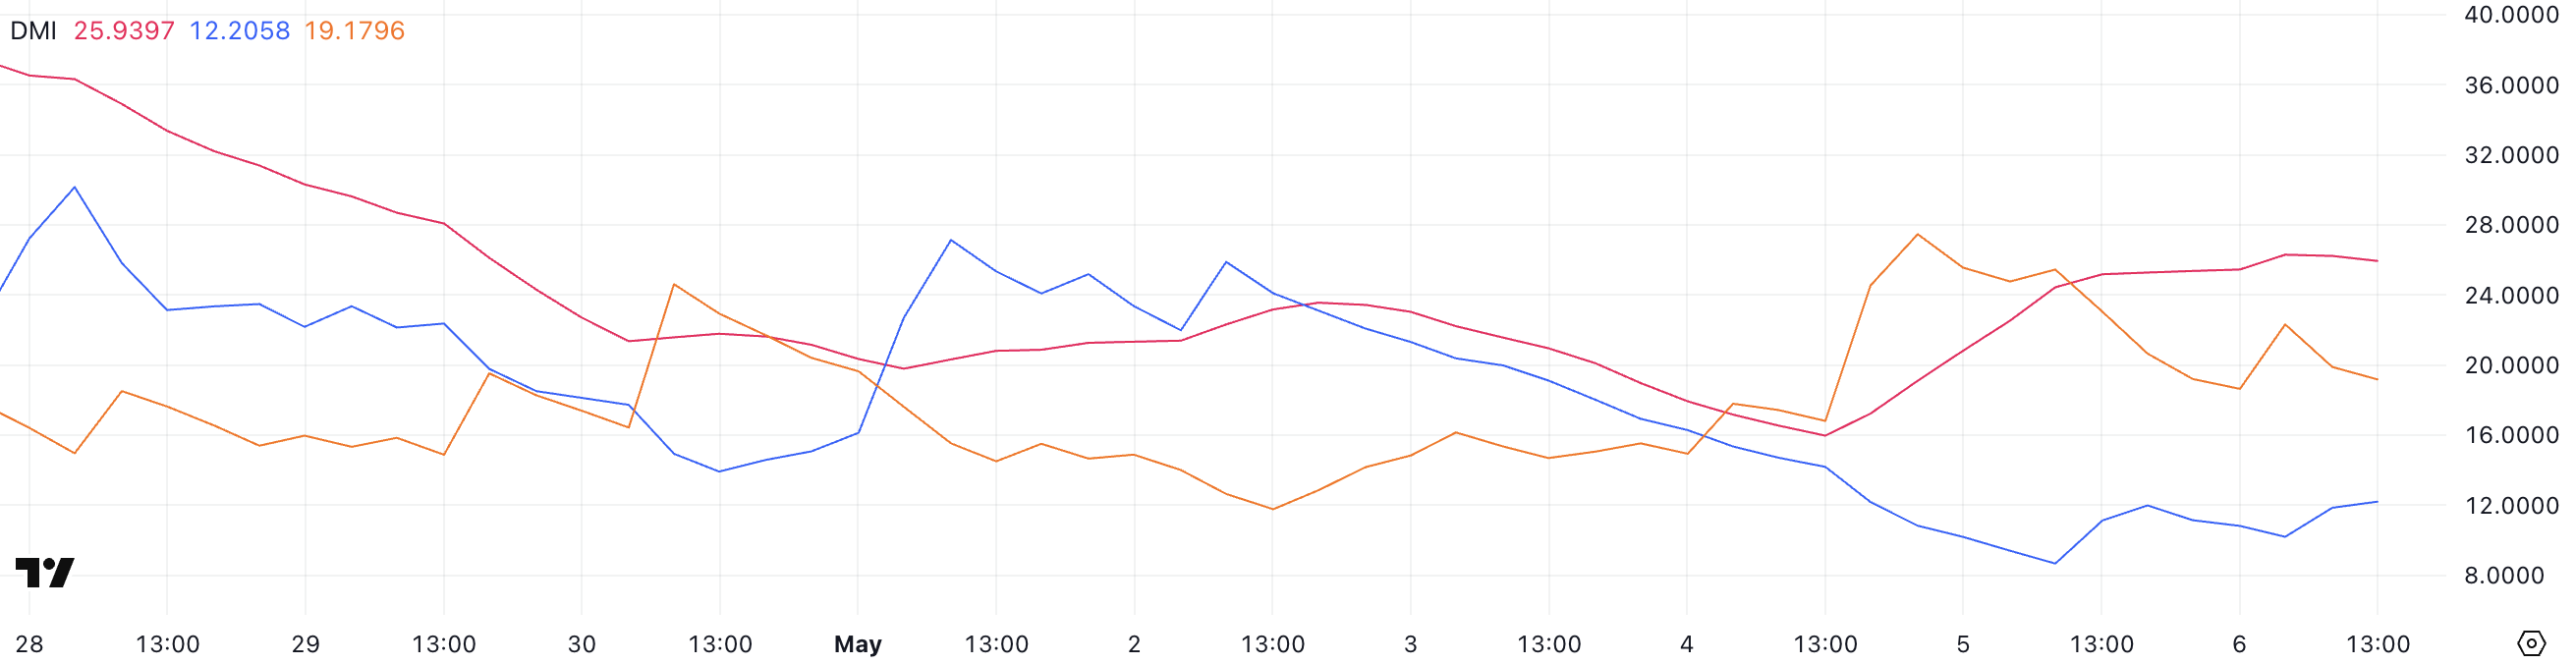
Bitcoin (BTC) enters the second week of May trading in a fragile but critical zone, with conflicting technical signals and growing macro uncertainty shaping short-term expectations. While the ADX from the Directional Movement Index is rising, bearish pressure still dominates, and momentum remains weak across multiple indicators.
Although the price continues to hold above the $92,900 support level, weakening EMAs and the looming FOMC meeting leave Bitcoin’s $100,000 recovery path uncertain, but not out of reach.
BTC Trend Strength Rises, but Bears Still in Control
Bitcoin’s Directional Movement Index (DMI) is showing a notable shift.
The ADX, which measures the strength of a trend regardless of direction, has climbed sharply to 25.93, up from 15.97 just two days ago—crossing the key 25 threshold that signals a trend is starting to gain traction.
This rising ADX suggests that volatility is returning and a new directional move may be forming, even if the direction itself is still unclear.
Looking at the components of the DMI, +DI (bullish strength) has bounced to 12.2, up slightly from yesterday’s low of 8.67 but still down significantly from 21.31 three days ago.
Meanwhile, -DI (bearish strength) is at 19.17, slightly off its peak of 25.44 but still higher than three days ago. This indicates that although the recent bearish momentum has cooled somewhat, sellers still have the upper hand.
With ADX rising and -DI leading, Bitcoin could remain under pressure unless +DI recovers sharply in the coming days.
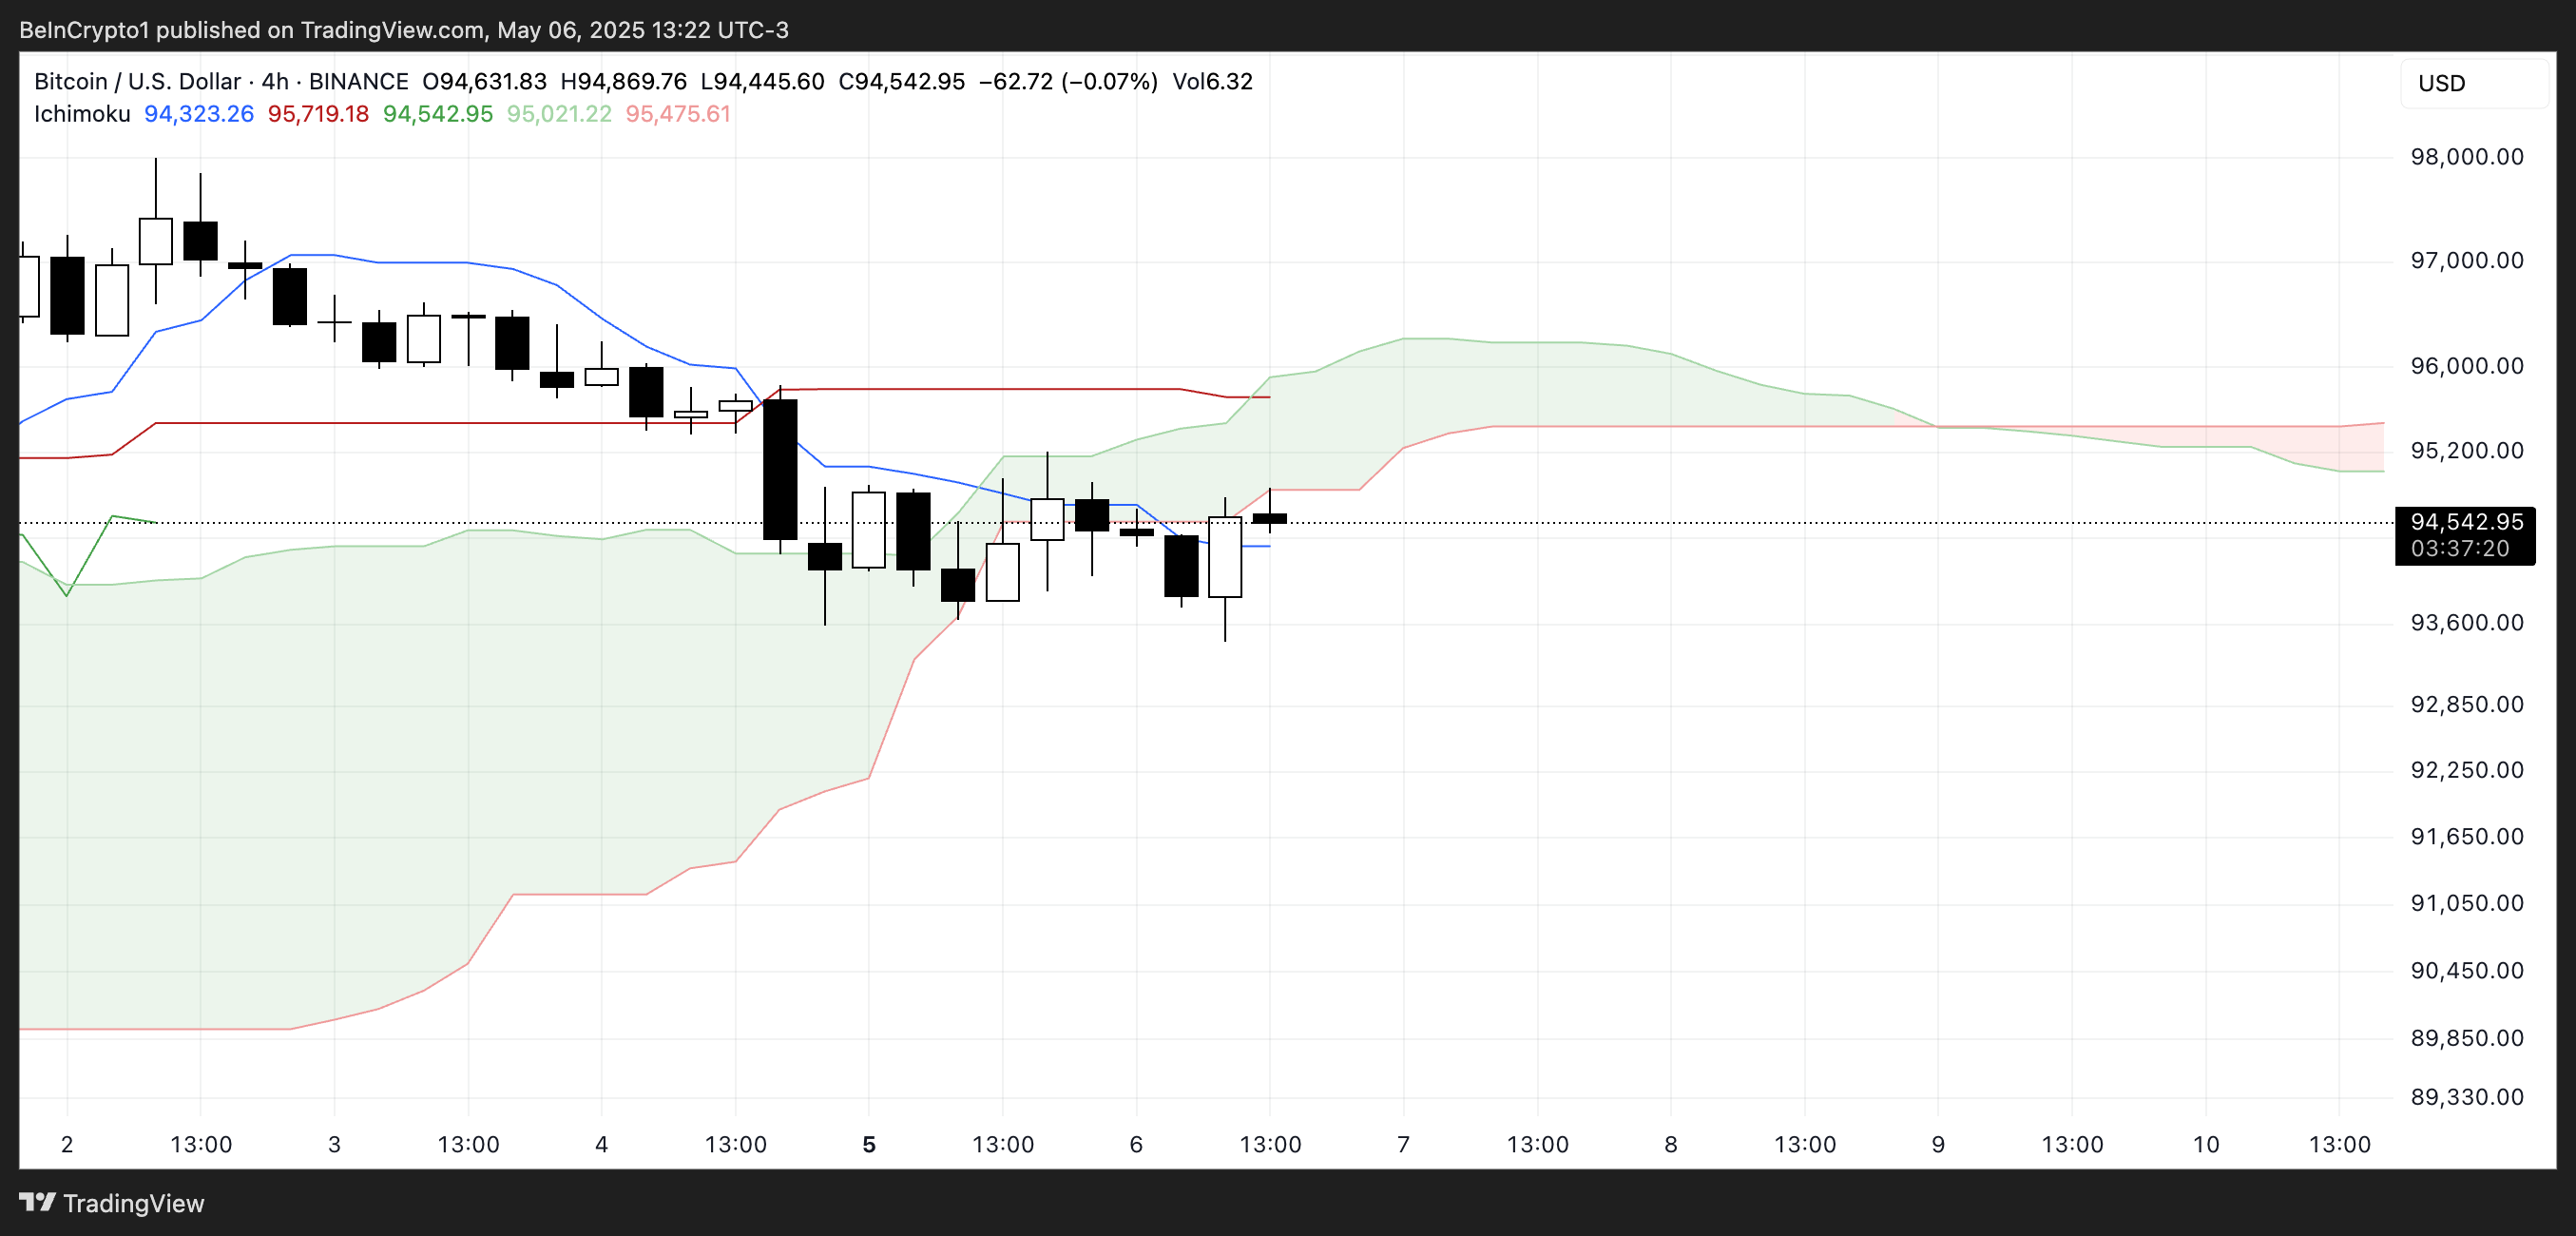
Bitcoin Trapped Below the Cloud as Momentum Stalls
The current Ichimoku Cloud chart for Bitcoin reflects a market in consolidation, with a slight bearish undertone. Price action is sitting very close to the blue Kijun-sen (baseline), which typically represents medium-term trend momentum.
Trading beneath this line suggests that BTC lacks the strength to reclaim bullish momentum in the short term. The white candlesticks hovering near the cloud’s lower boundary indicate indecision among traders, with no clear breakout in sight.
The green Kumo (cloud) itself is relatively thin at this stage, hinting at a fragile support zone that could easily be broken if bearish pressure returns.
Looking ahead, the red Senkou Span B—the top of the projected cloud—is acting as dynamic resistance, capping any upward attempts. For a stronger bullish signal, BTC would need to close decisively above both the Kijun-sen and the entire cloud.
Complicating matters further, the Tenkan-sen (conversion line) is flat and overlapping with the Kijun-sen, signaling weak momentum and a lack of direction. Flat Tenkan and Kijun lines often precede sideways movement or delayed trend development.
Until Bitcoin breaks convincingly above the cloud with rising volume, the current setup leans neutral to bearish, with price trapped in a zone of low conviction and limited momentum.
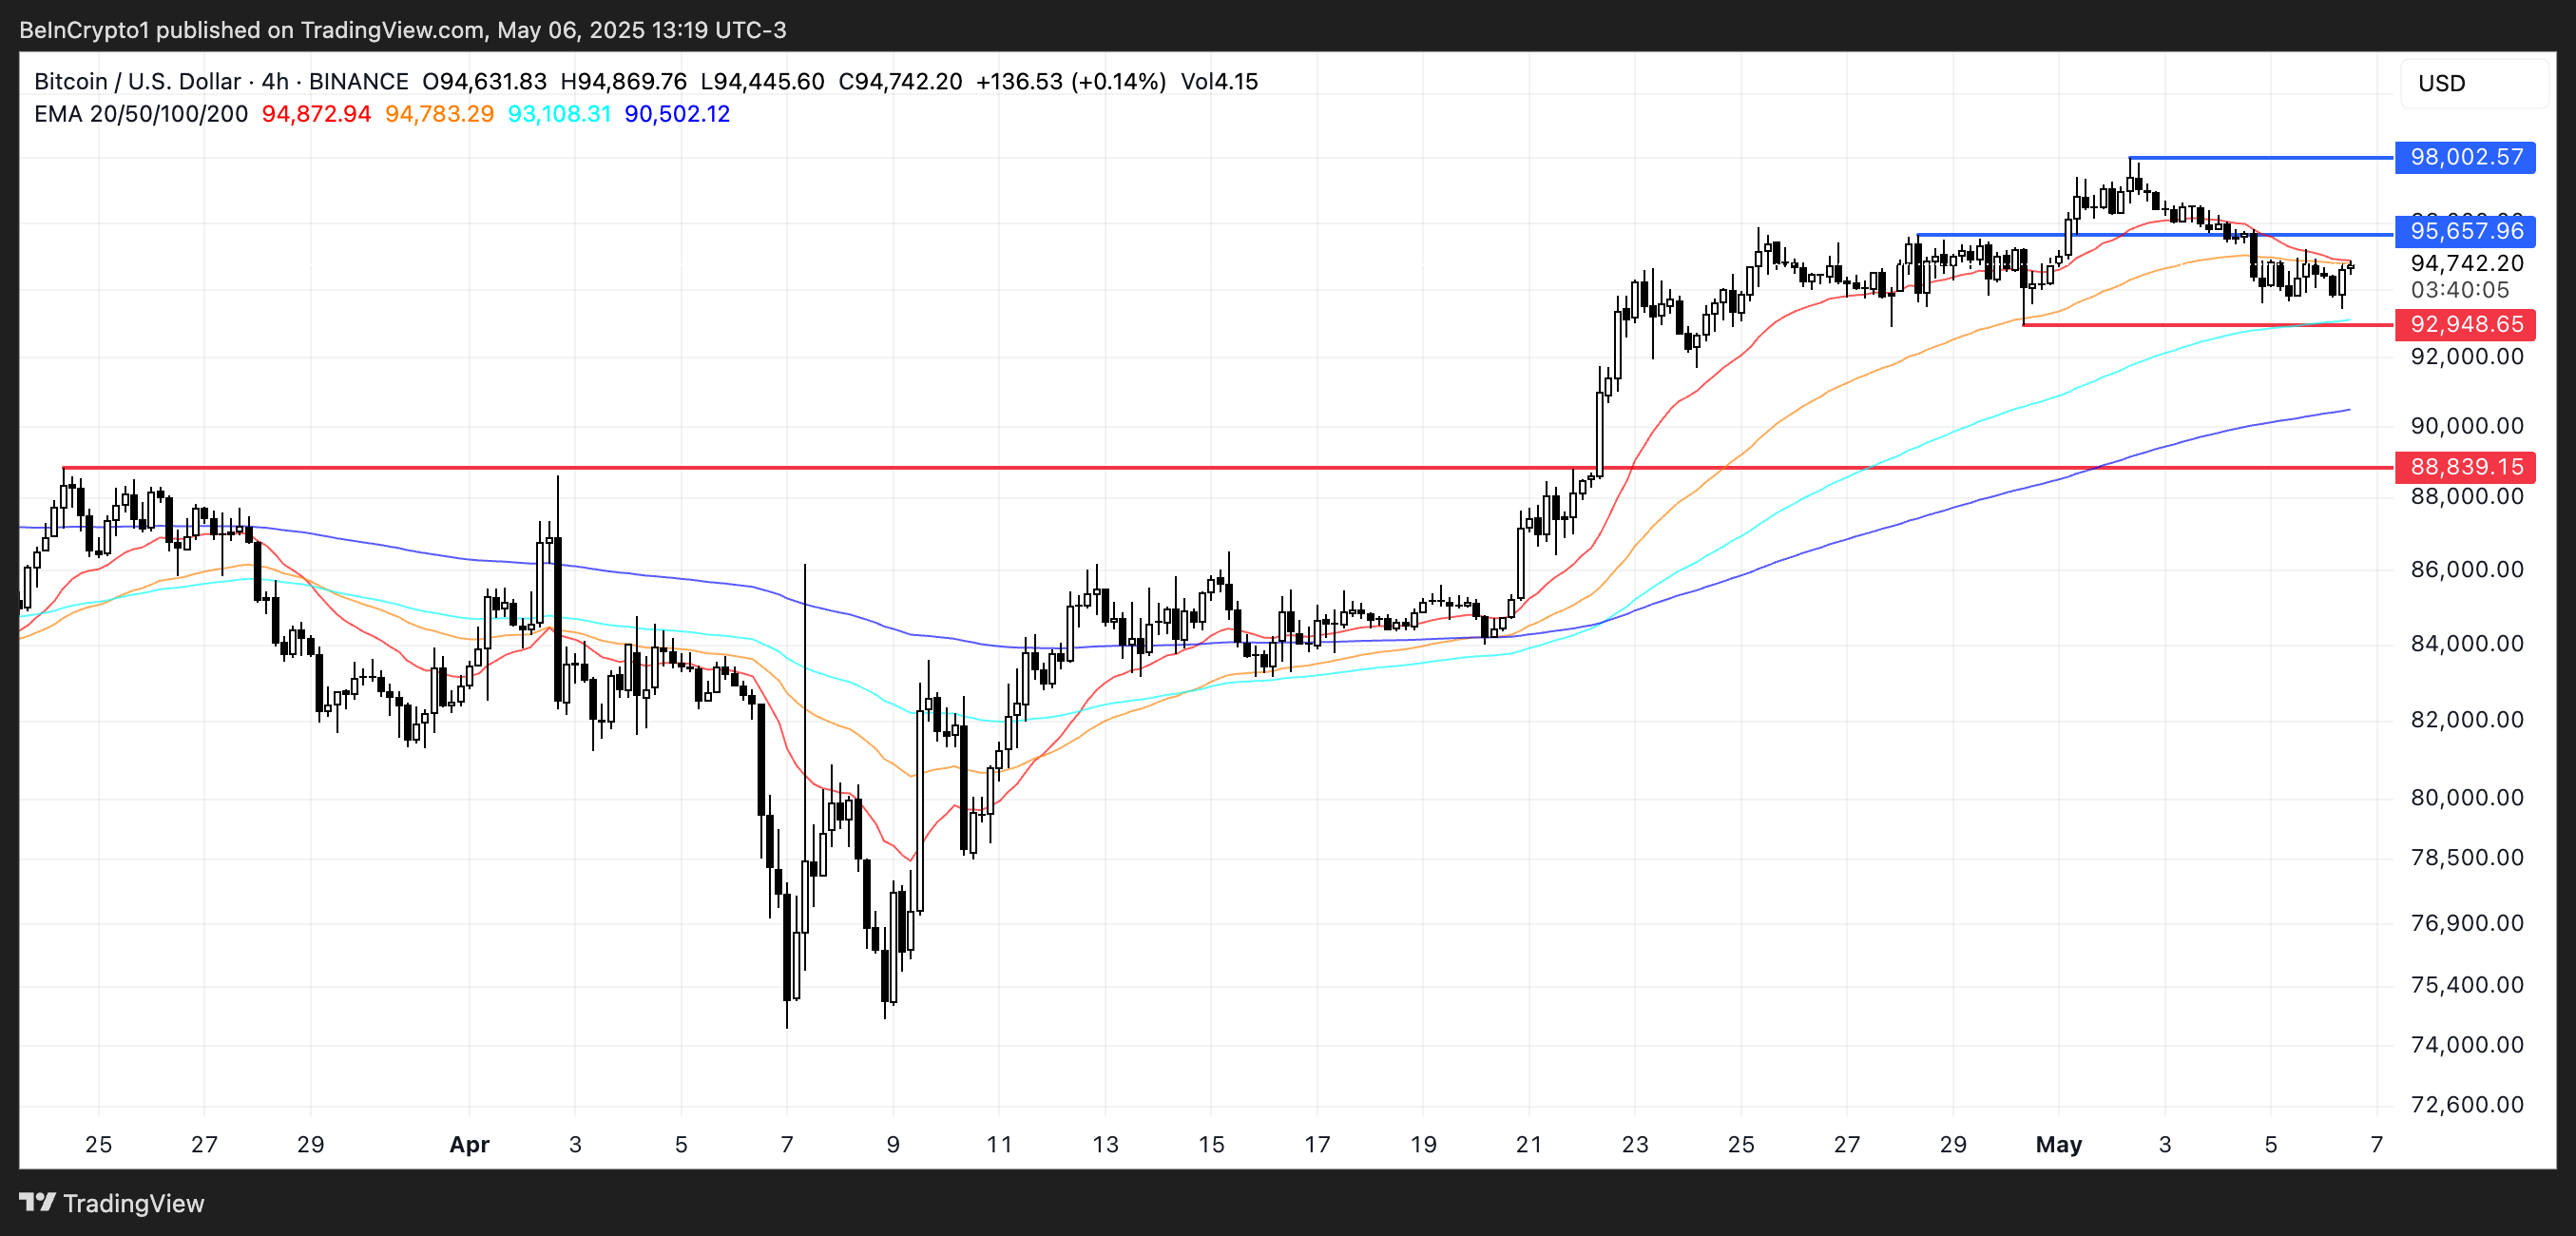
Bitcoin Holds Key Support as $100,000 Reclaim Hangs in the Balance
Bitcoin price has remained resilient above the $90,000 level since April 22, repeatedly holding support near $92,945 despite broader market uncertainty. The exponential moving averages (EMAs) still reflect a bullish structure, with short-term averages positioned above long-term ones.
However, there are early signs of weakening momentum, as the short-term EMAs have begun to slope downward—an indication that buyers may be losing strength soon.
If BTC fails to hold its key support, a drop toward $88,839 could follow, breaking the structure that has held for over two weeks.
Still, some analysts remain confident. Nick Purin, founder of The Coin Bureau, believes Bitcoin is well-positioned to reclaim the $100,000 mark, even as markets brace for volatility surrounding the upcoming FOMC meeting:
“It will be a volatile week. Firstly, we have the FOMC meeting tomorrow. While it’s pretty clear there will be no rate cuts, it’s what Chair Powell says that could move the markets. On top of that, trading volume is low and the long/short ratio is sitting at 50/50, which means that, yet again, BTC can swing in either direction from here. The good news is that there’s a great deal of buying interest around the $90,000-$93,000 range, so a dip to those levels is nothing to be concerned about – it will likely bounce back. And overall, the BTC/USD chart is looking strong as it continues to print higher lows.” – Purin told BeInCrypto.
Nick states how Fed next decisions could influence the market in the next months:
“If the Fed surprises with some dovish tones as well as guidance for rate cuts in June, there’s room for Bitcoin to rally all the way back up to that $100,000 level, which remains a liquidity magnet. But even if Powell strikes a hawkish tone, the impact on BTC will likely be minimal. There’s simply too much positive momentum – spot BTC ETFs are hoovering up assets, corporates are building up BTC treasuries and the correlation between Bitcoin and stocks is breaking down. On top of this, historic data shows that BTC has posted gains during nine out of the last 12 Mays. So, despite the likelihood of heightened volatility, the near future is looking promising. As such, following the old adage of ‘sell in May’ would be madness at this point.” – Purin told BeInCrypto.
A recovery in momentum could first drive BTC to retest resistance at $95,657, with a breakout potentially leading to $98,002 and eventually a challenge of the psychological $100,000 level.
With macro headwinds and technical crossroads converging this week, the next move will likely hinge on how BTC responds to its support zone and how broader market sentiment reacts to Fed commentary.