Bancor has filed a patent infringement lawsuit against Uniswap Labs and the Uniswap Foundation, raising concerns across the decentralized finance (DeFi) sector. Bancor Accuses Uniswap of Unauthorized Use of Technology Bancor’s nonprofit arm, Bprotocol Foundation, and LocalCoin Ltd. have jointly filed a lawsuit against Uniswap. The legal complaint was submitted to the U.S. District Court for the Southern District of New York. According to the filing, Uniswap Labs and the Foundation are accused of using Bancor’s patented constant product automated market maker (CPAMM) technology without permission. Bancor claims the technology was invented in 2016 and is central to how decentralized exchanges operate without centralized order books. The developers behind Bancor stated that they filed a U.S. provisional patent application in January 2017. The filing reportedly led to two granted patents covering the CPAMM structure, which Bancor says powers its automated token swaps onchain. This Is A Developing Story, Please Check… Read More at Coingape.com
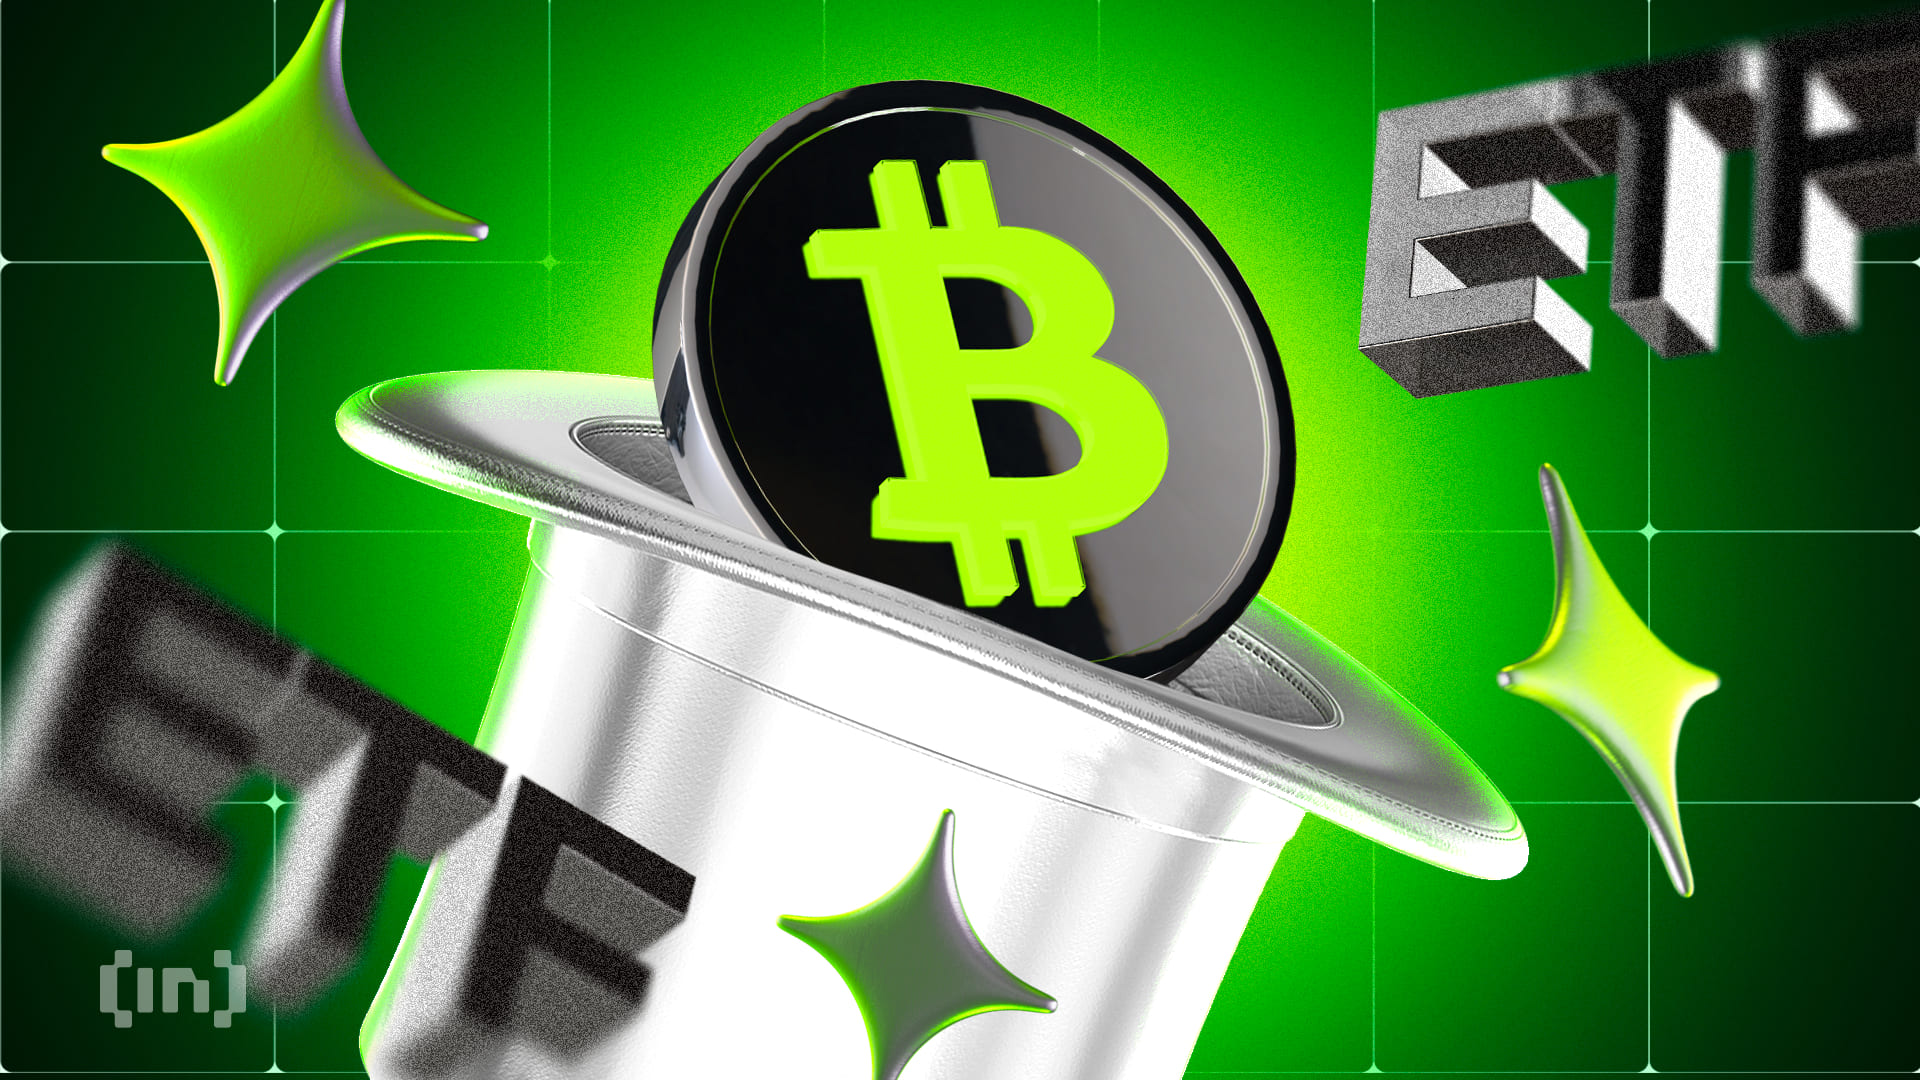
Yesterday, Bitcoin exchange-traded funds (ETFs) saw significant inflows, marking the third consecutive day of net positive flows.
With BTC now trading back above the $90,000 mark, signs point to renewed institutional interest, as major players appear to be piling back into the market after weeks of caution.
BTC ETF Inflows Jump 146% in a Day
On Wednesday, net inflows into US-based spot Bitcoin ETFs surged to $936.43 million, a 146% jump from the $381.40 million recorded the previous day.
Total Bitcoin Spot ETF Net Inflow. Source: SosoValue
This also represented the largest single-day inflow since January 17, signaling a notable resurgence in institutional demand for BTC exposure.
Ark Invest and 21Shares’ ETF ARKB led the inflow charge, recording the highest daily net inflow of $267.10 million, bringing its total cumulative net inflows to $2.87 billion.
Fidelity’s ETF FBTC followed with a net inflow of $253.82 million. The ETF’s total historical net inflows now stand at $11.62 billion.
BTC’s Price Pumps, But Derivatives Traders Bet on a Fall
On the derivatives side, open interest in BTC futures has also climbed, reflecting the increased trading activity and speculative positioning as the coin attempts to stabilize above $90,000.
BTC trades at $93,548 at press time, noting a 6% price surge over the past day. During the same period, its futures open interest has also risen by 16%. As of this writing, it stands at $67.19 billion, its highest level since January 24.
When an asset’s price and open interest rise simultaneously, it signals strong conviction behind the move. It means more capital is entering the market to support the uptrend.
However, not all indicators point to bullish sentiment.
Despite BTC’s price surge over the past day, the funding rate remains negative, suggesting that traders are paying a premium to short the coin in the futures markets. The coin’s funding rate is currently at -0.01%.
BTC’s negative funding rate means that shorts are paying longs to keep their positions open. This indicates that more traders are betting against BTC’s current rally and are anticipating a bearish reversal.
Additionally, the put-to-call ratio leans bearish. This confirms waning investor confidence and expectations of downward price movement among BTC options traders.
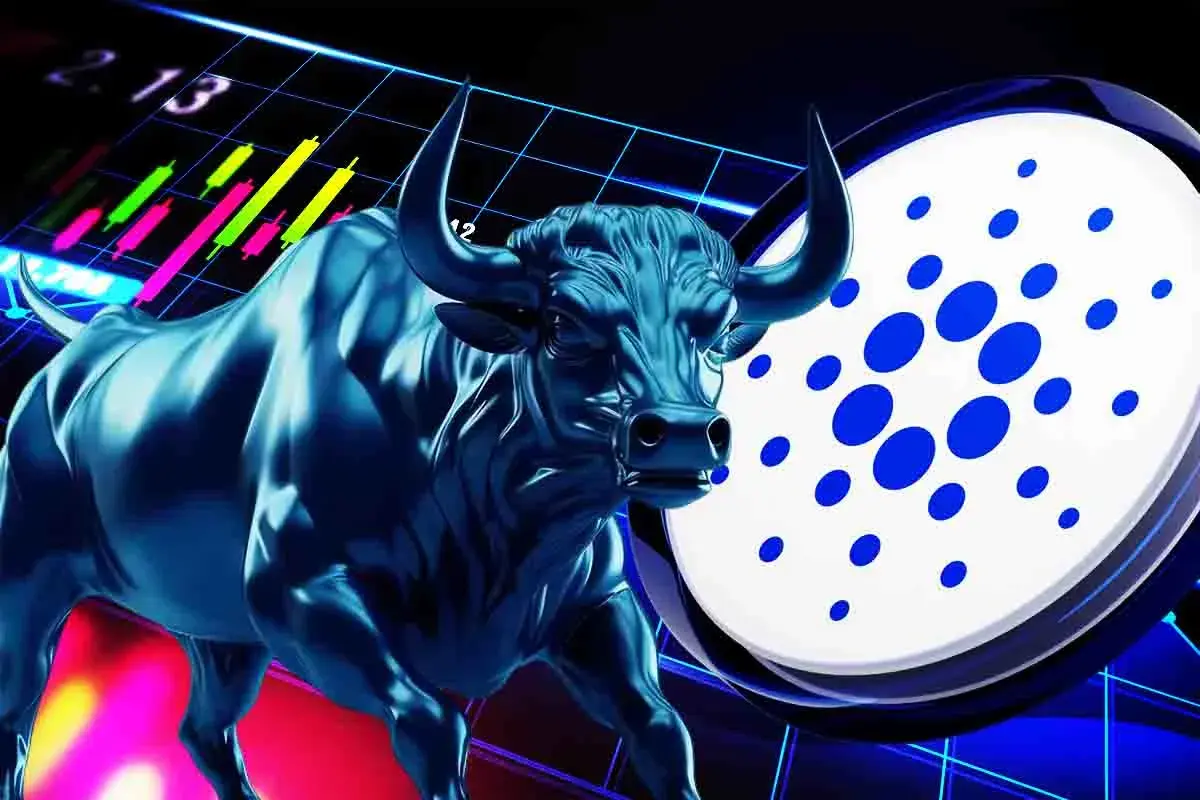
Cardano price sits above a crucial support level and may experience a bull run in May. Its daily volume in the spot market continued to rise, reaching $700 million today. Also, the open interest in the futures market is above its April lows. These factors, together with the positive weighted funding rate, means that ADA price could surge soon.
The ADA price today trades at $0.70, having risen by almost 40% from its April low.
Cardano Price Boosted by Rising Spot and Futures Volume
A potential bullish catalyst for the Cardano price is that signs of demand are emerging in the futures and spot market. CoinGecko data shows that the trailing Cardano volume jumped to over $700 million on Thursday.
Cardano Volume
This continues a trend that started late last month when the daily volume has averaged above $700M on weekdays. For example, its spot volume soared to $1.035 billion on April 25.
A rising volume, especially when a cryptocurrency is experiencing a surge, is a sign of increased demand from both retail and institutional investors. The volume on centralized and decentralized exchanges can also jump when a crypto is crashing, as holders sell.
In line with this, Cardano price could rise as the futures open interest in the futures market rises. Per CoinGlass, the open interest rose to $782 million on Thursday. While this figure is lower than its weekly high, it is much higher than the April low of $576 million.
Open interest is a crucial metric in the futures market, as it measures the number of unfilled call and put trades in the futures market. The interest often rises when a cryptocurrency is in an uptrend. A reversal usually happens when the OI overshoots, as it did in November and March.
Cardano Open Interest
Further confirming a potential Cardano price bull run is the fact that the funding rate has turned positive. It has jumped to 0.65, a sign that long position holders are paying a small fee to those predicting that it will fall. A positive figure provides a good ADA price forecast.
Cardano Funding Rate
ADA Price Technical Analysis: Break and Retest Hints of a Bull Run
Cardano price is also exhibiting bullish technicals. The daily chart shows that the coin has formed an inverse head and shoulders pattern, a popular bullish reversal sign.
ADA price also formed a large falling wedge pattern, which is shown in red in the chart below. This pattern occurs when there are two falling and converging trendlines. These lines are drawn by linking the lower lows and higher lows in a certain period. Cardano has now moved above the upper side of the wedge. After doing this, it has retested that trendline, confirming a potential breakout.
On top of this, it created a double-bottom pattern at $0.5212, with a neckline is at $1.1705. Therefore, the most likely ADA price forecast is where it surges and reaches the resistance at $1.1705, up by 67% from the current level.
Cardano price chart
A drop below the double-bottom pattern at $0.5212 will cancel the bullish outlook. It will also risk the coin dropping to $0.2761, its lowest level last year.
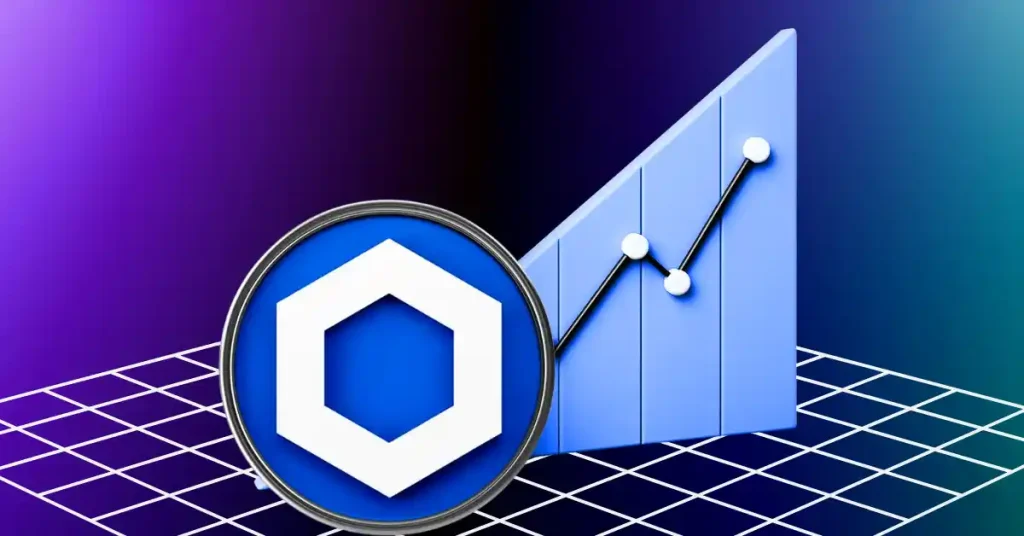
Chainlink (LINK), a leader in decentralized oracle networks, is currently witnessing a crucial consolidation phase. With major institutional integrations and on-chain accumulation by whales, LINK appears poised for a significant move. As the crypto market regains traction, all eyes are on Chainlink’s technical structure and the expanding use cases around its CCIP protocol.
Chainlink Ecosystem Growth Accelerates with Institutional Adoption
Chainlink has been one of the major DeFi platforms and is called the oracle of the dApps, which connects the chains with the real world. Its utility continues to expand across DeFi and institutional-grade platforms.
CCIP Integrations: Leading projects like Maple, Spiko, and Matrixdock are leveraging Chainlink CCIP for secure, compliant cross-chain asset movement.
Compliance Engine Launch: In collaboration with Apex Group and GLEIF, Chainlink introduced the Automated Compliance Engine (ACE), boosting real-world asset tokenization infrastructure.
Major Partnerships: Projects like Coinbase’s “Project Diamond” and Mastercard are tapping Chainlink’s secure data feeds and infrastructure for tokenized settlements and card payments.
These developments reinforce Chainlink’s role as a backbone of decentralized finance and institutional blockchain infrastructure.
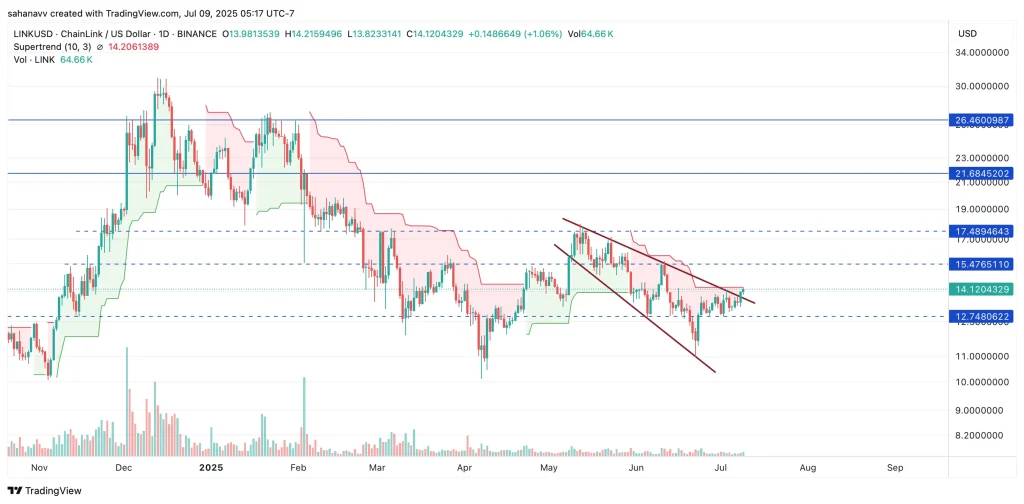
LINK Price Analysis: Consolidation Near Critical Resistance
LINK price is trading in a narrow range between $13.50 and $14.10, forming a symmetrical triangle pattern on the charts. This pattern often precedes major breakouts, either to the upside or downside. A decisive move above $14.10 could set the stage for a rally toward $15.60 and even $17.30, while a failure to hold support at $13.10–$13.30 could expose downside risk to $12.
On-chain signals show increasing whale accumulation near the $13–14 range, supporting a bullish thesis.
As seen in the above chart, the LINK price has broken above the falling wedge, which is expected to offer a strong upside potential for the token. The rebound from the support around $11, which pushed the levels above the psychological barrier at $12.7. Meanwhile, the token is testing the Supertrend. If it rises above the range, it may flip to bullish, which could signal the start of a fresh bullish trend.
However, a rise above $15 could only squash the bearish possibility, and till then, both the traders and long-term holders need to monitor the breakout levels and upcoming ecosystem launches.
The post Chainlink (LINK) Consolidates Near $14: Is a Breakout on the Horizon? appeared first on Coinpedia Fintech News
Chainlink (LINK), a leader in decentralized oracle networks, is currently witnessing a crucial consolidation phase. With major institutional integrations and on-chain accumulation by whales, LINK appears poised for a significant move. As the crypto market regains traction, all eyes are on Chainlink’s technical structure and the expanding use cases around its CCIP protocol. Chainlink Ecosystem …