India’s New Income Tax Bill, proposed in 2025, has raised serious concerns about digital privacy. If passed, the bill would allow tax officials to access individuals’ emails, social media, and trading accounts starting from April 1, 2026. The government claims this measure is necessary to curb tax evasion, but many are worried about potential misuse and privacy violations.
Digital Locks No Longer Safe
Currently, tax officials do not have direct authority to check digital records, which has led to legal confusion. The new bill seeks to remove these uncertainties by officially granting them the power to access:
Email servers
Online banking and investment platforms
Social media accounts
Digital storage and applications
Beginning April 1, 2026, tax officers will have the legal right to investigate a person’s digital presence if they suspect tax evasion.
This means they could check emails, social media activities, bank accounts, trading records, and even personal messages to look for undisclosed income, gold, jewelry, or other valuable assets on which taxes have not been paid.
What does the Law say?
Under the current Income Tax Act, of 1961, officials can enter properties and seize documents if they believe someone is hiding financial details. The new bill takes this a step further by giving them access to digital records.
This means tax officers could check personal messages, emails, and online accounts if they think someone is evading taxes. While the government insists these powers will only be used in serious cases, many people worry about the lack of clear rules.
A Threat to Digital Freedom?
While the bill aims to improve tax compliance, legal experts and privacy advocates worry it could lead to excessive government surveillance. They argue that without proper safeguards, authorities might gain too much control, increasing the risk of harassment and misuse of personal financial data.
Possible harassment of taxpayers
Unnecessary scrutiny of personal information
Threats to digital rights and privacy
Critics fear that businesses and individuals could face unfair investigations, and there are questions about how sensitive data will be handled and protected.
Bill is Currently In a Review
The bill is currently being reviewed by a parliamentary committee, and changes might be made before it becomes law. While the government sees this as a step toward better tax enforcement, concerns over privacy and misuse remain.
The crypto market has experienced a volatile start to Q2, with many tokens posting significant surges in recent days. Meme coins, in particular, have seen a resurgence, with older tokens gaining traction and newer ones attracting attention.
BeInCrypto has analyzed five meme coins for investors to watch in the coming month and their potential for further growth.
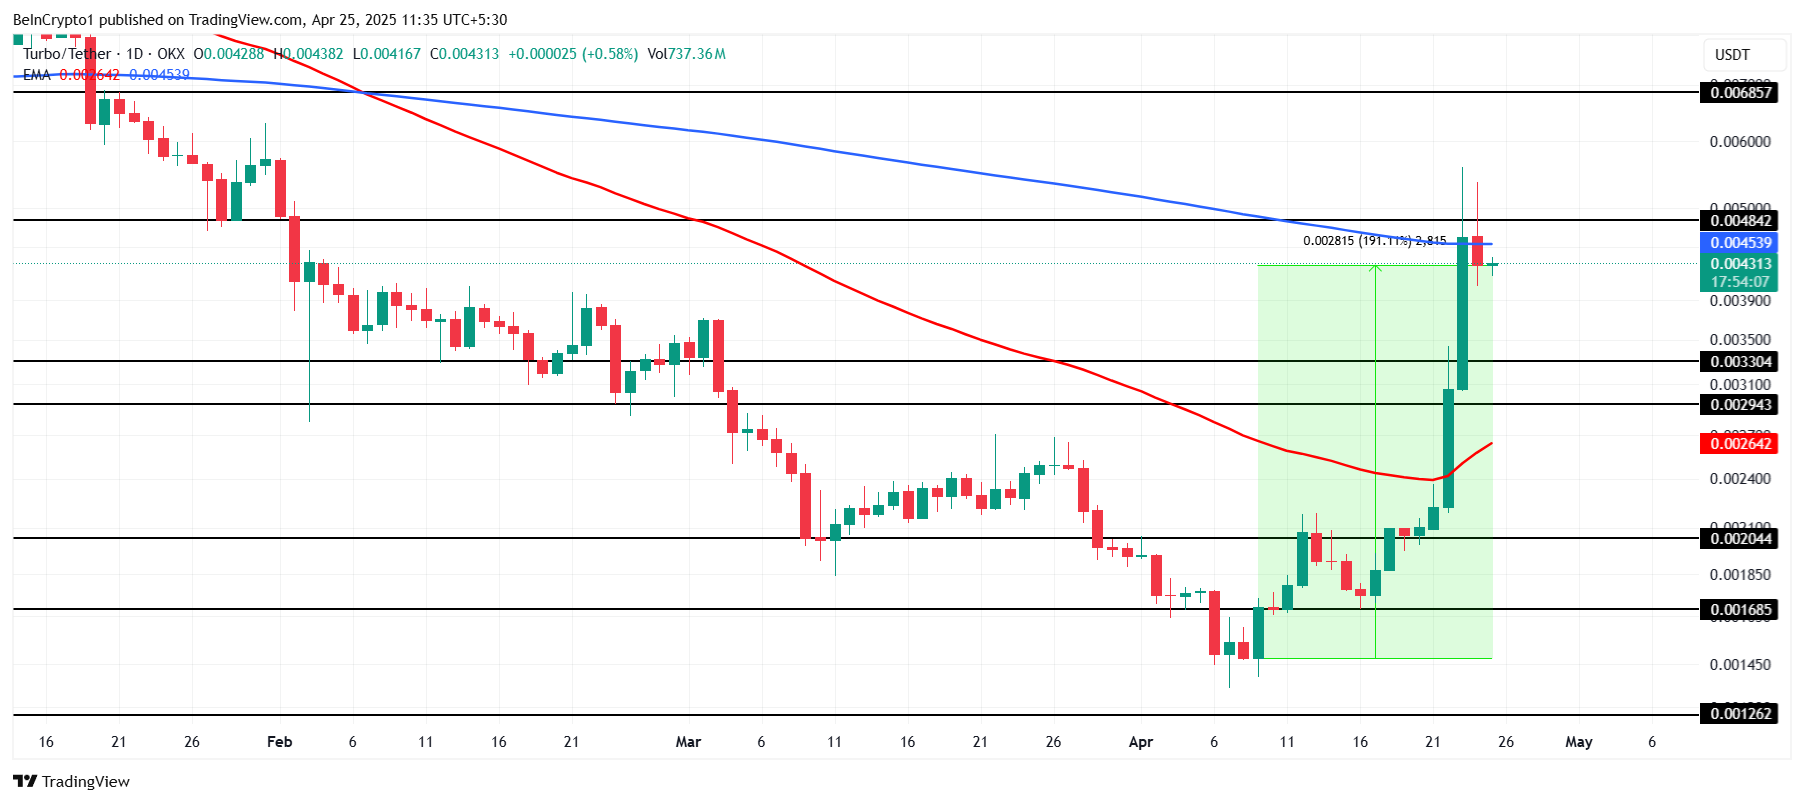
Turbo (TURBO)
TURBO has shown impressive momentum, gaining more than 191% in the past two weeks, now priced at $0.004313. The altcoin is testing key resistance at $0.004842. As one of the best performing meme coins this month, it continues to attract attention from investors, signaling strong potential for future gains.
This surge has provided relief to investors impacted by the February Death Cross. With TURBO standing at a near three-month high, the outlook remains positive if the broader market trends support further growth. A breakout above the resistance could propel TURBO towards the target of $0.006857, offering additional upside.
Failure to breach $0.004842 could lead to a reversal in the trend. A drop below this resistance would likely see TURBO testing the support level at $0.003304. This would invalidate the bullish scenario and potentially erase much of the recent price increase.
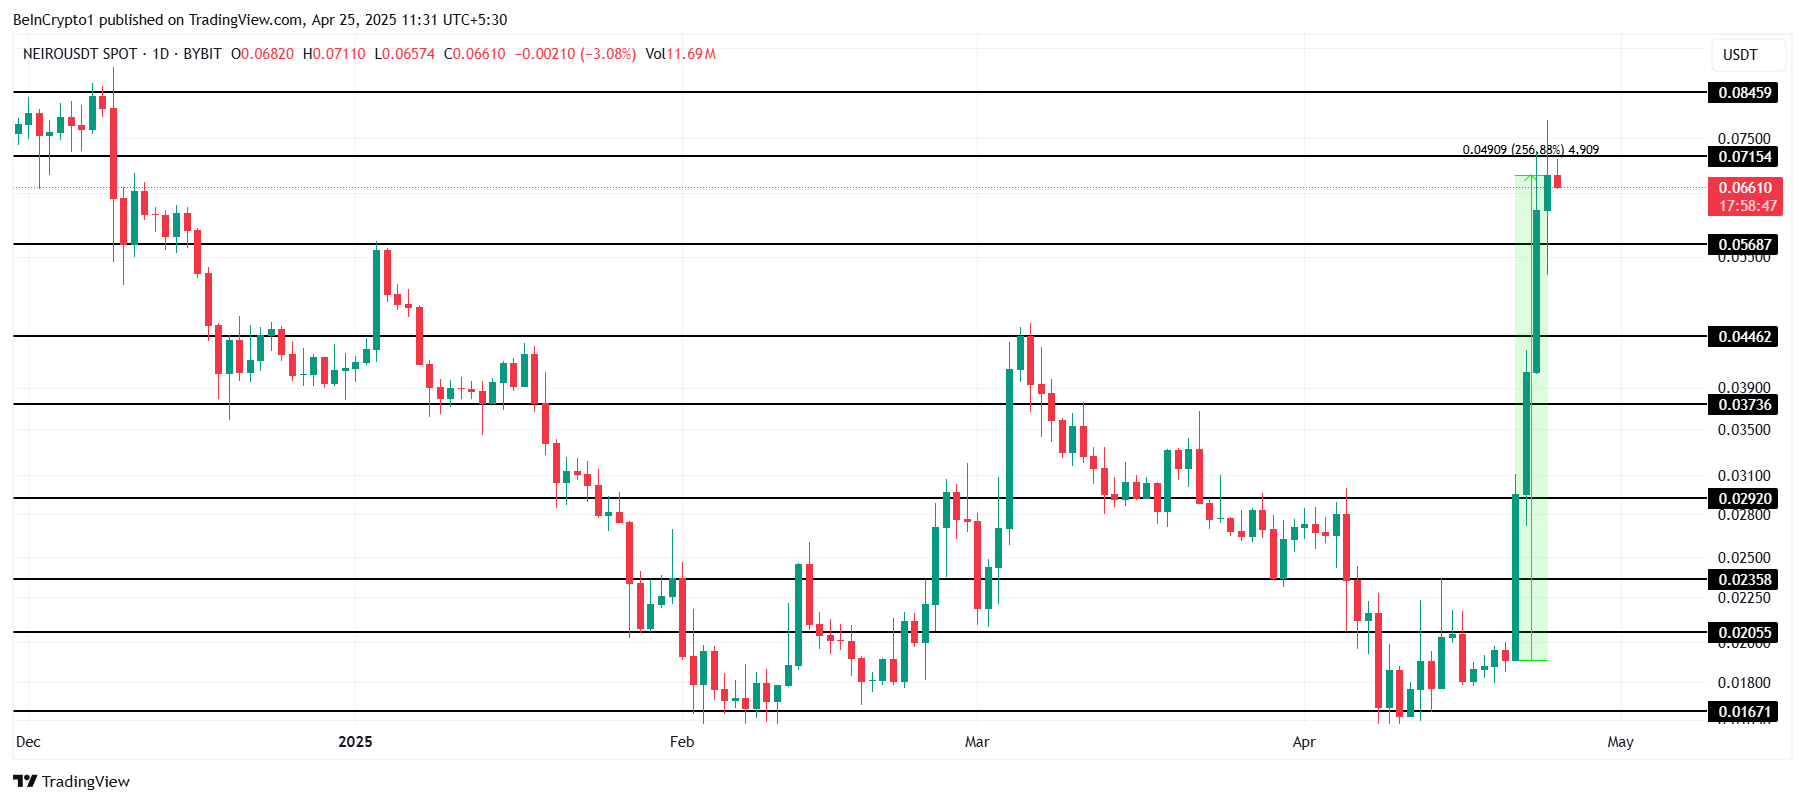
Neiro Ethereum (NEIRO)
NEIRO has experienced a notable resurgence, surging by 256% this week alone. Currently trading at $0.0661, the meme coin is at a four-month high. As NEIRO looks to break the $0.0715 resistance, it could see continued upward momentum if broader market conditions remain favorable.
The potential for NEIRO to breach $0.0715 is strong, with the broader market showing bullish trends as Bitcoin approaches $100,000. This could provide the necessary momentum to push NEIRO towards the $0.0845 resistance. A successful test of this level would solidify recent gains and set the stage for a move to $0.1000.
A failure to break through $0.0715 would likely send NEIRO into a bearish correction. In this scenario, the price could fall through key support at $0.0568, possibly testing $0.0446. This would invalidate the current bullish outlook, highlighting the importance of breaking resistance for continued growth.
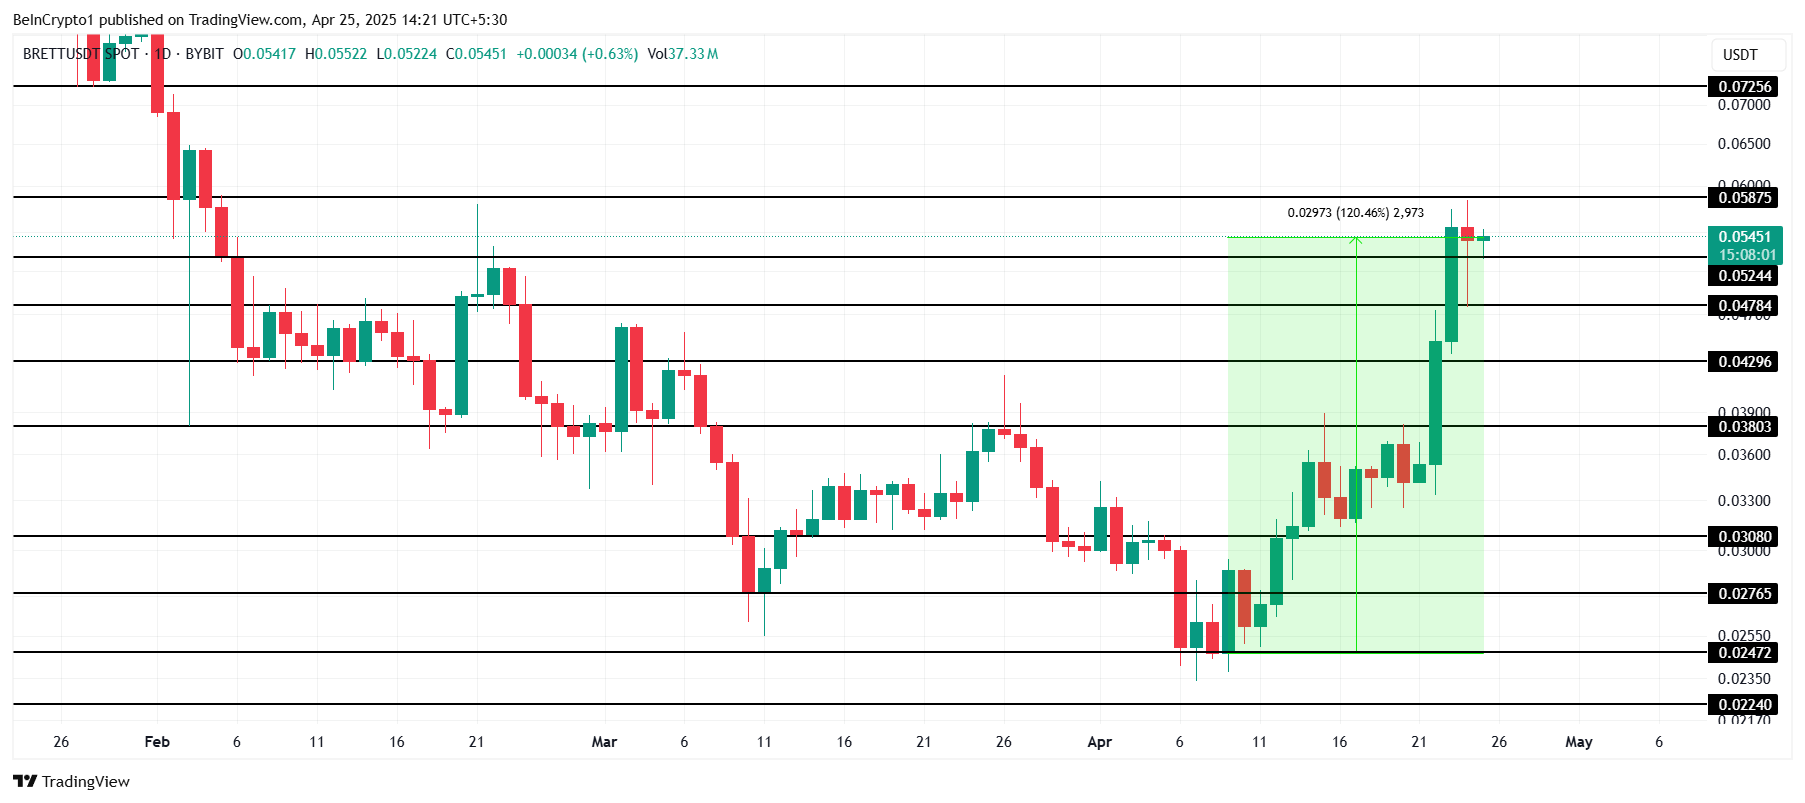
Brett (BRETT)
BRETT has shown remarkable growth, up 120% over the past two weeks, trading at $0.054. This surge marks a near-three-month high for the meme coin, driven by a shift in market conditions. The rally suggests strong investor sentiment, fueled by the growing interest in Base meme coins.
As the market shifts, BRETT has captured attention, making it one of the more promising altcoins in its category.
With continued momentum, BRETT could break through the $0.058 resistance level, opening the door to further gains. A move toward $0.072 is plausible, especially as hype surrounding Base meme coins intensifies.
This meme coin also reignites the Solana vs. Base meme coin discourse; however, Alvin Kan, COO at Bitget Wallet, told BeInCrypto that this may not be the case.
“Solana still leads. It’s fast, cheap, and has an army of degens ready to mint and trade anything viral. Base is growing, and Coinbase might help push it further, but it hasn’t built the same retail energy yet. As for AI meme coins—they’re interesting, but still feel like a niche inside a niche. For now, Solana memes dominate the meme meta.”
However, a correction could follow if BRETT fails to breach $0.058. The price might drop through the $0.052 support, potentially reaching as low as $0.042. This decline would invalidate the bullish outlook, signaling a shift in market sentiment. Without sustained support above $0.058, the upward momentum may be short-lived, and bearish conditions could prevail.
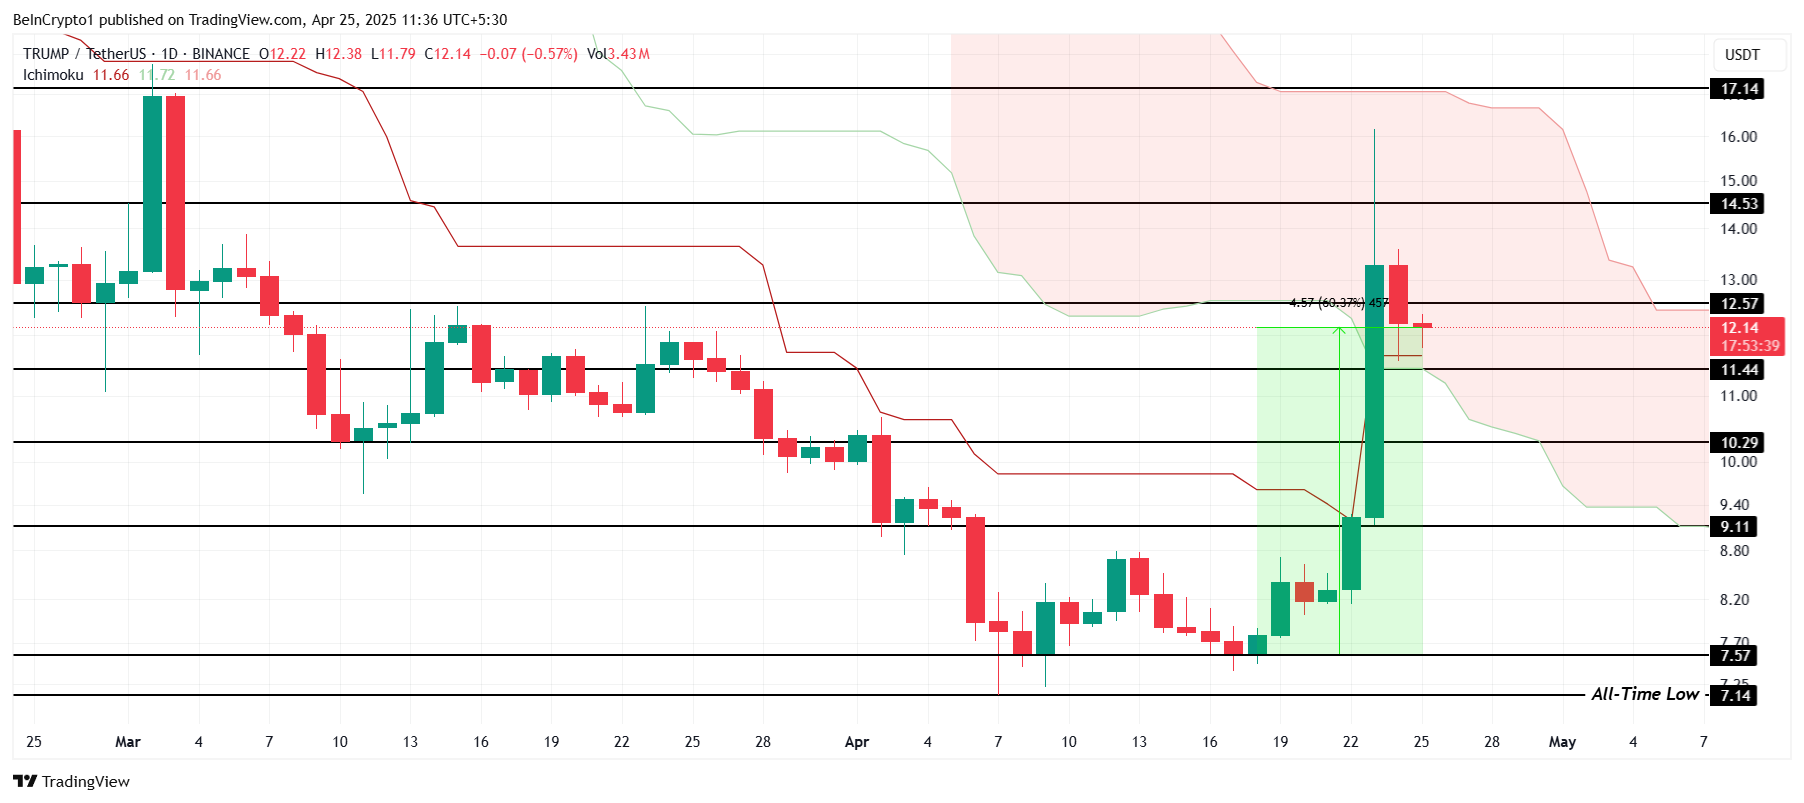
Official Trump (TRUMP)
TRUMP has captured investor attention, surging 60% this week to trade at $12.14. The meme coin has reignited interest, driven by market speculation. Its rise comes amid increasing excitement around politically fueled volatility, making it a popular pick for traders looking to capitalize on unpredictable market swings.
Although TRUMP failed to secure $12.57 as a support level, the possibility of achieving this level in the coming weeks remains strong. The US President’s influence on market movements, driven by unexpected announcements, could provide the catalyst needed for TRUMP to rise further, potentially reaching $14.53 as it follows broader financial trends.
Failure to hold $12.57 as support could signal a reversal. In this case, TRUMP may see its price drop to $11.44 or $10.29, undermining the current bullish outlook. This scenario would invalidate the positive momentum, with investors needing to monitor key levels for potential price shifts closely.
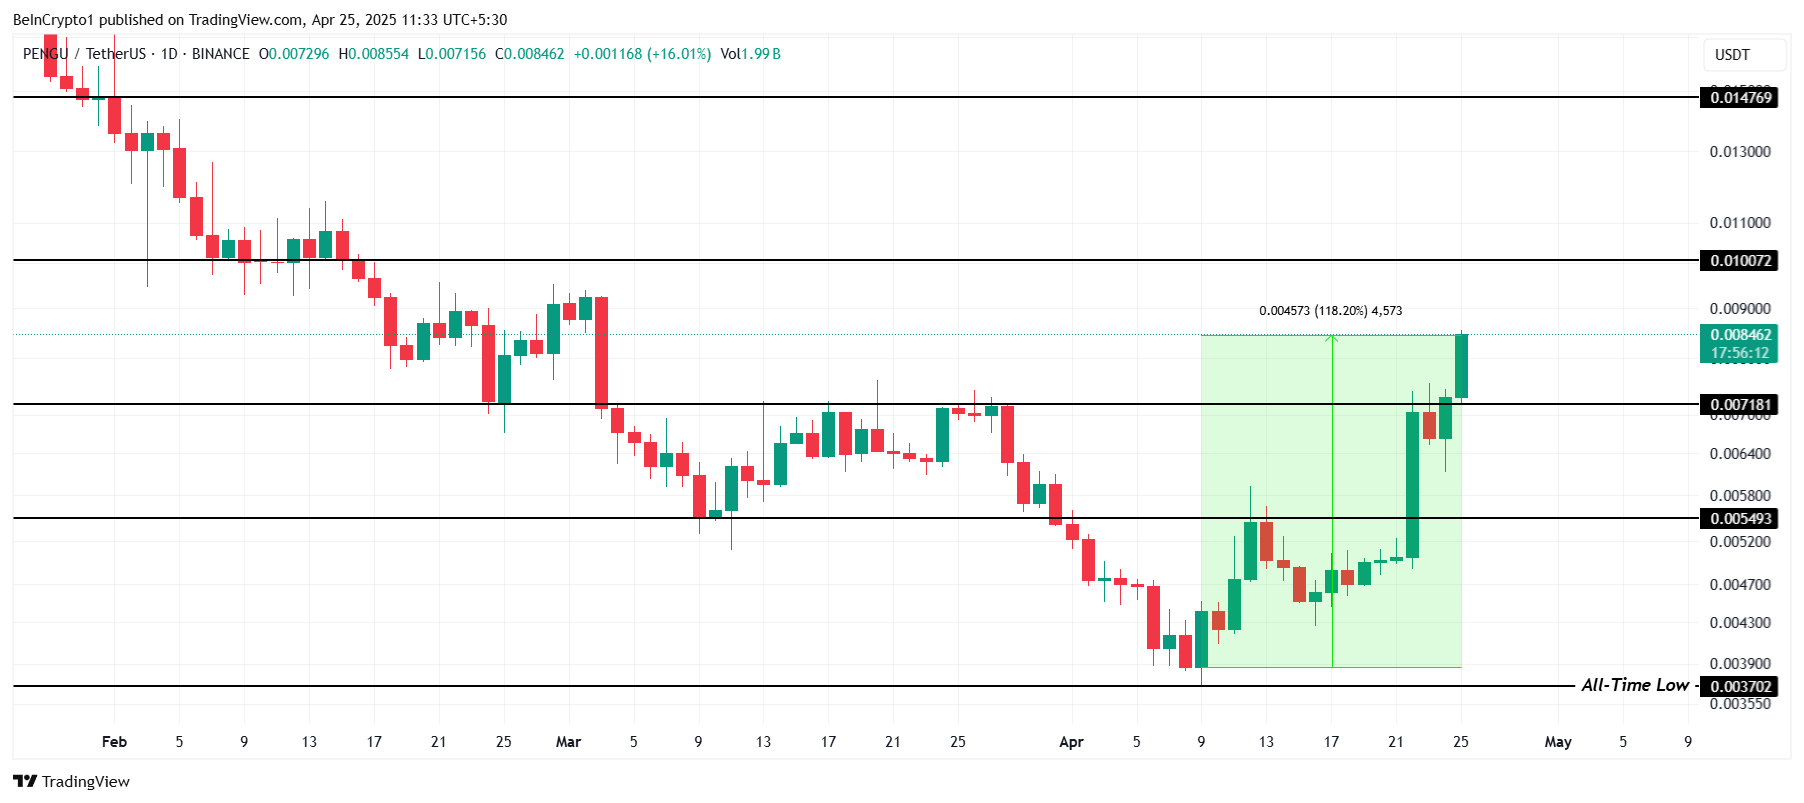
Pudgy Penguins (PENGU)
PENGU has experienced significant volatility since January, with massive drawdowns following early interest. However, the meme coin has rebounded sharply, gaining 118% over the past two weeks. This recovery has caught the attention of investors, reigniting hopes for further growth and renewed momentum in the altcoin’s price.
Currently trading at $0.00846, PENGU is nearing key resistance at $0.01007. If the meme coin can maintain its bullish momentum, it presents a promising opportunity for investors. A successful break above this level could attract additional buyers, further driving its price and expanding the interest in this resurgent meme coin.
Failing to breach $0.01007 would likely result in a price decline, with support potentially falling to $0.00718. This would erode recent gains and invalidate the bullish outlook, with a further drop to $0.00549.
Bitcoin may face three potential trend scenarios in the future, with the most optimistic one forecasting a surge to $150,000 to $175,000 within the next 12 months.
This prediction is supported by factors such as a strong influx of institutional capital and positive investor sentiment following the Trump administration’s plans to establish a national Bitcoin reserve.
Positive Forecasts from Experts and Market Signals
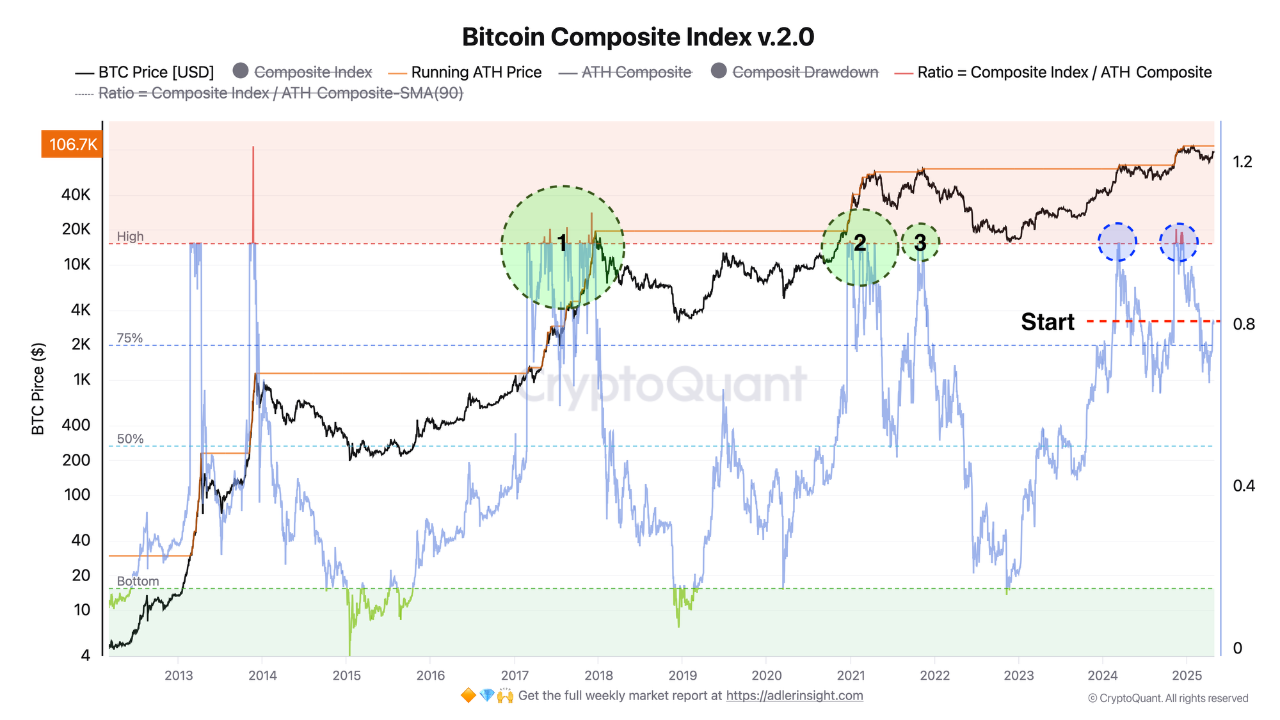
The Bitcoin Composite Index currently stands at ≈ 0.8 (80%). Based on this indicator, AxelAdlerJr outlined three possible scenarios.
In the most optimistic scenario, BTC’s price could reach $150,000 to $175,000, following the cyclical logic of 2017 and 2021. This would occur if the Bitcoin Composite Index surpasses 1.0 and remains above that level.
If the ratio stays within the 0.8–1.0 range, the market would likely consolidate in a broad corridor between $90,000 and $110,000, indicating that participants are maintaining positions without increasing exposure.
Alternatively, if the ratio drops to 0.75 or below, short-term holders may start taking profits, potentially leading to a price correction to $70,000–$85,000. However, AxelAdlerJr notes that this scenario is less likely than the other two.
The return of YoY True MVRV to positive territory means that the average purchase price of all coins acquired over the past year is now below the current market price. The pressure from panic sellers is decreasing – many are now in profit and don’t need to lock in losses. Holder… pic.twitter.com/6AgvVVTn9h
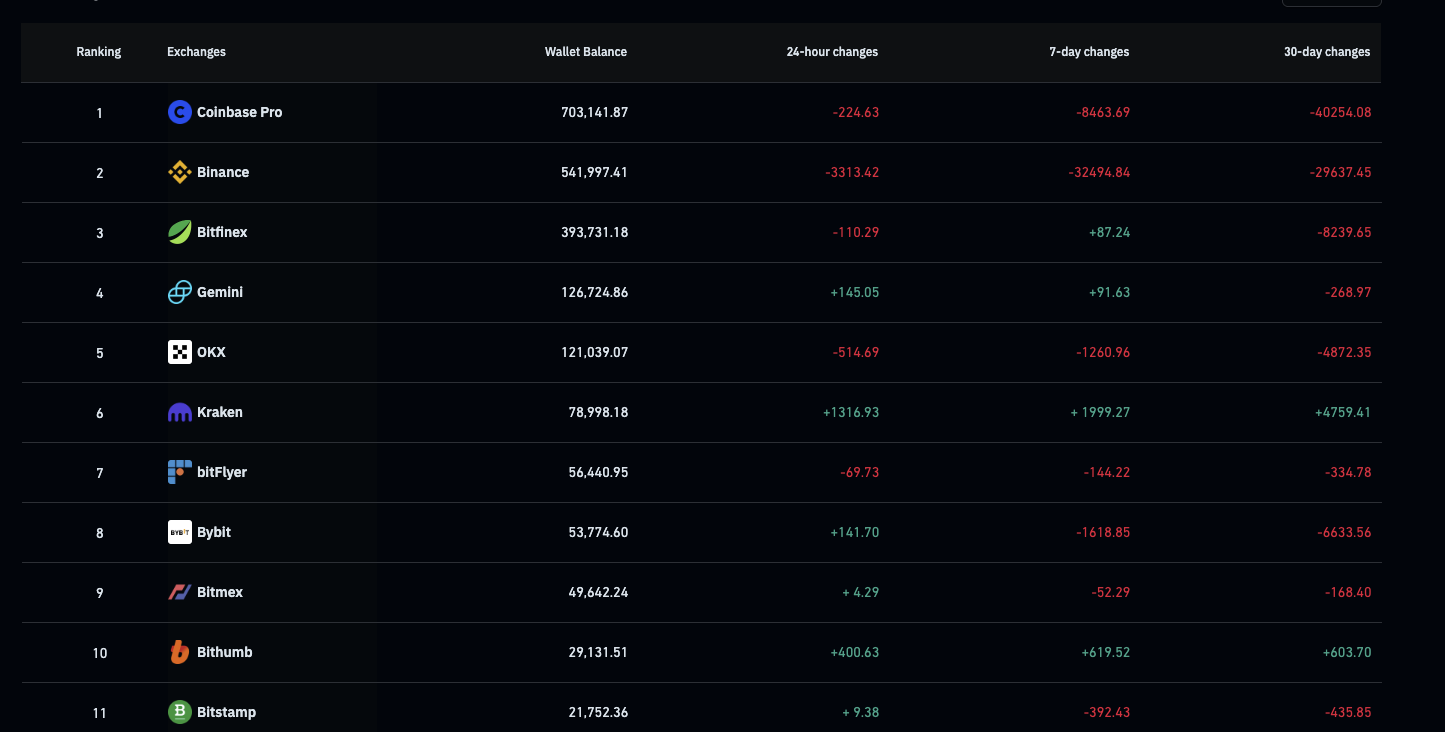
On-chain signals further bolster the bullish outlook. According to Coinglass, over the past 7 days, approximately 42,525.89 Bitcoins were withdrawn from centralized exchanges (CEX), reducing the supply on exchanges to a 7-year low of about 2.48 million BTC.
The trend of Bitcoin withdrawals from exchanges is often seen as a positive sign, as it indicates investor accumulation and reduced selling pressure, paving the way for price growth.
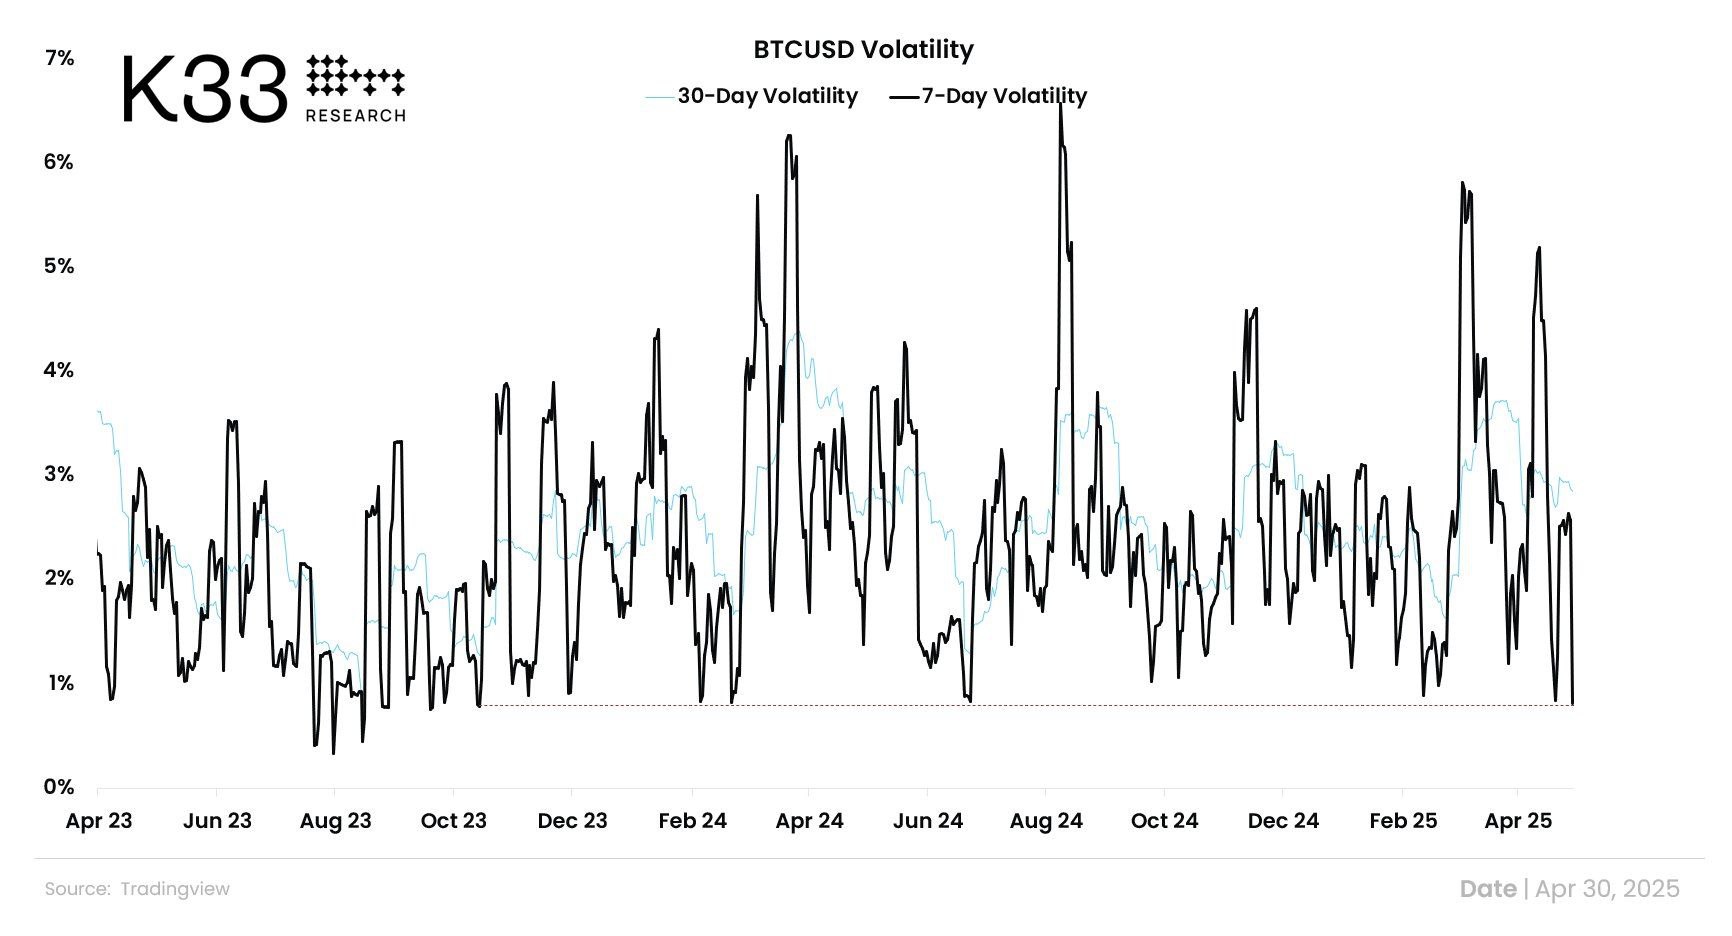
Bitcoin’s 7-day volatility has also hit its lowest level in 563 days. Low volatility typically signals a period of accumulation before a price breakout, as observed during past major rallies, such as in 2020 before Bitcoin peaked at $69,000.
Technical analysis also supports Bitcoin’s bullish scenario. According to a post on X by Ali, Bitcoin’s key support levels are at $93,198 and $83,444, indicating strong consolidation above these thresholds.
If Bitcoin sustains above $93,198, the likelihood of continuing its upward trend to reach the $150,000 target becomes highly feasible.
“The most critical support levels for #Bitcoin $BTC are $93,198 and $83,444. Key zones to watch if momentum shifts,” Ali shared.
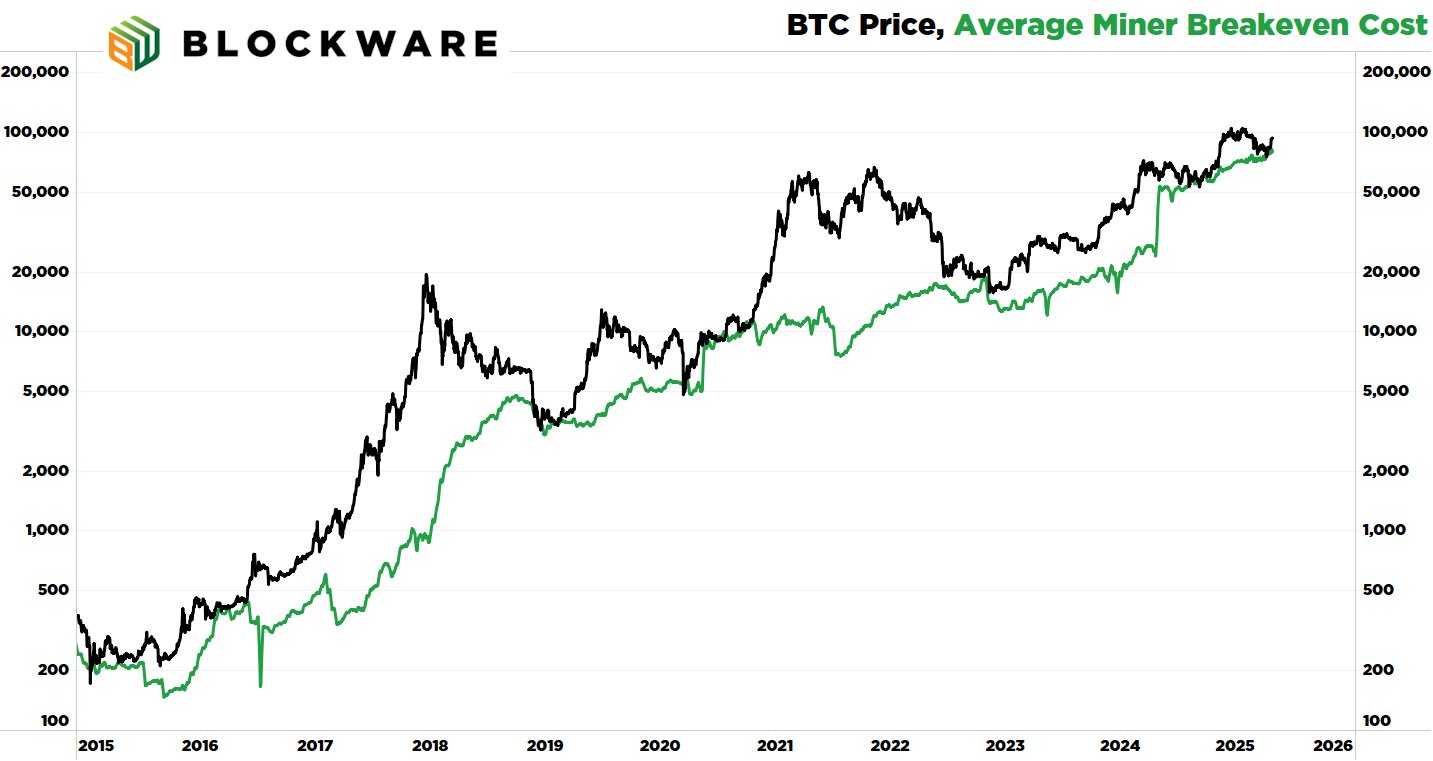
Moreover, Breedlove22, a well-known analyst, shared on X about three indicators signaling optimism for Bitcoin. The first is the Average Miner Cost of Production. According to Breedlove22, this metric is at a bottom, suggesting a significant bull market may be on the horizon.
Average Miner Cost of Production. Source: Breedlove22
The second indicator is the supply held by long-term holders, which measures Bitcoin unmoved on-chain for at least 155 days. Breedlove22 noted that over the past 30 days, long-term holders have acquired an additional ~150,000 BTC.
“Bitcoin is running out of sellers in the $80,000 to $100,000 range,” Breedlove22 stated.
Lastly, and most importantly, is USD liquidity, which effectively represents the “demand” side of the equation. More dollars in the system mean more potential bidders.
“And it’s not just USD liquidity that’s increasing – liquidity of all fiat currencies is on the rise, and Bitcoin is a global asset,” Breedlove22 added.
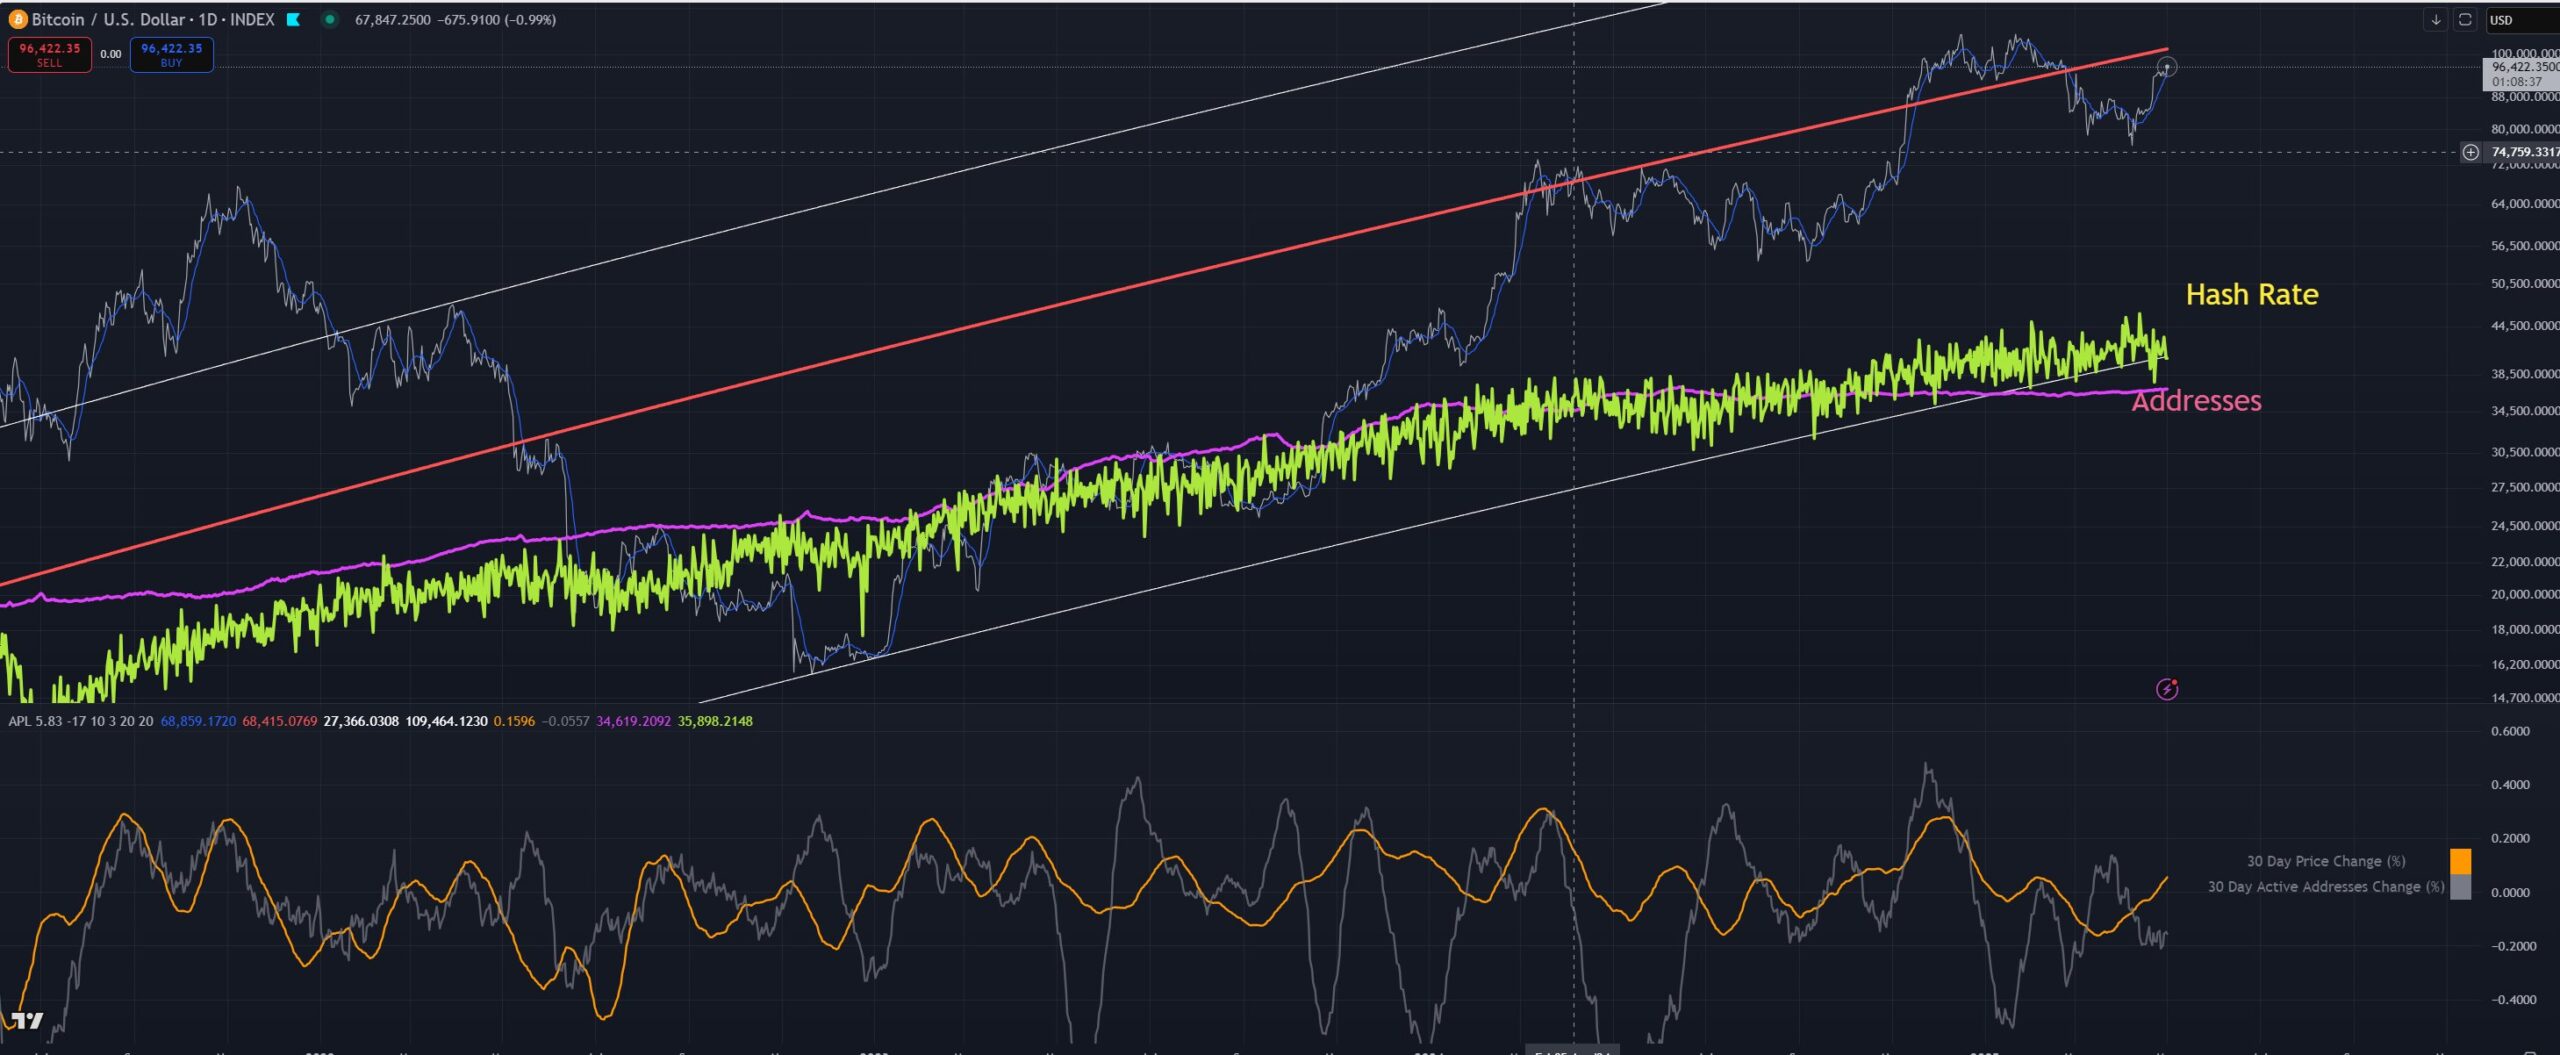
Echoing Breedlove22’s perspective, another X user shared that BTC’s valuation based on hash rate is at a support level, suggesting that a local bottom may have been reached.
In the optimistic scenario, Bitcoin is poised for a significant opportunity to reach $150,000 to $175,000. However, investors should also prepare for risks such as short-term price corrections.
With strong support levels at $93,198 and $83,444, Bitcoin has a solid foundation for continued growth, but caution remains essential.
Bitcoin (BTC) price eyes a parabolic rally past $100,000 after BTC’s Realized Capitalization soared to an all-time high, a surge that has always preceded a strong upward trend. The rise in this metric comes as BTC defends $95,000, after President Trump’s relief on auto tariffs fuelled a recovery across financial markets.
BTC value today stands at $94,930 with a daily high of $95,443, as the Bitcoin Fear and Greed Index indicates that traders are in a state of “greed.” A deep dive into the Realized Cap and 2 other key metrics suggests that a major price increase is looming.
Bitcoin (BTC) Price Eyes Rally As Realized Capitalization Hits ATH
According to CryptoQuant data shared by analyst Carmelo, BTC’s Realized Cap, an on-chain metric used to measure the price at which BTC was last moved on-chain, has reached a record high of $882 billion. Per Carmelo, the surge indicates retail and institutional investors have re-entered the market and anticipate gains in the near term.
Bitcoin Realized Capitalization
As the chart above shows, a rise in the Realized Cap metric is often followed by a notable increase in the price of Bitcoin. Per Carmelo, history will likely rhyme, and an explosion is on the horizon. He opined,
“Although we have seen progressive gains since April 9, the price has not yet exploded significantly in a very short time frame, which is a typical characteristic of Bitcoin. However, if these accumulations continue, it is highly likely that such an explosion will occur.”
Interestingly, this is not the only on-chain metric hinting towards a BTC price explosion happening soon. The supply of BTC held in profit has surged past 90%, which analyst Darkfost noted has previously caused a euphoric phase, and the king coin is getting close to this level.
Bitcoin Percent Supply in Profit
Meanwhile, popular analyst Ali Charts noted that in the last two weeks, whales have accumulated 43,100 BTC valued at nearly $4 billion, an indication that these large addresses may be positioning for an uptrend. This further supports the argument that a BTC breakout past $100,000 is looming and may happen soon.
Bitcoin Technical Analysis – Key Support & Resistance Levels to Watch
Bitcoin trades within a giant falling wedge pattern on the daily chart, and is teasing a breakout above the upper trendline, a move that could spark a 21% price gain towards an all-time high of $115,000. The RSI line, which is tipping north and has reached a value of 66, supports the likelihood of a breakout happening, as bullish momentum surges.
However, for a bullish Bitcoin price forecast to play out, BTC needs to clear several hurdles. The first is resistance at $95,680, a level that also marks the upper descending trendline of the falling wedge. If it makes a decisive close above this resistance, it then needs to clear $99,690 for a run up to $115,000.
BTC/USDT: 1-day Chart
If this bullish thesis fails, and traders who bought during the rally decide to take profits and spark a downtrend, Bitcoin price faces support at $92,000, with a breach of this level set to drag the price down to $81,000. If this happens, the market sentiment will likely fall back into “fear” and invalidate the likelihood of a “euphoric phase” happening in the near term.


 Adler Jr (@AxelAdlerJr)