Immutable’s utility token, IMX, is today’s top-performing altcoin, climbing nearly 15% over the past 24 hours. As of this writing, the altcoin trades at $0.64.
On-chain data points to a resurgence in bullish sentiment, suggesting that the rally may have legs in the short term. This analysis explains how.
IMX Traders Go Long and Network Activity Supports the Climb
IMX’s long/short ratio has risen above 1, indicating that many market participants are opening long positions in anticipation of continued upside. According to Coinglass, this currently stands at 1.004.
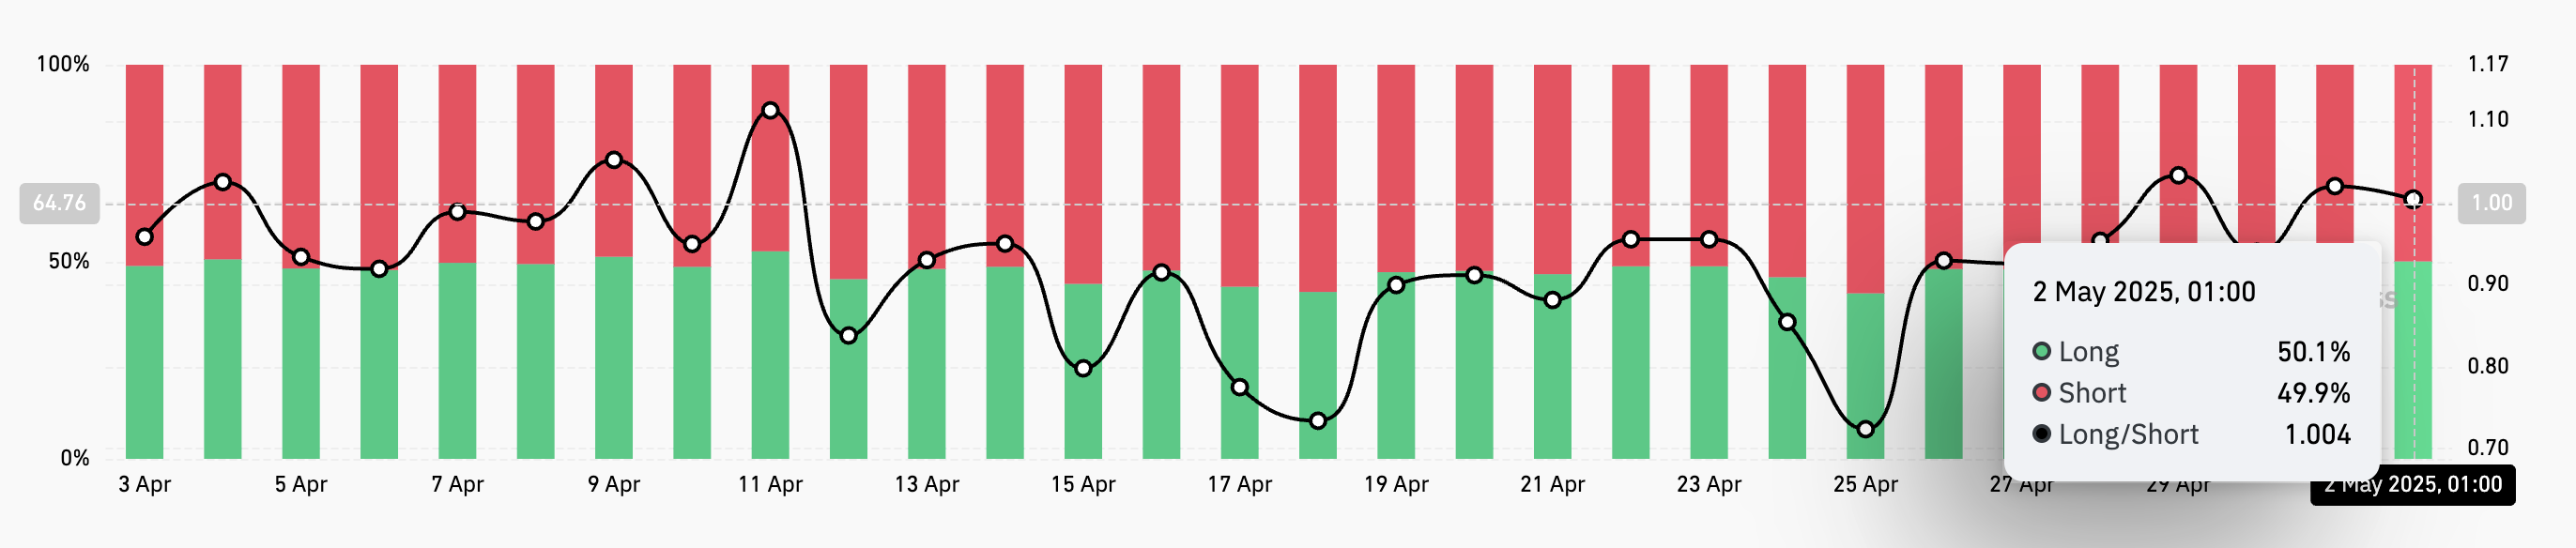
The long/short ratio measures the proportion of bullish (long) positions to bearish (short) positions in the market. When the ratio is below one, more traders are betting on a price decline than on a price increase.
Converesly, as with IMX, a ratio above one means there are more long positions than short ones. This suggests bullish sentiment, with most traders expecting the asset’s value to rise.
IMX’s price daily active address (DAA) divergence, which remains positive, further strengthens the bullish case. This metric, which measures an asset’s price movements with the changes in its number of daily active addresses, is currently at 63.22%.
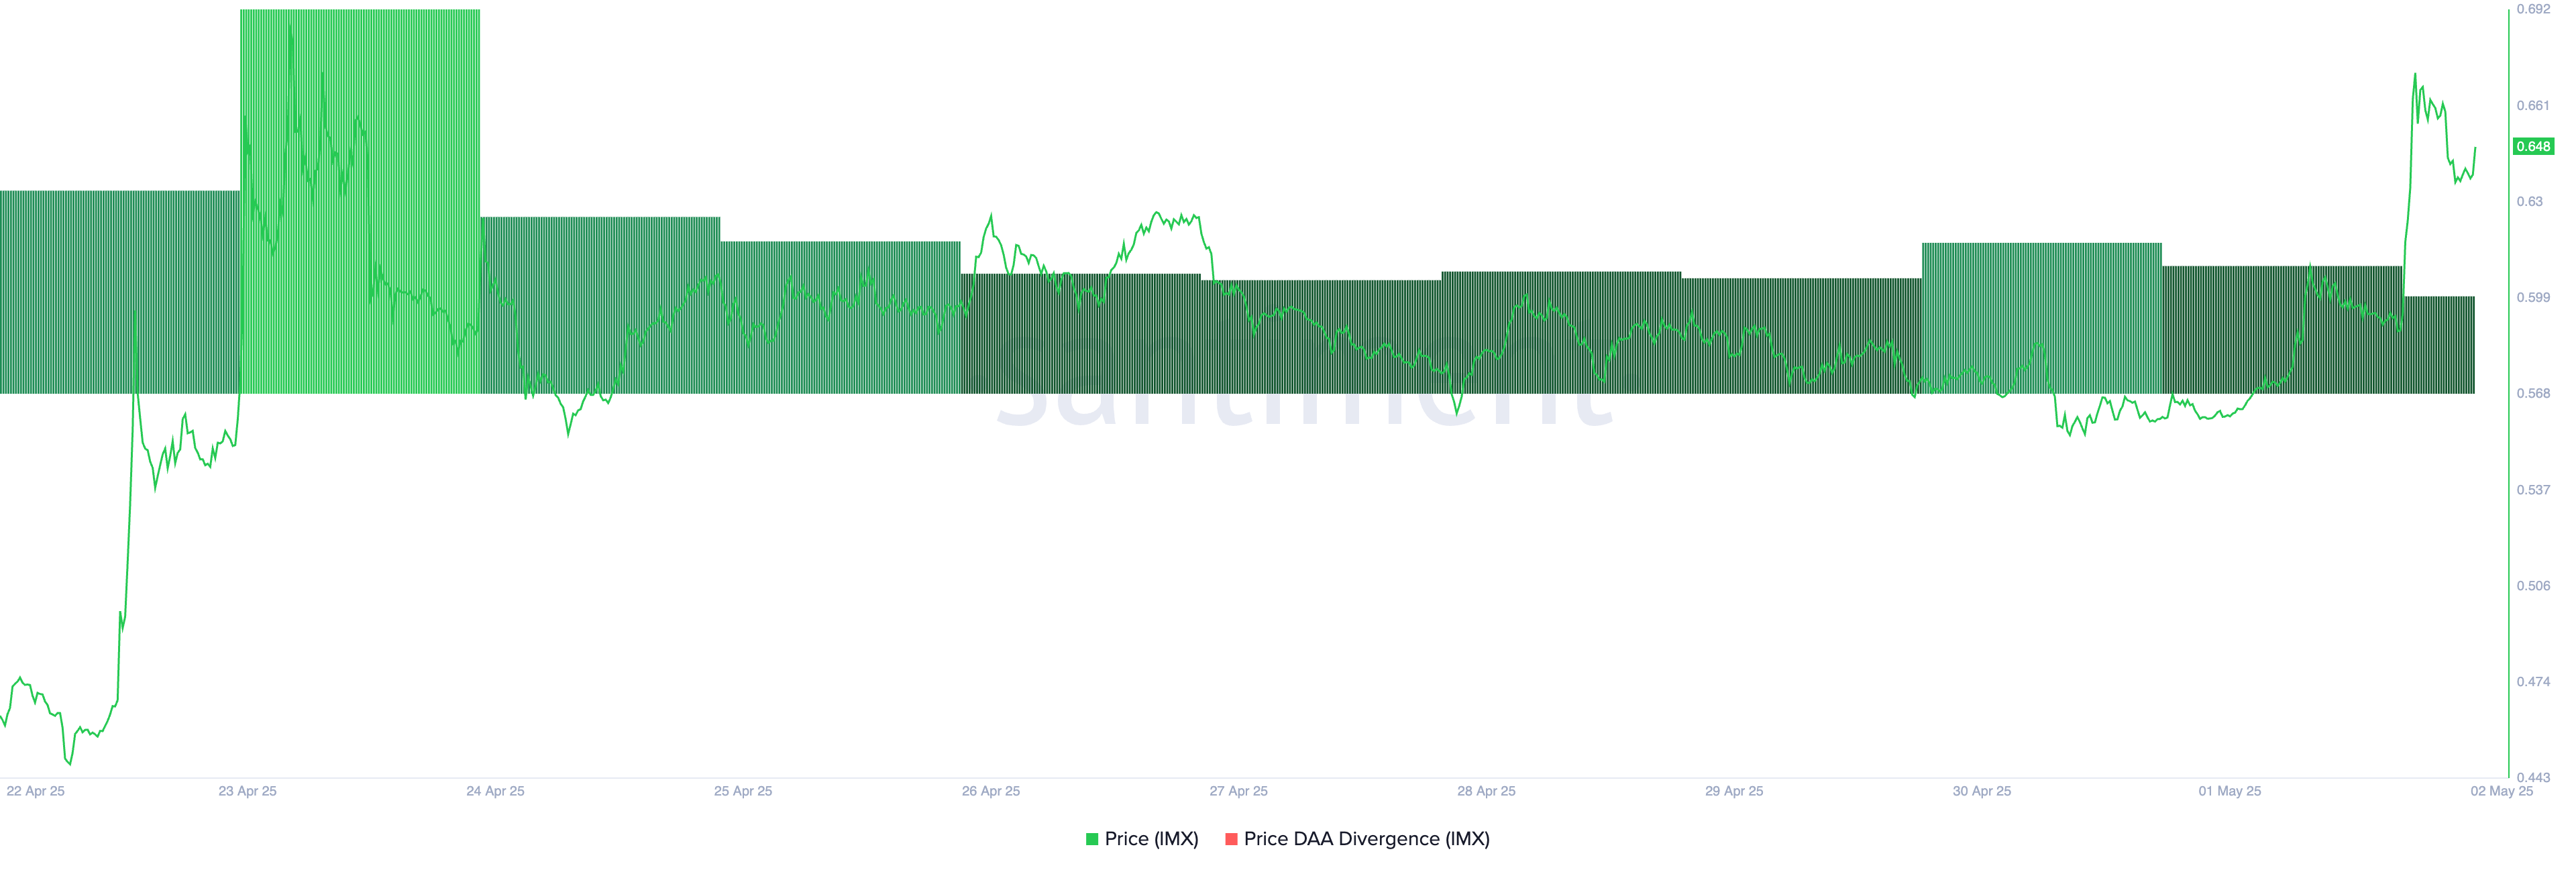
When an asset’s price rally is accompanied by a positive DAA divergence, it is considered a bullish signal, suggesting growing interest and the potential for further price appreciation.
This reflects that IMX’s recent price hike is supported by sufficient user activity on the network rather than driven solely by speculative trading.
IMX Price Outlook Strengthens
On the daily chart, the setup of IMX’s Moving Average Convergence Divergence (MACD) supports the bullish outlook above. At press time, IMX’s MACD line (blue) rests above its signal (orange) and zero lines.
An asset’s MACD indicator identifies trends and momentum in its price movement. It helps traders spot potential buy or sell signals through crossovers between the MACD and signal lines.
When the MACD line is above the signal line, buying activity dominates the market, hinting at further price rallies. If this holds for IMX and the token maintains its uptrend, it could break above the resistance at $0.73 and climb to $0.79.
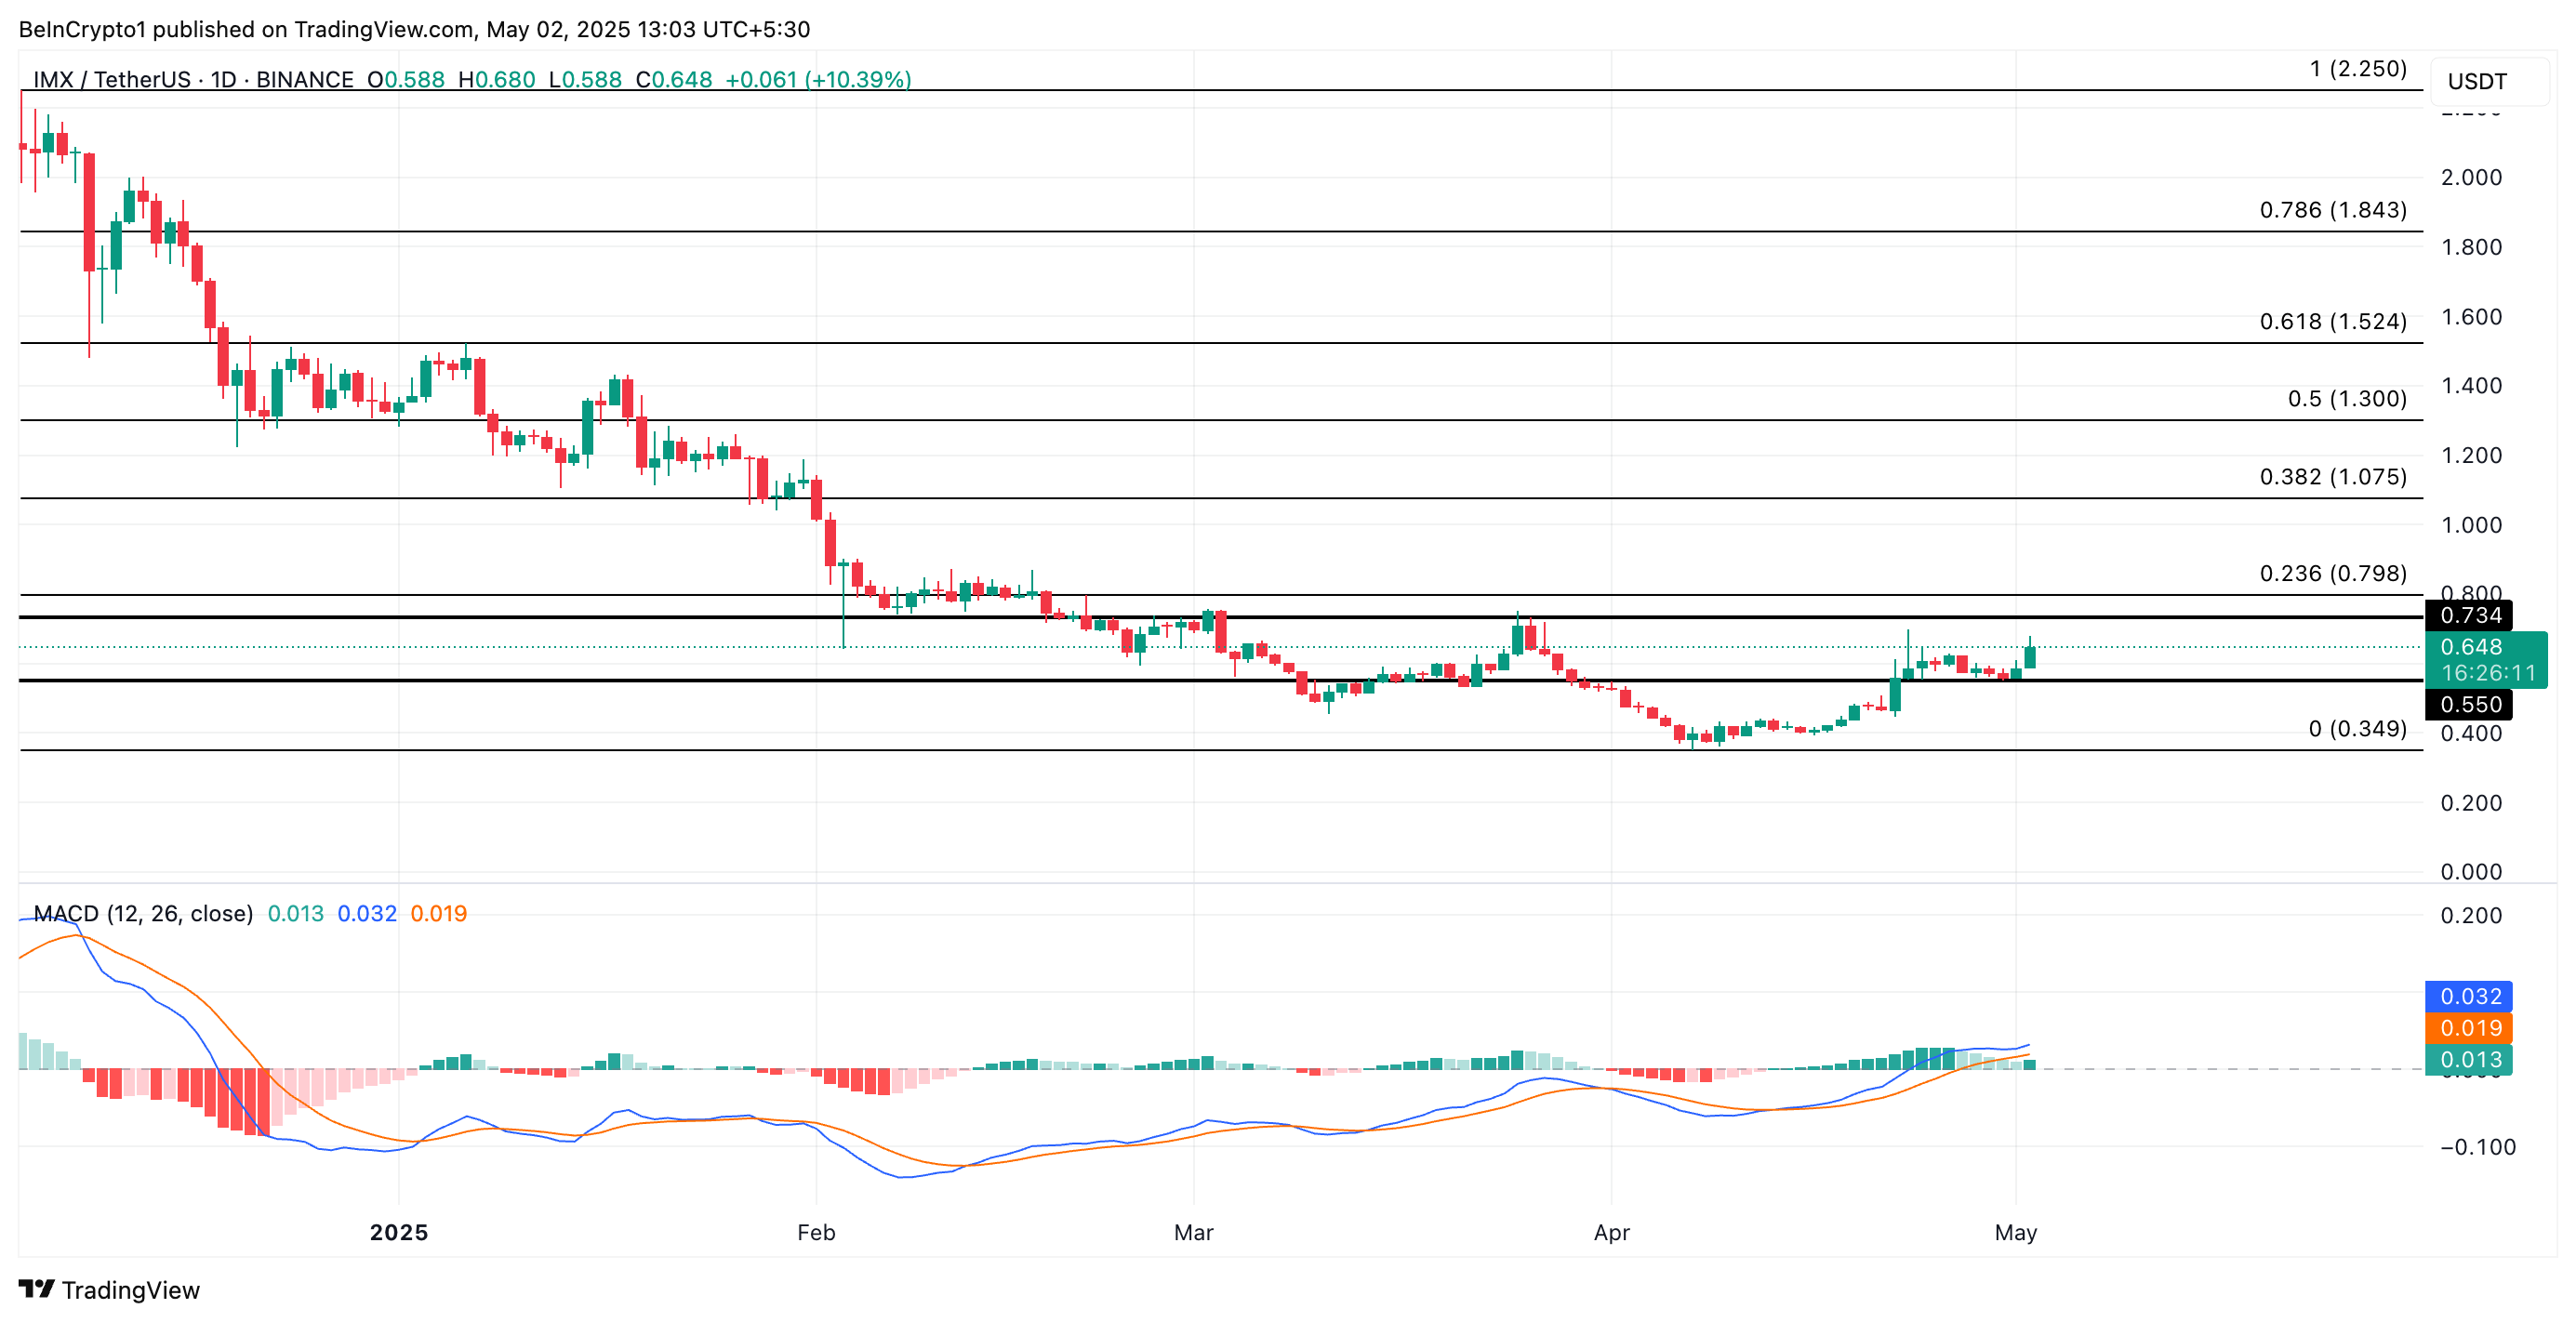
PI’s price has climbed 7% over the last seven days, signaling modest upward momentum. It currently trades at $0.65.
However, technical readings reveal that the rally largely lacks conviction from bullish traders, suggesting the price growth is more reflective of overall market growth than demand for PI.
PI Climbs, But Momentum Stalls
A key indicator supporting this outlook is the Relative Strength Index (RSI), which has remained largely flat despite the price uptick. This indicates a balance between PI’s buying and selling pressure, rather than a surge in bullish sentiment that typically accompanies sustainable rallies.
The RSI indicator measures an asset’s overbought and oversold market conditions. It ranges between 0 and 100. Values above 70 suggest that the asset is overbought and due for a price decline, while values under 30 indicate that the asset is oversold and may witness a rebound.
When it is flat like this, there is a balance between buying and selling pressure, with no clear momentum in either direction. This signals market indecision or consolidation, rather than a strong trend, despite PI’s price hike.
Further, PI’s Super Trend indicator, which continues to act as dynamic resistance above the token’s price, adds to the cautious outlook. This is currently at $0.85
The indicator helps traders identify the market’s direction by placing a line above or below the price chart based on the asset’s volatility.
As with PI, when an asset’s price trades below the Super Trend line, it signals a bearish trend, indicating that the market is in a downtrend and selling pressure is dominant.
As PI struggles to break above this level, the trend line reinforces bearish sentiment and suggests pushing the asset higher in the short term will be difficult.
PI Risks Drop to $0.40 Without Renewed Demand
PI currently trades at $0.65, resting below its 20-day exponential moving average (EMA). This indicator measures an asset’s average price over the past 20 trading days, giving more weight to recent prices.
When the EMA is positioned above the asset’s current price, it signals a short-term downtrend, indicating that recent prices are lower than the average of the past 20 days. If demand wanes further, PI could extend its losses and revisit its all-time low of $0.40.
As Bitcoin flirts with the key psychological threshold of $100,000, derivatives traders are closely watching for signals that could mark the final leg up—and are already positioning for what may follow.
Derivatives experts Gordon Grant and Joshua Lim told BeInCrypto that Bitcoin’s move past $100,000 now reflects a long-term holding strategy, unlike the speculative trading seen when it first crossed that threshold after Trump’s election victory.
Bitcoin Nears $100K: A Different Kind of Ascent?
At the time of press, Bitcoin’s price hovers just below $98,000. As it grows, traders anxiously watch for it to surpass the $100,000 threshold. When it does, it will be the second time in crypto history that this will happen.
According to Cryptocurrency Derivatives Trader Gordon Grant, the current move toward six figures lacks the euphoric energy of past rallies, such as the one after Trump won the US general election last November. However, that may be a good thing.
“This current bounce back feels much more of a low-key, lethargic reclamation of those highs,” Grant told BeInCrypto, referencing Bitcoin’s recovery from lows around $75,000 in early April. “The positioning rinsedown through all key moving averages… was a proper washout.”
He added that this washout, a sharp move lower that flushed out weak hands, cleared the decks for a healthier rebound. A “high-velocity bounce” followed, as Grant phrased it.
“[It] has since responsibly slowed down at the $95,000 pivot—a level at which Bitcoin has been centered, +/- 15%, for over five months now,” he added.
“Current complacency among vol sellers in fading the technical threshold at $100K is markedly different,” he said.
Grant added that, back in December, volatility spiked on expectations of a rapid moonshot toward $130,000–$150,000. Now, however, implied volatility has actually fallen by around 10 points during the final 10% of Bitcoin’s climb—an unusual dynamic that has punished traders holding out-of-the-money options who were betting on big price swings.
This time, the substantial loss of market optimism also contributes to the situation.
The Rise of Institutional Buyers
Market sentiment has shifted significantly since January. The excitement seen during Trump’s election has been replaced by uncertainty. According to Grant, souring macro conditions such as tariff-driven equity selloffs and growing caution among traders have contributed to this mood shift across markets.
“Whereas BTC on first launch to/through $100K was accompanied by euphoria about presidential policies… the re-approach has been marred by malaise,” Grant explained.
In short, the motivation to buy may now be driven more by fear than greed.
Joshua Lim, Global Co-Head of Markets at FalconX, agreed with this analysis, highlighting a notable shift in the primary source of Bitcoin demand.
“The dominant narrative is more around Microstrategy-type equities accumulating Bitcoin, that’s more consistent buyers than the retail swing traders,” Lim told BeInCrypto.
In other words, more speculative retail buying might have fueled earlier enthusiasm around Bitcoin’s price hitting $100,000. This time, the more consistent and significant buying is coming from large companies adopting a long-term Bitcoin holding strategy, similar to the one adopted by Michael Saylor’s Strategy.
The recent formation of 21 Capital, backed by mega companies like Tether and Softbank, further confirms this shift in motivation.
Consistent institutional buying can also sustain an increase in Bitcoin’s price over time.
Why Are Institutions Increasingly Bullish on Bitcoin?
With growing momentum from sovereign players and corporate treasuries, institutional buying may be critical in sustaining Bitcoin’s next upward trajectory.
Grant highlighted that developing countries seeking to move away from a weakening dollar and towards a more independent asset like Bitcoin could play a significant role. If this were to happen, it’d signify a potentially tectonic shift to global monetary policy.
“The Global South, tiring of wonky and inconstant dollar policies, may be truly thinking about dumping dollars for BTC,” Grant explained, clarifying, “That’s a reserve manager decision, not a spec/leverage position.”
Increased institutional adoption strengthens the idea that Bitcoin now serves as a way to reduce risk against issues pertinent to financial systems, like inflation or currency devaluation.
“The proliferation of SMLR, 21Cap, and many others, including NVDA deciding they need to derisk their balance sheets by rerisking on BTC—even as it approaches the top decile of all-time prices,” Grant pointed to as evidence.
Simply put, even large institutions are choosing to take on the risk of Bitcoin’s price fluctuations as a potential offset to other, potentially larger financial risks.
Despite the excitement surrounding Bitcoin’s approach to $100,000, the true anticipation centers on its continuing development as an increasingly permanent component of the financial system.