
The post How High Can Bitcoin Price Go? Exploring the Correlation Between M2 and Bitcoin appeared first on Coinpedia Fintech News
A macroeconomic chart reveals that the M2 Money Supply is starting to rise again. Historical market patterns suggest that there is a correlation between the M2 Money Supply index and the Bitcoin price index. Crypto market watchers are now eyeing a potential all-time high for Bitcoin within this quarter, if historical correlations between M2 and crypto prices hold true. Here is what you should know.
M2 Money Supply on the Rise: What It Means
Analysing M2 is a way economists use to track all the money that is easily available in an economy. M1 is the most basic form of money, which includes cash and checking accounts. M2 is a broader measure, which includes everything in M1 plus savings accounts, money market accounts and certificates of deposit.
A macroeconomic chart, shared on X by renowned crypto analyst Michael van de Poppe, shows that the M2 money supply is starting to rise again.
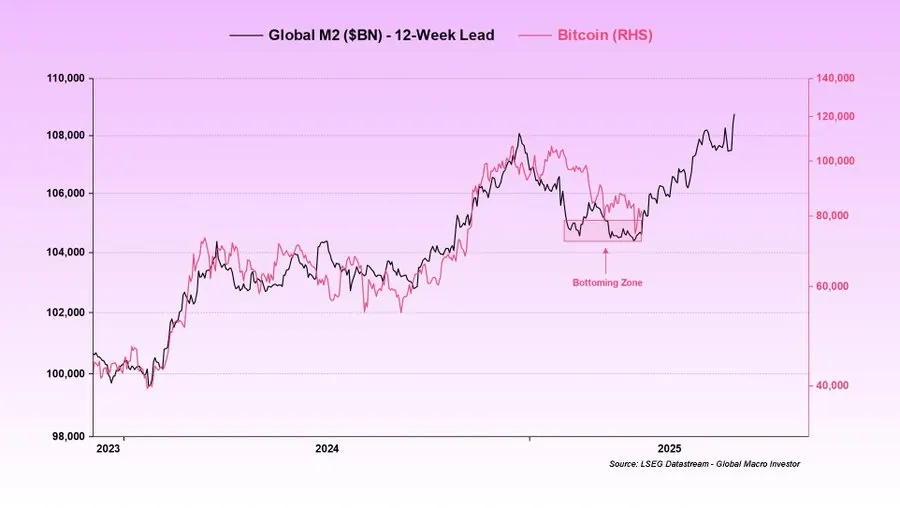
A sharp rise in the M2 money supply implies that there is a significant increase in the amount of easily accessible money in the economy.
Historical Correlation Between M2 and Bitcoin Prices
Historical market patterns indicate that there is a correlation between the M2 money supply index and the BTC price index.
When M2 increases, BTC tends to go up as well.
Currently, the Bitcoin market stands at $85,738.15. In the last seven days, the BTC market has surged by over 8%.
Can Bitcoin Hit a New All-Time High This Quarter?
Michael van de Poppe predicts that if this correlation between M2 and Bitcoin continues, Bitcoin may touch a new all-time high this quarter.
Last time, while Bitcoin was inching towards an all-time high, the US was preparing to witness a political shift.
It was on January 20, hours before Trump’s inauguration, that the BTC market crossed the crucial $109K mark. Since January 21, the BTC market has declined by over 19.28%.
Ripple Effect: How Other Assets Might React
This crypto analyst also warns that if BTC rises with M2 supply, the global economy could see several unusual developments: decreasing bond yields, falling gold prices, declining dollar index, increasing CNH/USD, and rising altcoins.
The US 5-year Bond Yield sits at 4.021%, 10-year at 4.384%, 20-year at 4.862%, and 30-year at 4.821%. Since the start of this month, especially after the announcement of Trump’s tariffs, all these bond markets have seen steady growth.
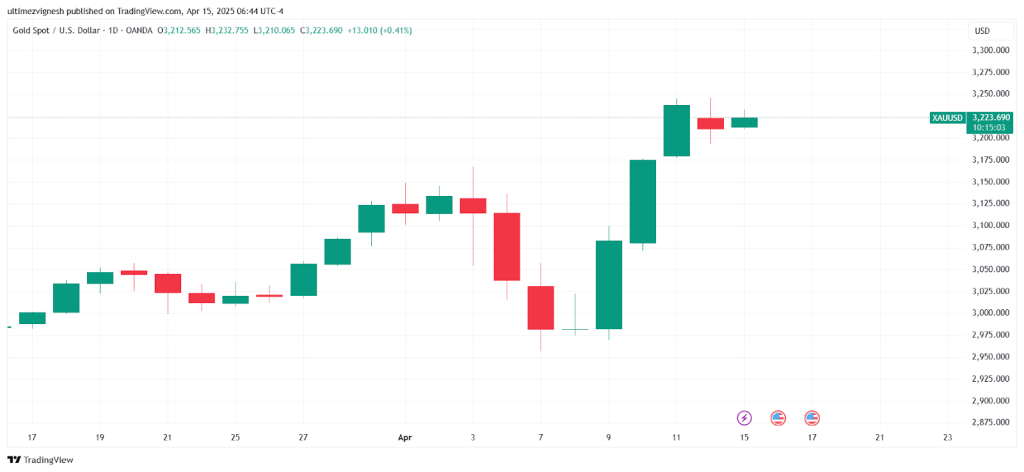
Similarly, the Gold Spot market, which is currently priced at $3,222.885, has grown significantly during the period. On April 11, the market even touched an ATH of $3,244.
In conclusion, while a rising M2 supply brings renewed optimism for Bitcoin and the broader crypto market, investors must remain cautious. Correlations can shift and macroeconomic events may change course quickly. As analysts warn of ripple effects across asset classes, it is crucial to monitor the evolving data closely, Whether this is the start of a new rally or a temporary spike, the coming weeks will be decisive for BTC’s direction.
Never Miss a Beat in the Crypto World!
Stay ahead with breaking news, expert analysis, and real-time updates on the latest trends in Bitcoin, altcoins, DeFi, NFTs, and more.