Hedera (HBAR) is on the move, climbing more than 8% on Friday and extending its seven-day gains to an impressive 21.7%. This rally comes alongside rising momentum signals, including a surging BBTrend and an RSI that has pushed into overbought territory.
Price is also nearing a key resistance zone, backed by bullish EMA alignment that suggests the uptrend may still have room to run.
Hedera’s BBTrend Is Soaring – What Does it Mean?
Hedera’s BBTrend indicator has surged to 6.83, up sharply from just 1.5 two days ago. This jump signals a significant increase in volatility and momentum in the price action.
BBTrend, short for Bollinger Band Trend, is a metric derived from Bollinger Bands that measures the strength and direction of a trend. Values below one typically reflect a weak or flat market, while values above 3 indicate the emergence of a strong trend.
A sudden rise in BBTrend often suggests that the asset is transitioning out of a low-volatility phase and entering a more directional move.
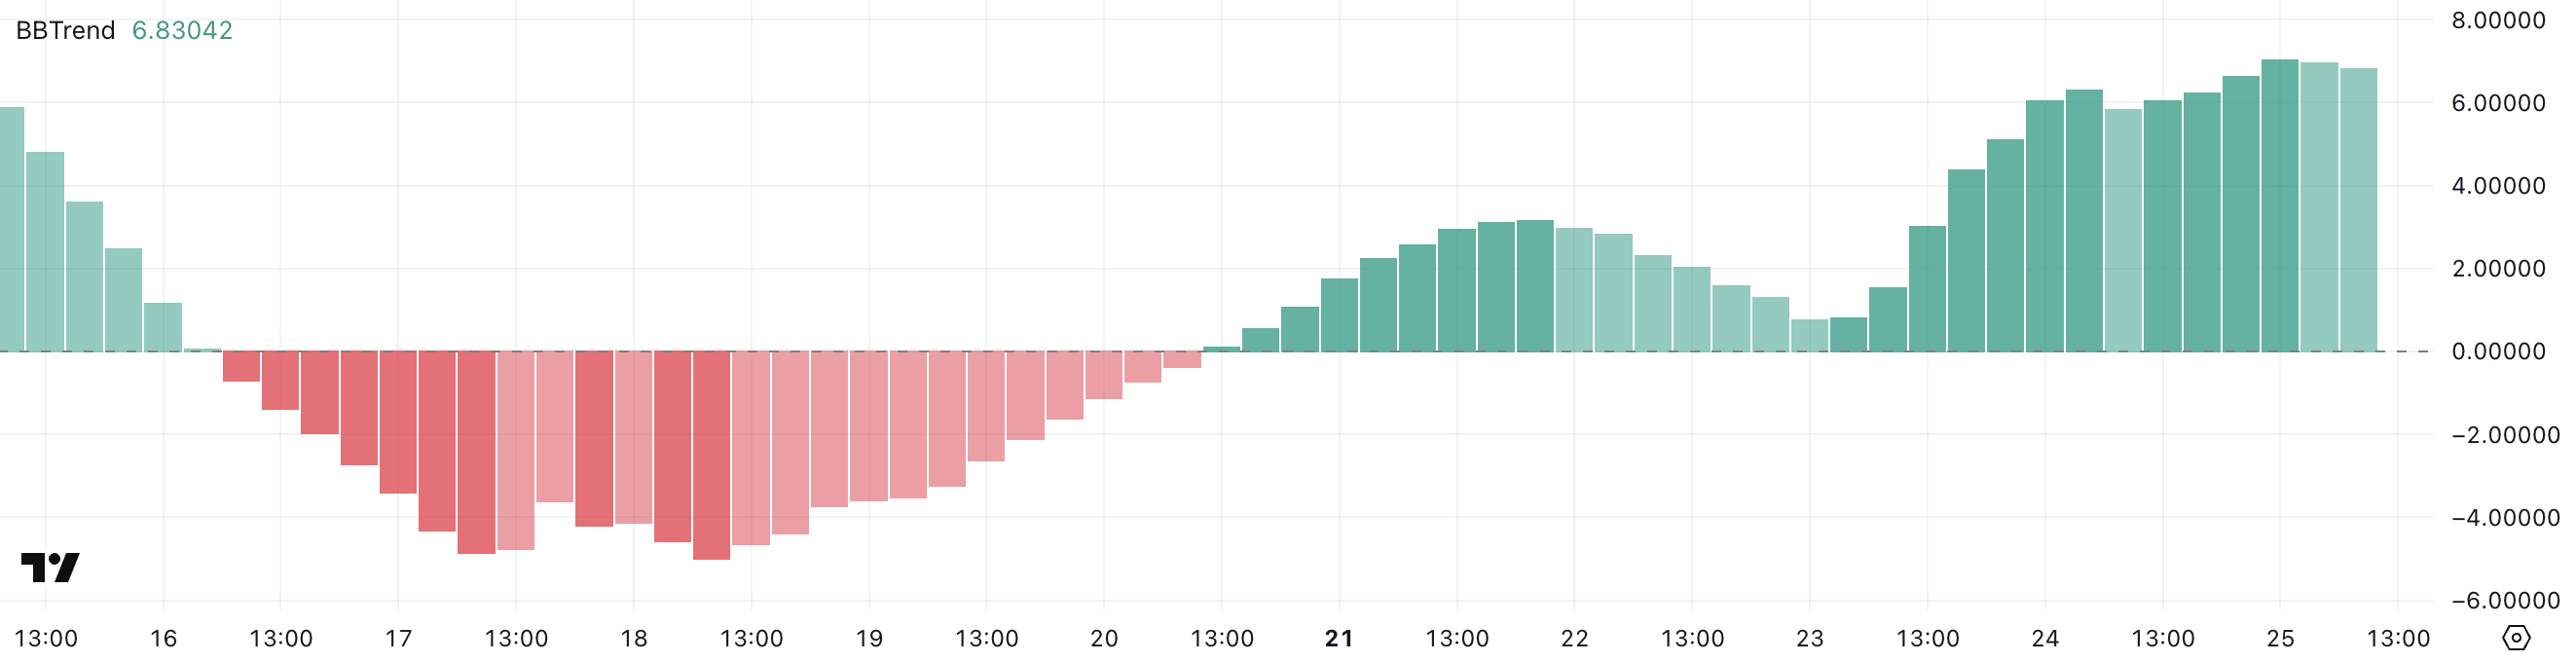
With BBTrend now at 6.83, Hedera may be in the early stages of a strong bullish or bearish breakout. Such elevated levels suggest that volatility is expanding quickly, and price is starting to move decisively away from its recent range.
While BBTrend doesn’t indicate direction on its own, when combined with other bullish signals, like rising price or volume, it can confirm the start of a sustained uptrend.
Traders will watch closely to see if this momentum continues or fades, as a reversal from such elevated levels could also lead to sharp pullbacks.
Hedera RSI Enters Overbought Zone—What Comes Next?
Hedera’s RSI has climbed quickly to 73.93, up from 52.49 two days ago, signaling a strong burst of buying momentum. The Relative Strength Index (RSI) is a momentum oscillator that measures the speed and magnitude of price movements.
It ranges from 0 to 100, with values above 70 typically considered overbought and those below 30 seen as oversold.
An RSI rising above 70 suggests that the asset may be overheating in the short term and could be due for a cooldown or consolidation.

With RSI now well into overbought territory, Hedera may be nearing a local top—at least temporarily. While a high RSI confirms strong bullish momentum, it can also signal that buyers are becoming exhausted.
If the price continues to rise without a pause, the risk of a pullback increases.
On the other hand, sustained overbought conditions can also occur during strong uptrends, so that traders will watch closely for either continued breakout strength or signs of reversal.
Hedera Nears Breakout—But Support Levels Are Key
Hedera’s EMA lines show a bullish alignment, with short-term moving averages positioned above the long-term ones—a classic signal of upward momentum.
HBAR price is also trading near a key resistance level at $0.20, which has acted as a ceiling in recent sessions. If buyers can push the price through this zone, the next resistance levels to watch are $0.227 and $0.258.
A strong uptrend continuation could even send HBAR to $0.287, marking its first break above $0.28 since February 1.
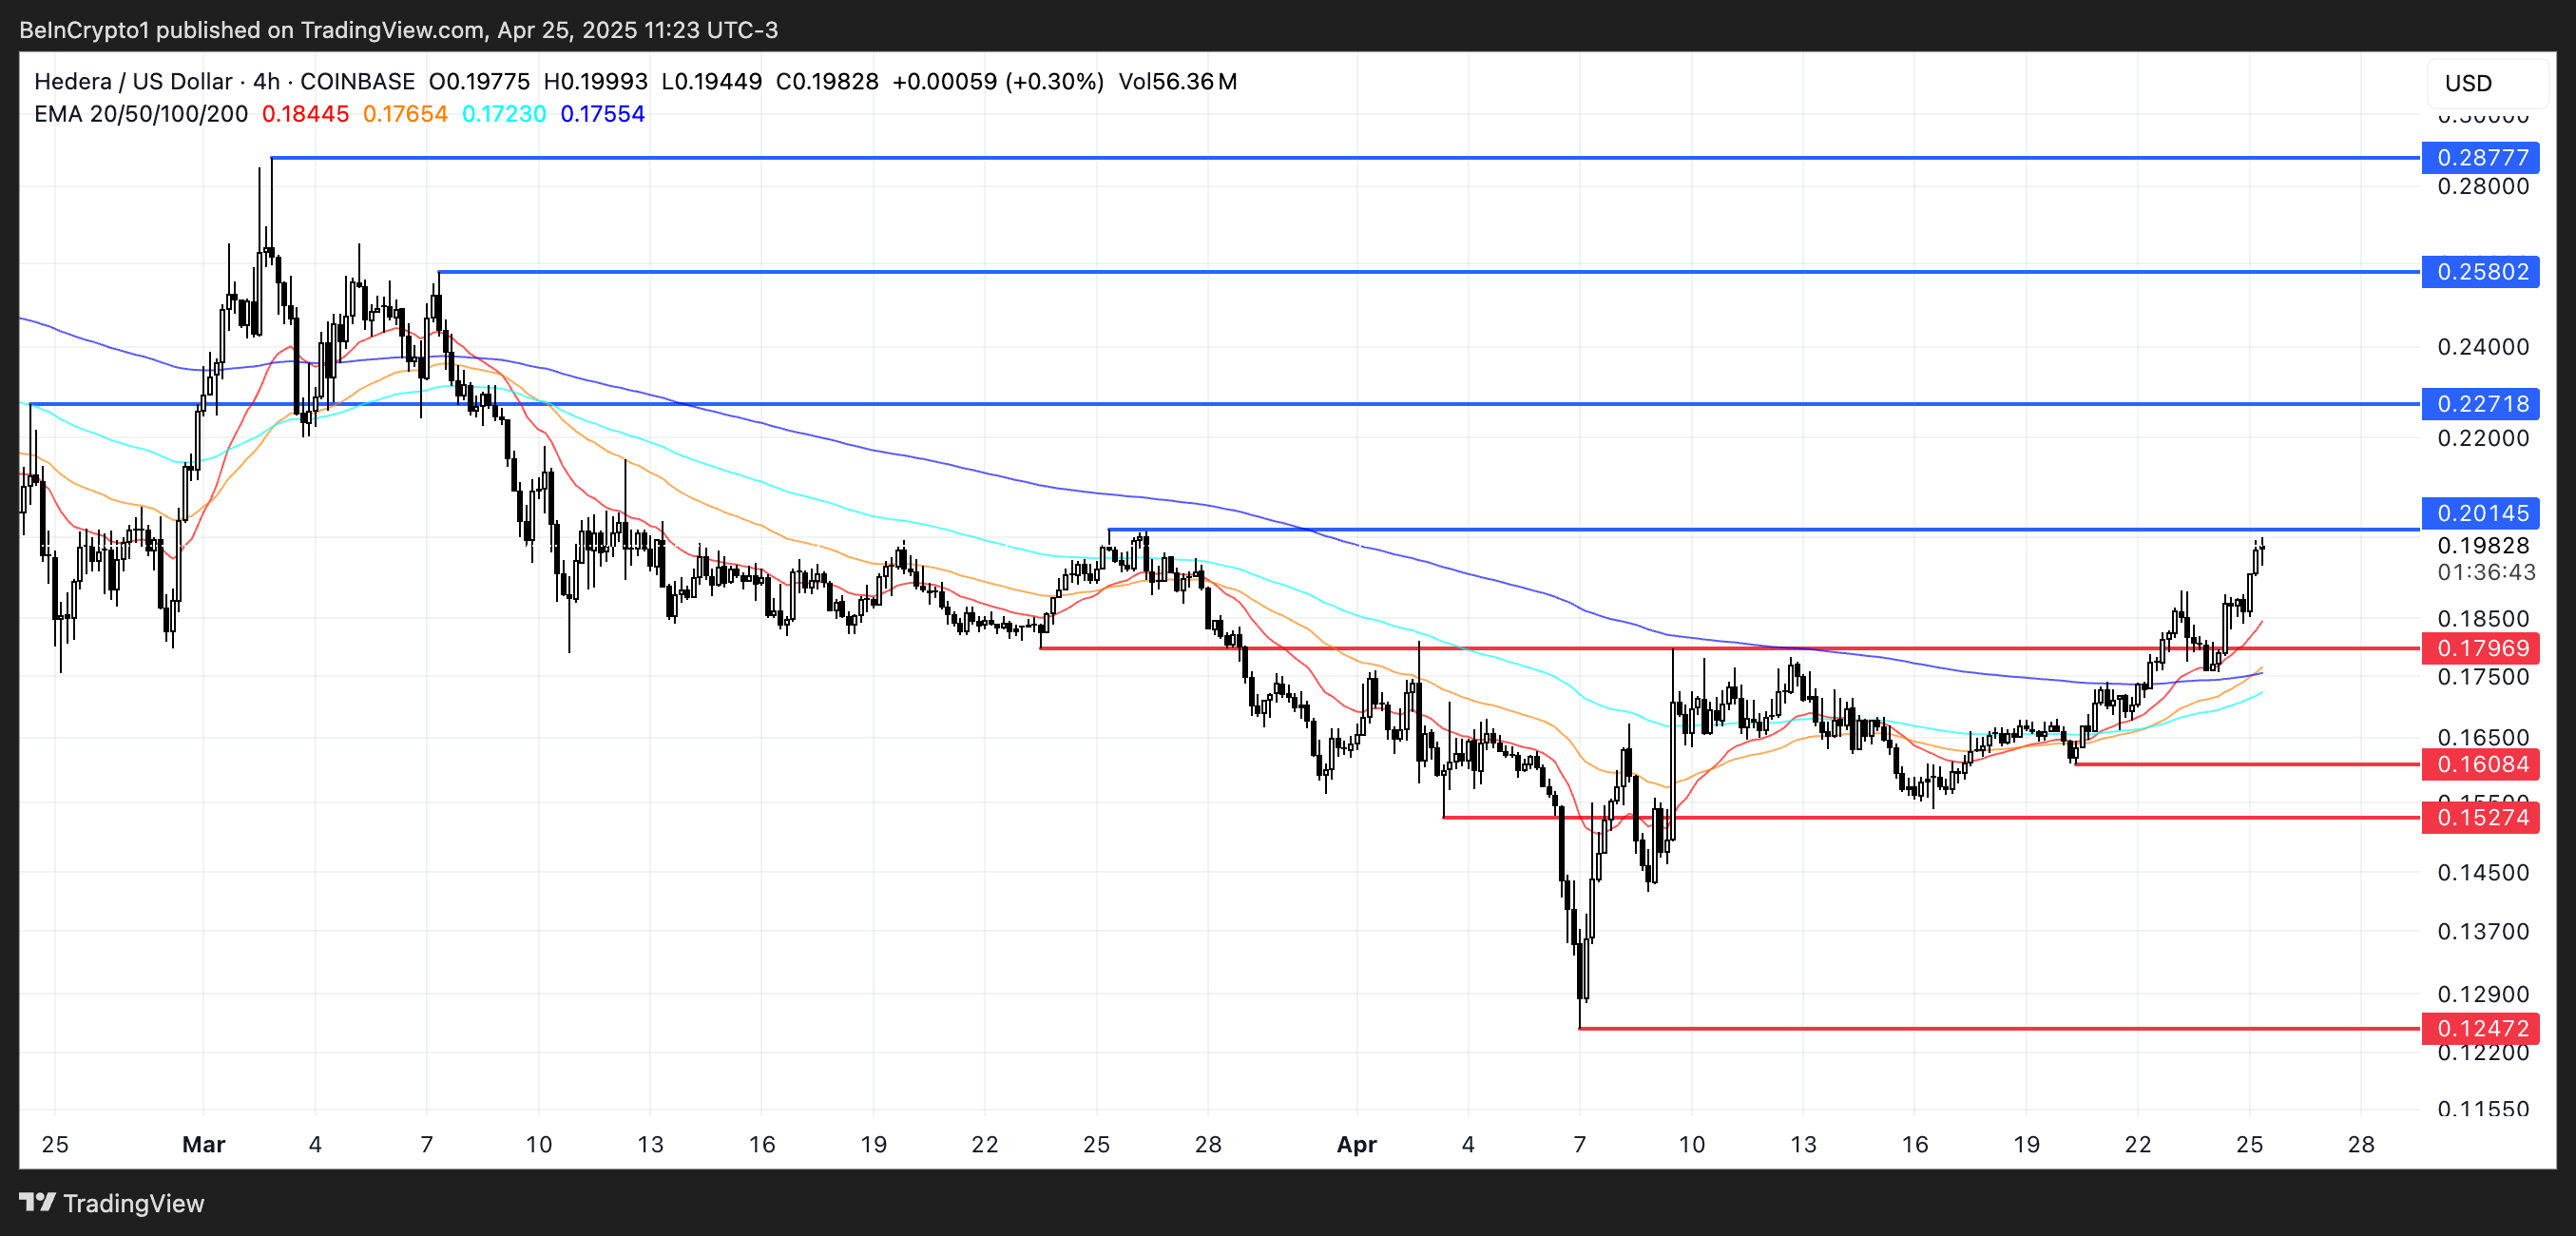
However, traders should also monitor the downside risk. If the support at $0.179 is tested and fails, it could trigger a deeper pullback.
In that case, HBAR may slide to $0.16 and possibly $0.152, both of which have served as prior support zones.
If bearish momentum accelerates, a drop toward $0.124 isn’t out of the question, making the current levels a critical battleground for short-term direction.
The post Hedera (HBAR) Surges 8% With Momentum Indicators Flashing Bullish appeared first on BeInCrypto.