Hedera (HBAR) is up more than 6% in the last 24 hours, showing renewed signs of strength across multiple technical indicators. Momentum is building, with the DMI suggesting buyers are starting to take control and the Ichimoku Cloud showing a clean bullish structure.
A potential golden cross on the EMA lines could further fuel the uptrend, opening the door for a breakout above $0.178 and possibly even $0.20. With sentiment improving and resistance levels in sight, HBAR is positioning itself for a key move after weeks of consolidation.
Hedera Signals a Potential Shift as Buyers Regain Momentum
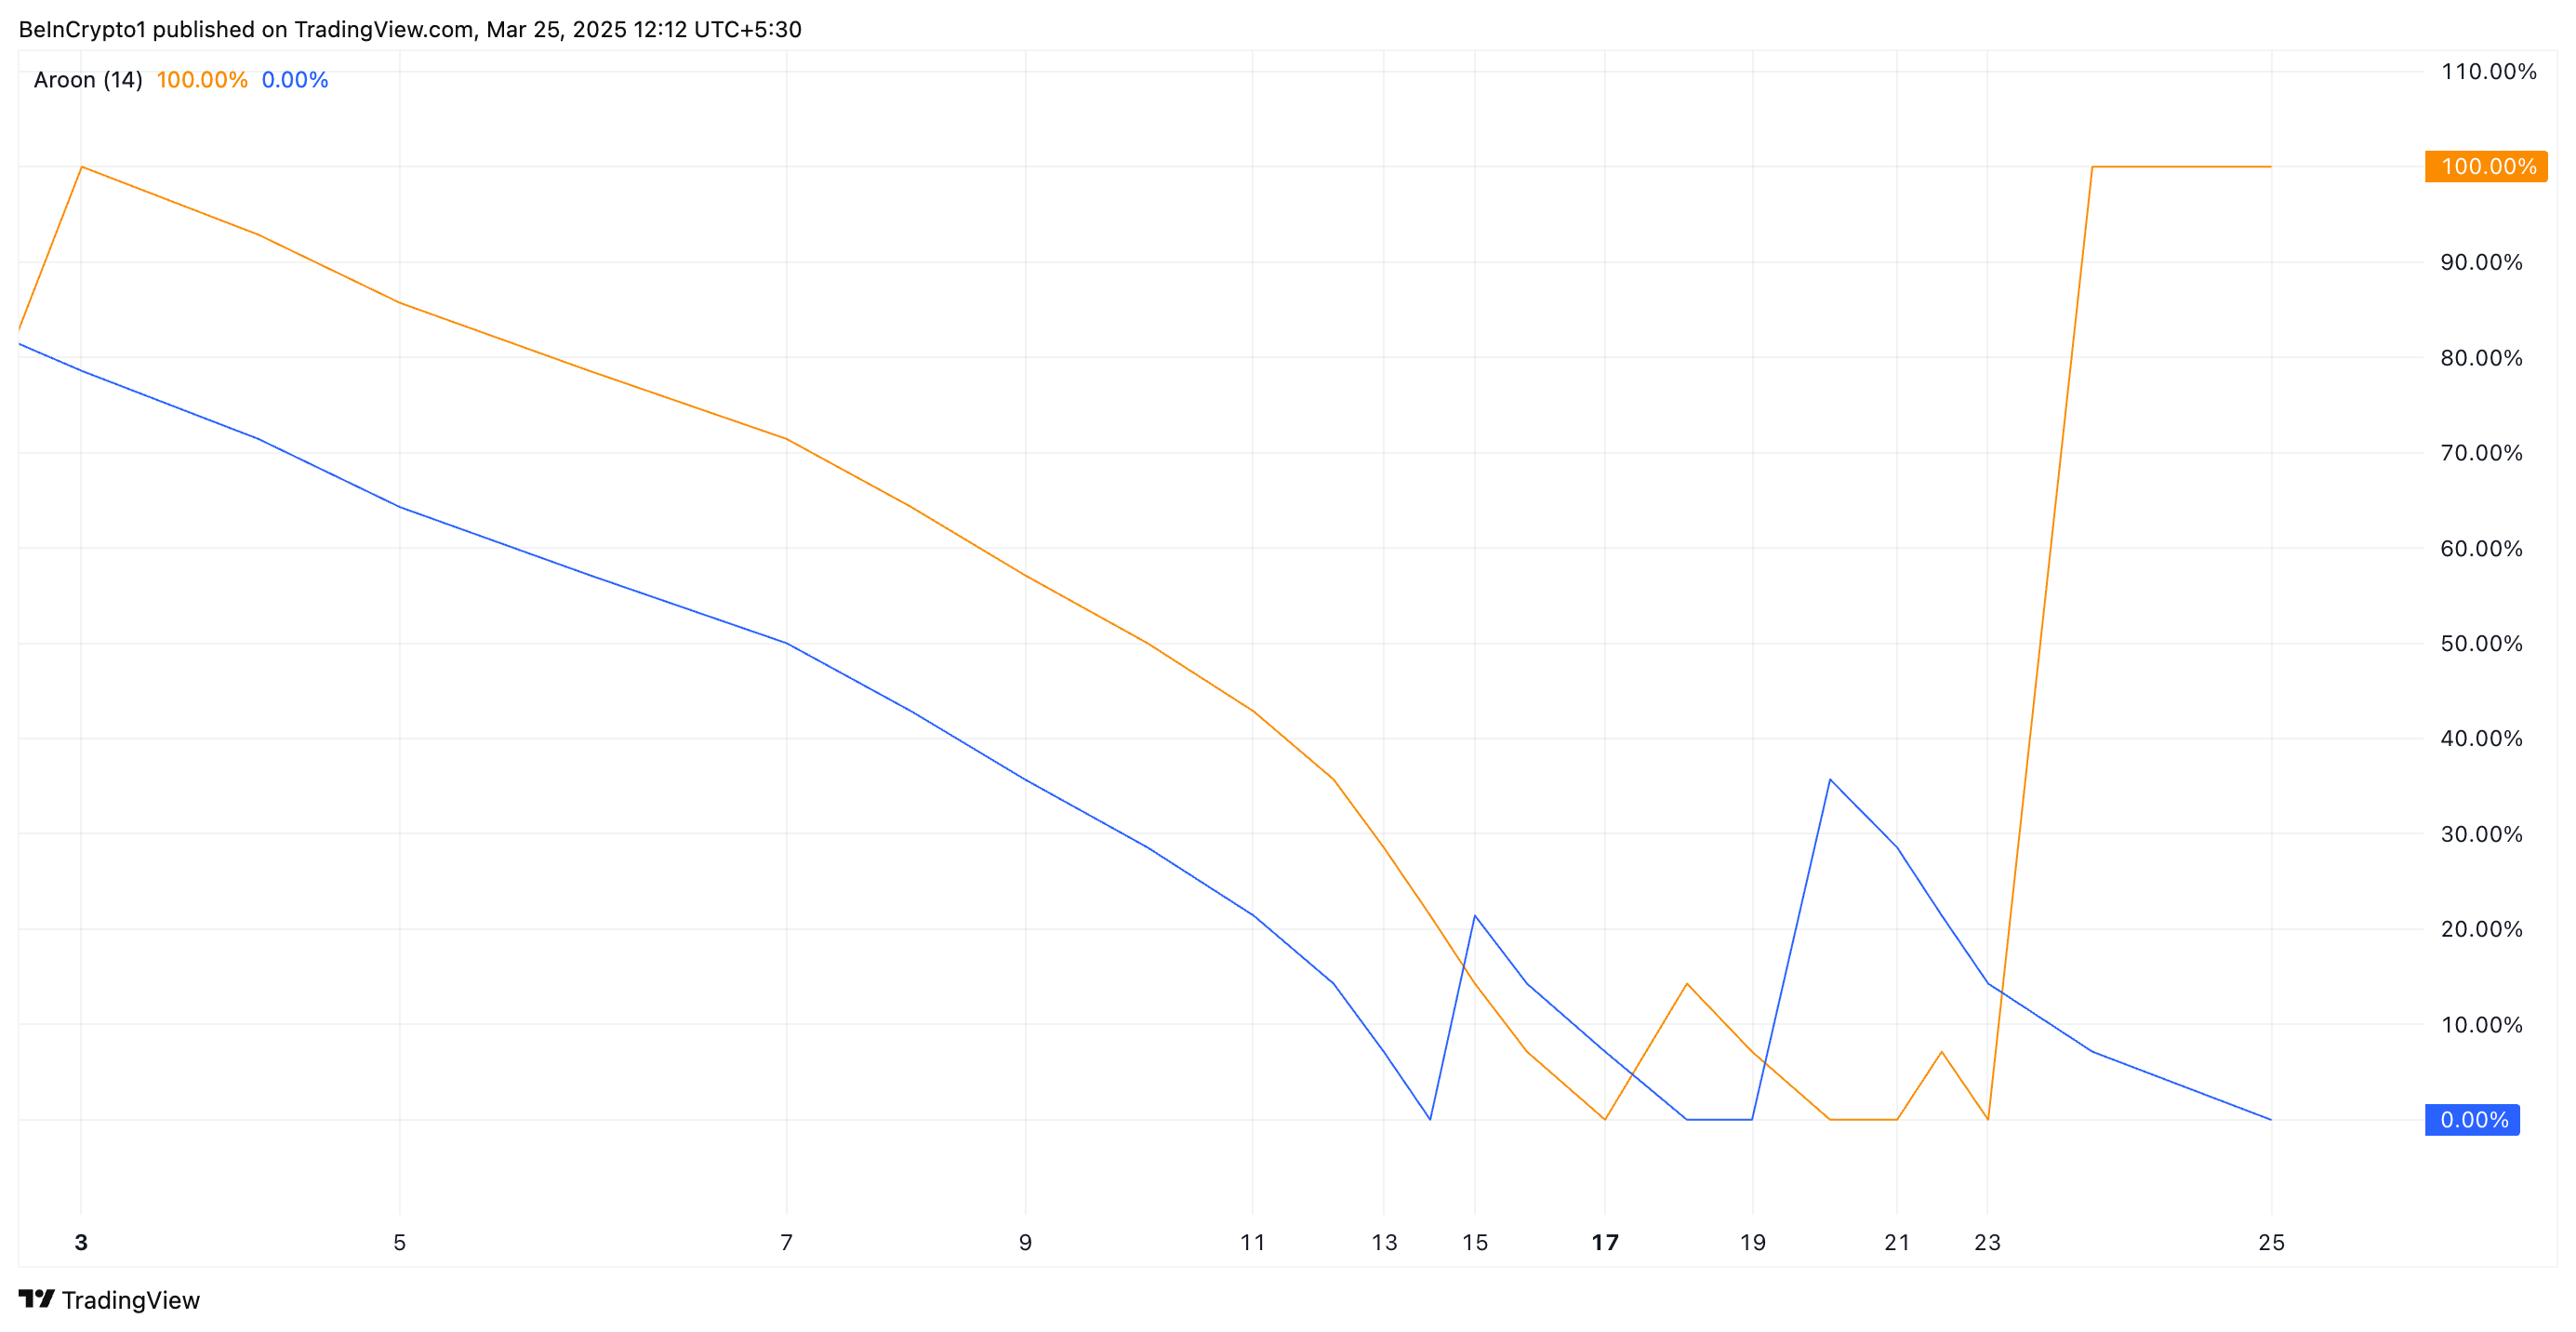
Hedera’s Directional Movement Index (DMI) is showing early signs of momentum building, with its ADX rising to 16.27, up from 13.54 two days ago.
The ADX (Average Directional Index) measures the strength of a trend, regardless of direction. Readings below 20 indicate a weak or sideways market, while values above 25 suggest a strong and sustained trend is forming.
With the ADX still under 20, HBAR isn’t trending strongly yet, but the recent increase points to a potential shift in momentum.

The +DI (positive directional indicator) is currently at 22.6 — up from 14.19 two days ago, though slightly down from 26.17 yesterday, and rebounding from 17.8 earlier today.
This shows buying pressure has picked up recently, even if there’s short-term fluctuation. Meanwhile, the -DI (negative directional indicator) has dropped to 13.24 from 17.54 yesterday, signaling weakening selling pressure.
Together, these movements suggest bulls are starting to take control, and if the ADX continues to rise above 20, it could confirm a strengthening uptrend for HBAR.
Hedera Maintains Bullish Momentum as Trend Structure Holds Firm
Hedera’s Ichimoku Cloud chart is currently flashing strong bullish signals. Price action is well above the Kumo (cloud), which indicates clear upward momentum.
The cloud has transitioned from red to green, signaling a shift in sentiment from bearish to bullish.
This transition often suggests that the current trend could sustain if no significant reversal emerges.
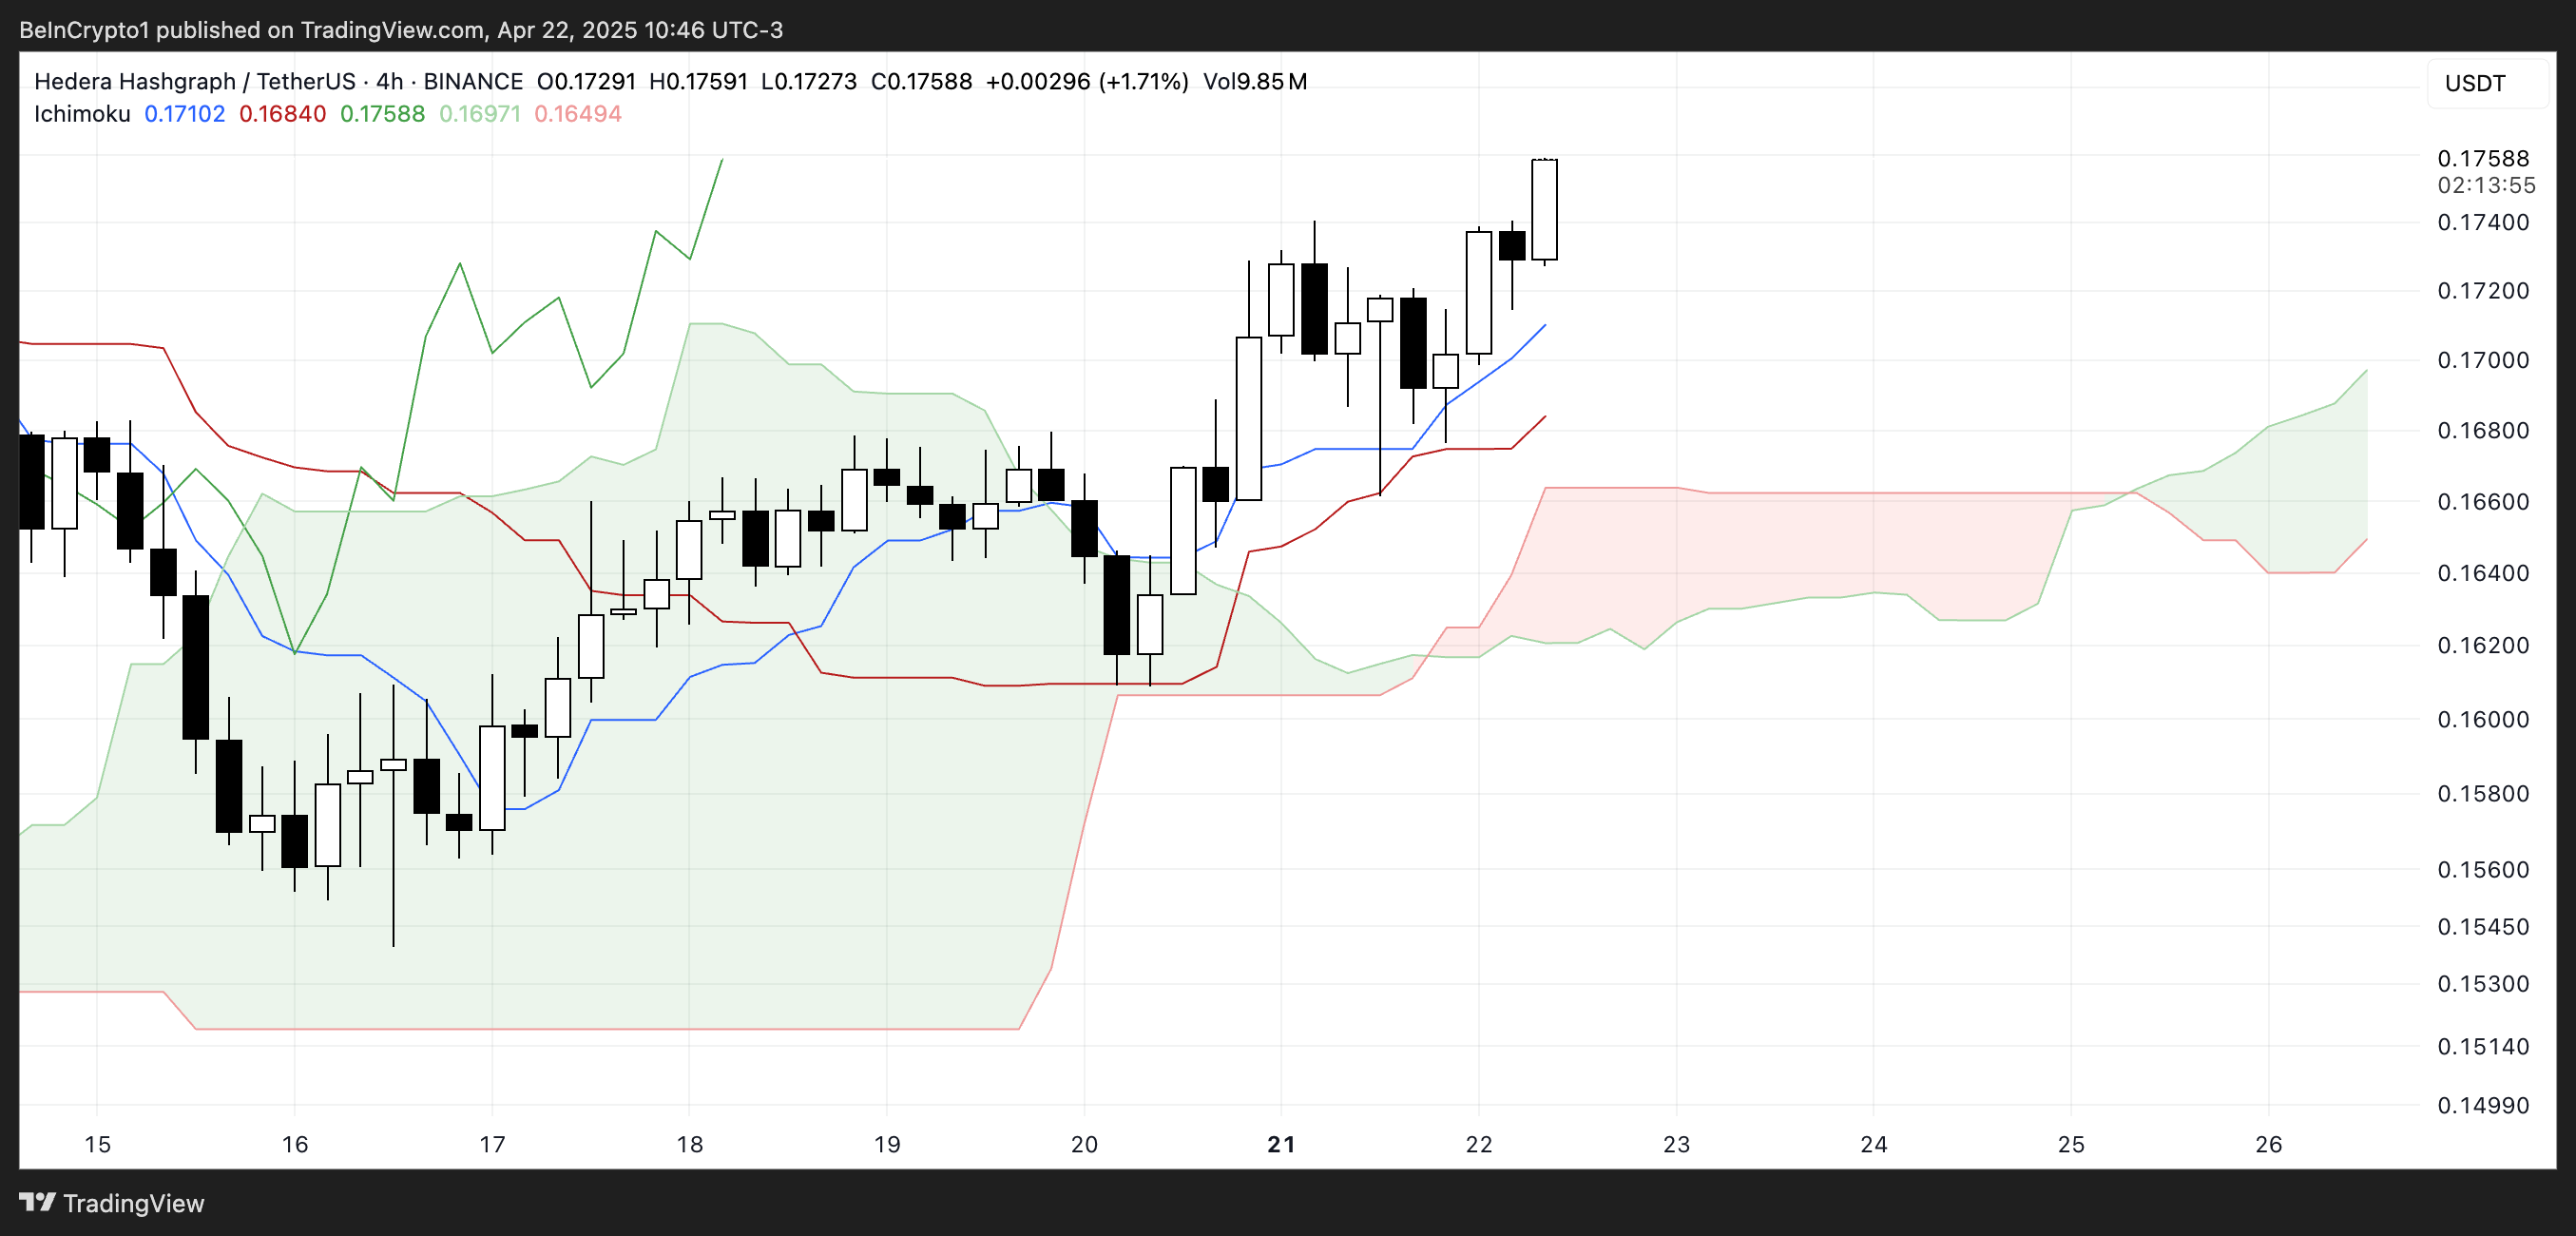
The Tenkan-sen (blue line) is positioned above the Kijun-sen (red line), reinforcing a short-term bullish bias. Additionally, the future cloud is sloping upward, hinting at continued strength ahead.
The Chikou Span (green lagging line) is also above the price candles and cloud, further confirming the alignment of all Ichimoku elements in favor of the bulls.
Unless the price breaks down below the Tenkan-sen or the cloud itself, the outlook remains positive.
Hedera Eyes $0.20 Breakout as Golden Cross Nears
Hedera’s EMA lines are showing signs of convergence, indicating that a golden cross could form soon — a classic bullish signal. If that happens, HBAR could break the resistance at $0.178, and if the uptrend continues, it may climb to test $0.20.
Should bullish momentum fully return, Hedera price could rise toward $0.258, marking its first move above $0.25 since early March.

On the downside, if HBAR fails to build momentum, it could retest support at $0.153.
A break below that level would weaken the structure and open the door to further losses, with $0.124 as the next major support.
The post Hedera (HBAR) Could Be Ready For A Rally According To These Indicators appeared first on BeInCrypto.