HBAR has recorded a 7% drop over the past week, underperforming the broader crypto market, which has shown signs of a mild recovery.
A closer look at the technicals paints a bleak picture, with key indicators suggesting the selloff may continue in the short term.
HBAR Bulls Step Back as Sellers Gain Ground
An assessment of the HBAR/USD one-day chart shows that the token’s Relative Strength Index (RSI) remains below the neutral 50 level and continues to trend downward. As of this writing, this momentum indicator is at 43.38.
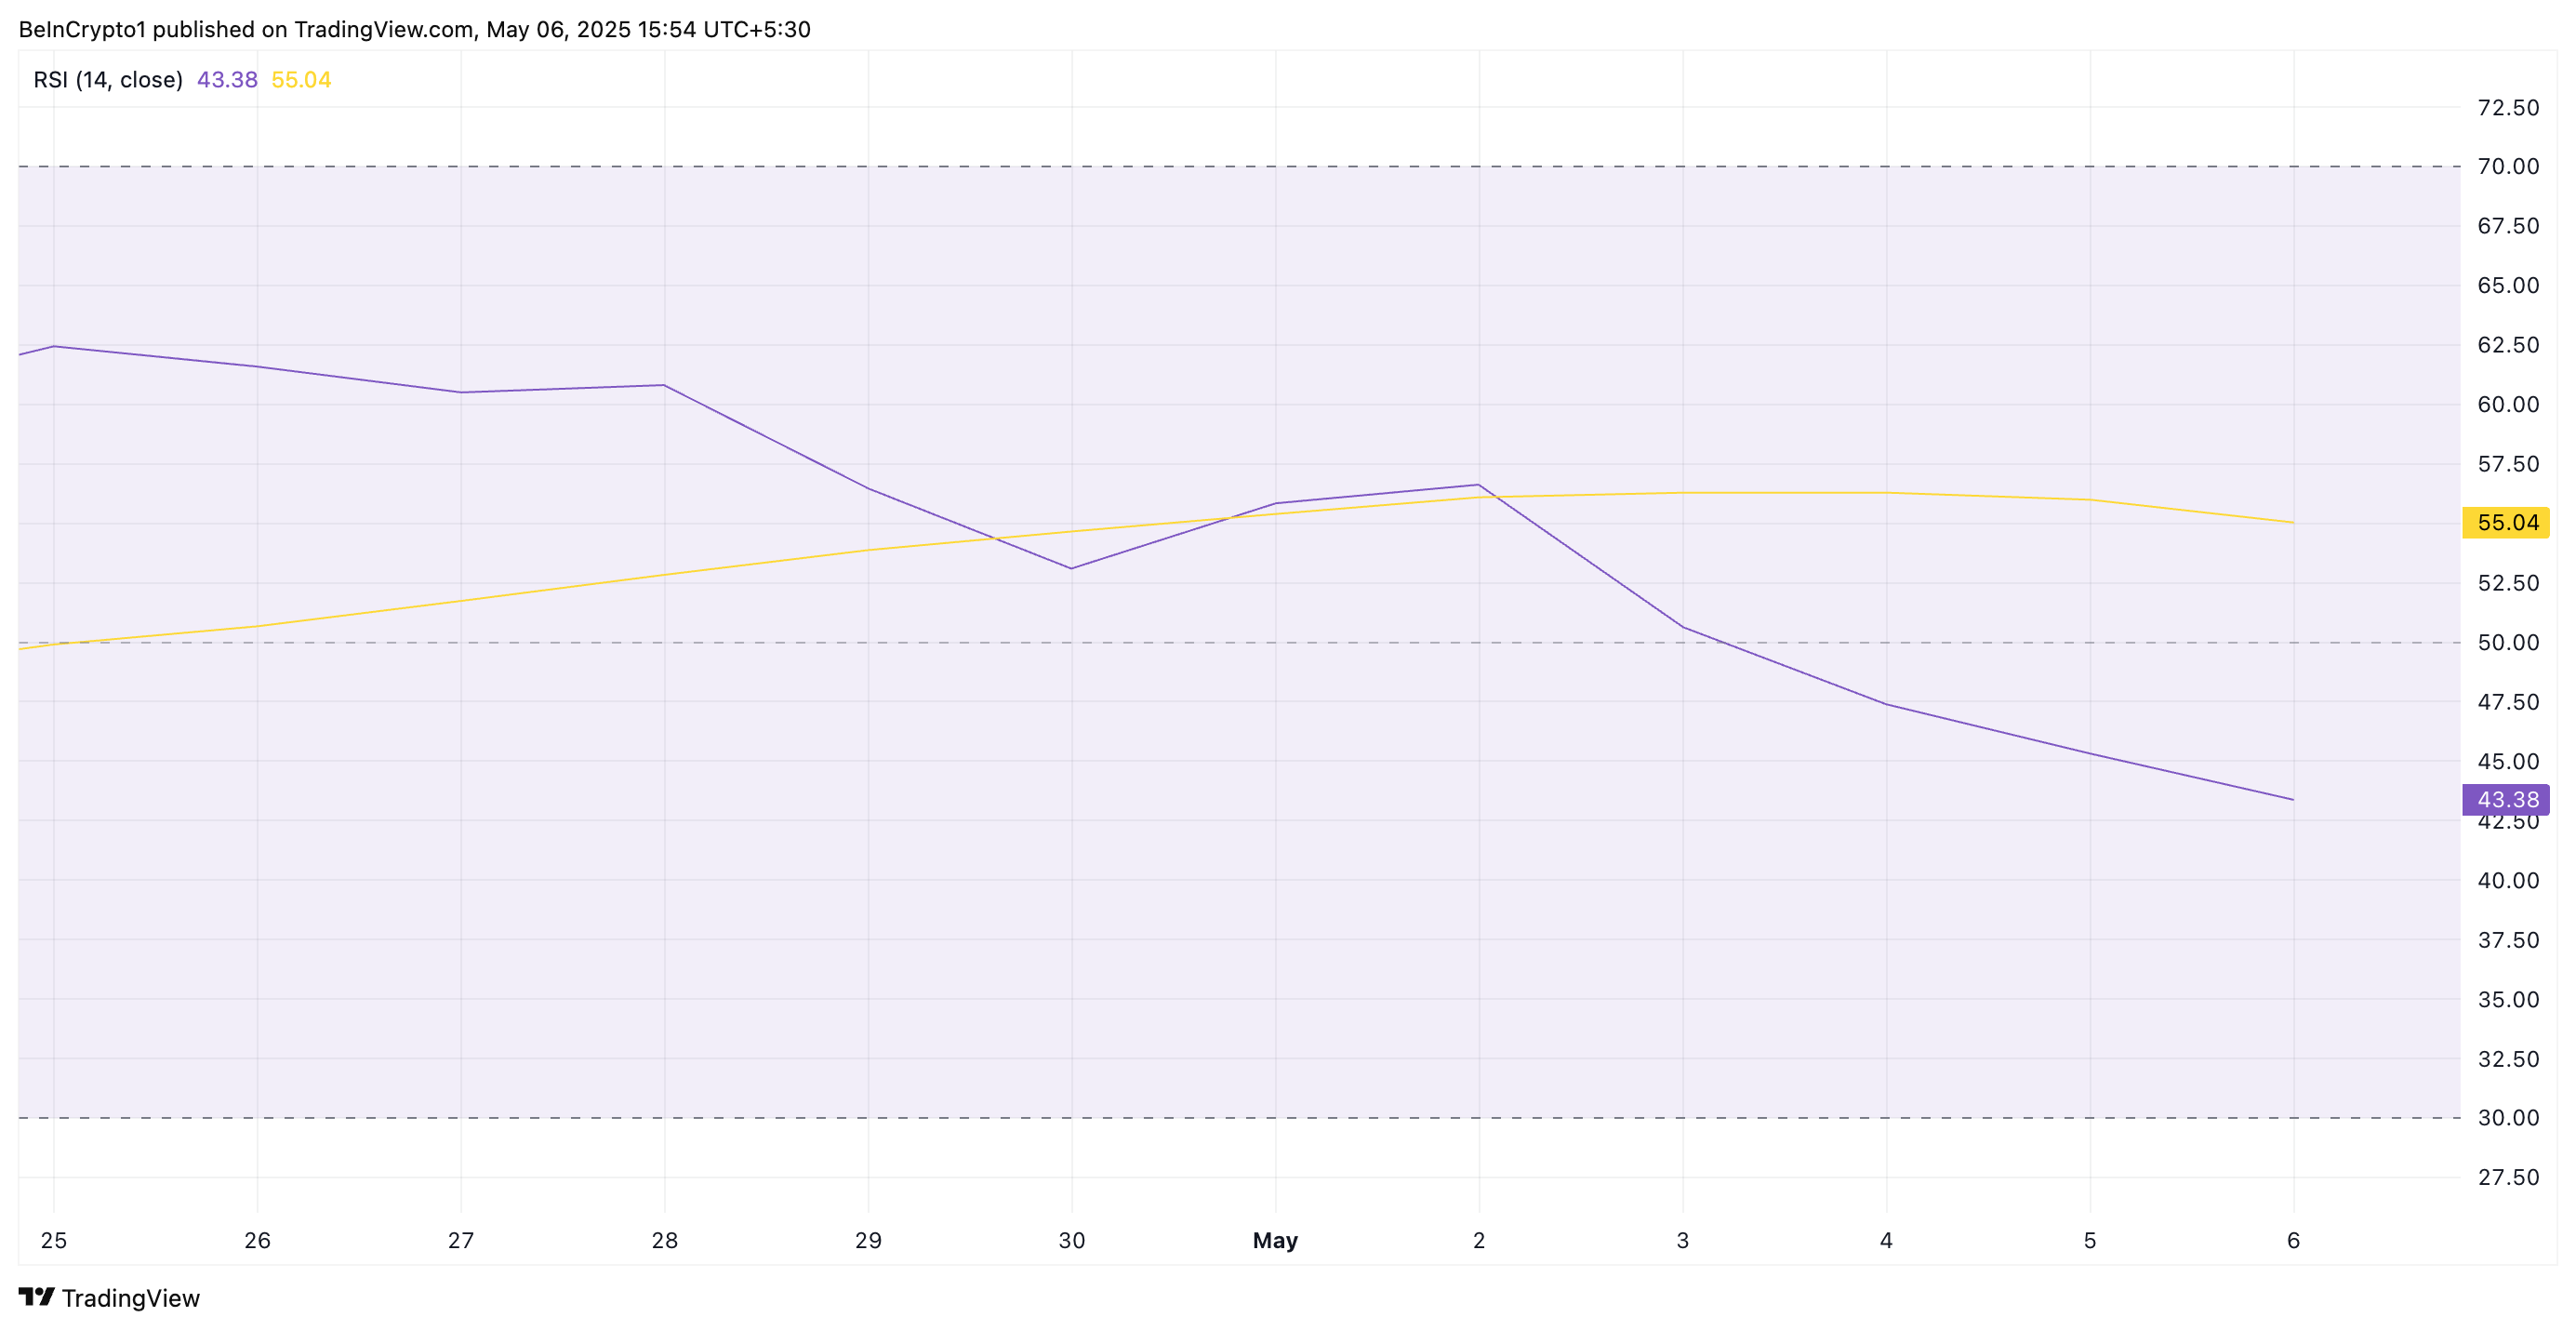
The Relative Strength Index (RSI) is a momentum indicator used to assess whether an asset is overbought or oversold. It operates on a scale from 0 to 100, with readings above 70 typically signaling overbought conditions and a potential price correction. On the other hand, values below 30 suggest the asset is oversold and may be poised for a rebound.
HBAR’s RSI reading signals growing bearish momentum. Its weakening value suggests that selling pressure is intensifying, reducing the likelihood of a short-term rebound.
HBAR’s Balance of Power (BoP) indicator, which currently returns a negative value of -0.27 at press time, further reinforces the bearish outlook.
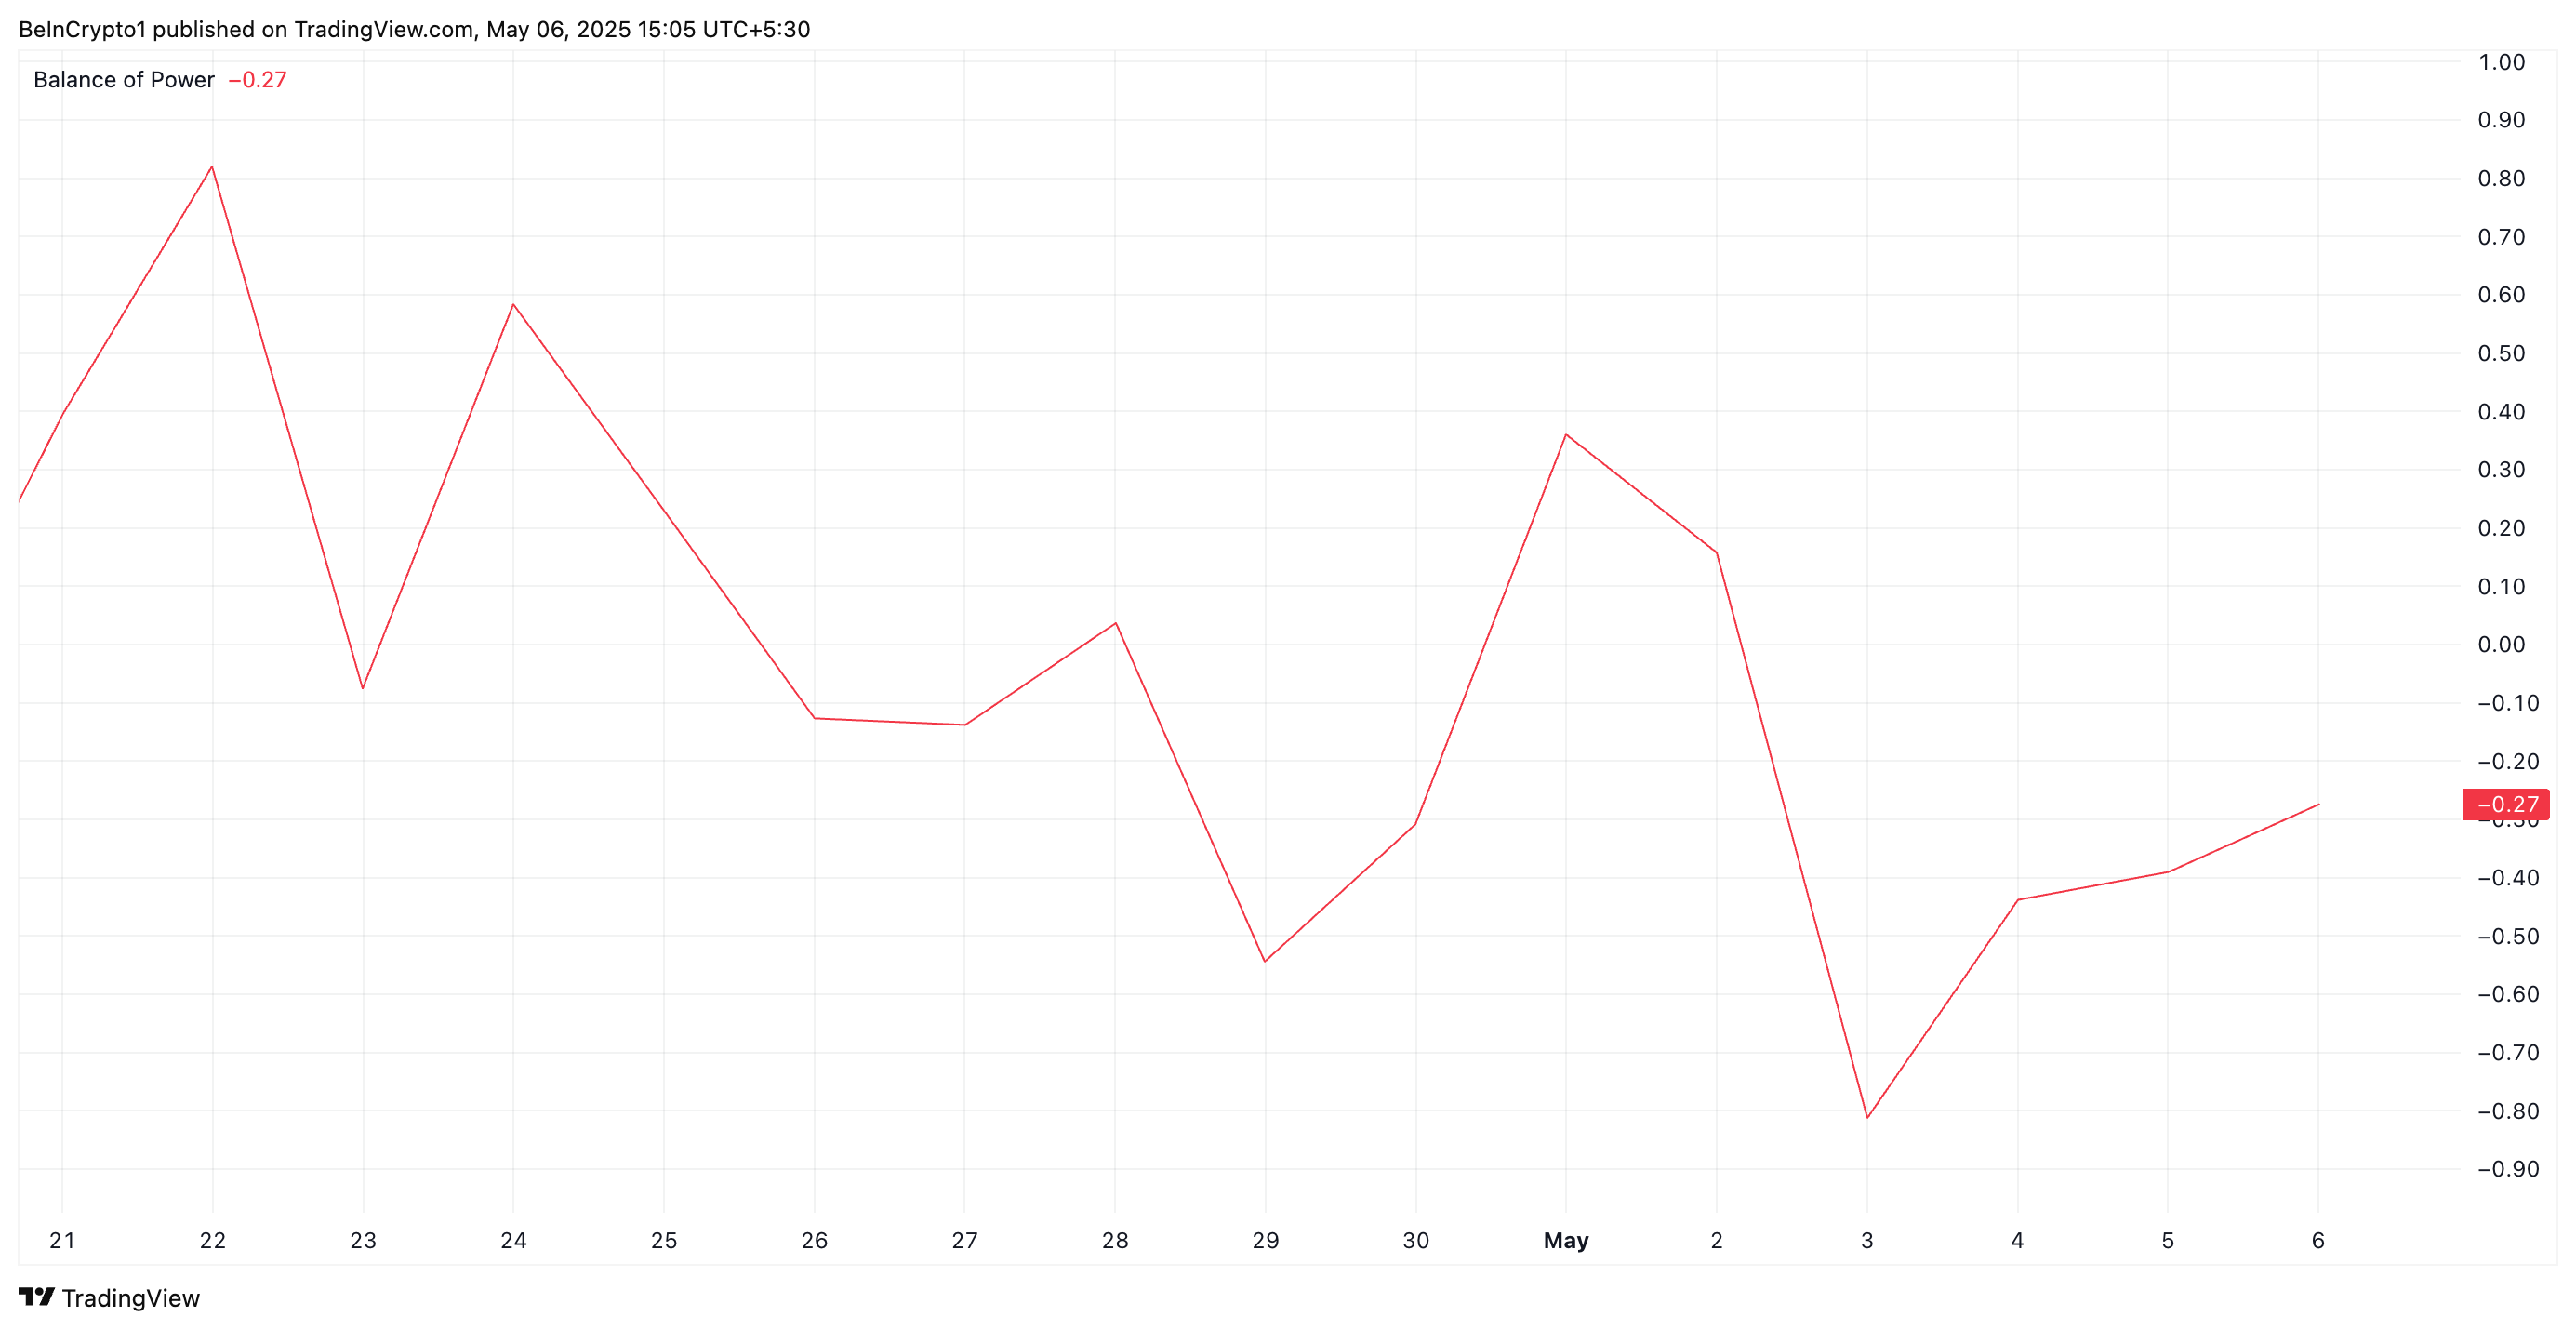
This indicator measures the strength of buyers versus sellers by analyzing price movement within a given period. When an asset’s BoP is negative, it indicates that sellers are dominating the market. This increases the likelihood of continued downward pressure on HBAR’s price in the short term.
HBAR Faces Downtrend Pressure
HBAR’s decline over the past days has caused it to trade below a descending trend line. This is a bearish pattern formed when an asset consistently makes lower highs over time, and those highs can be connected by a straight line sloping downward.
The longer the trend line holds, the stronger the indication that the asset is in a sustained downtrend. This pattern reflects a bearish market sentiment, where HBAR sellers gradually overpower buyers.
If this continues, it could push HBAR’s price further to $0.12.

However, a rally above the descending trend line could propel the HBAR token’s price to $0.19.
The post Hedera (HBAR) Bleeds 7%, More Pain Ahead as Bears Tighten Grip appeared first on BeInCrypto.