Last week, Satoshi Nakamoto, the unknown person who created Bitcoin (BTC), became the 11th richest person globally. Satoshi Bitcoin wealth hit $120 billion, thanks to the value of BTC they still hold. Satoshi Bitcoin Wealth Could Overtake Buffett and Zuckerberg’s Fortune Soon However, Bloomberg analyst Eric Balchunas pointed out that if Bitcoin grows by its usual 50% this year, Satoshi could soon pass billionaires like Warren Buffett. Next year, they might even catch up to Mark Zuckerberg, though Elon Musk still leads with a huge fortune. The idea of Satoshi Bitcoin wealth is mind-blowing because no one knows who they are. Unlike most rich people, Satoshi has never spent a single Bitcoin since creating the digital currency years ago. This reminds some of Jack Bogle, the man who started a famous investment company and left a lasting impact without cashing out big. The mystery around Satoshi adds to the excitement,… Read More at Coingape.com
Many cryptocurrency projects such as Aave, dYdX, Jupiter, and Hyperliquid have recently announced token buyback mechanisms.
Traditional stock markets inspire the token buyback strategy. But does this strategy help crypto projects build a sustainable economic model and contribute to increasing the price of their tokens?
The Booming of Crypto Projects’ Token Buyback Programs
Token buybacks occur when crypto projects repurchase their tokens from the market. These repurchased tokens can be held as reserves or even burned. In theory, buybacks reduce circulating supply, creating scarcity, which may drive up token prices. Although not a new strategy, BeInCrypto has observed that this trend is rapidly expanding.
For example, in early March 2025, the lending protocol Aave (AAVE) announced the implementation of a new Aavenomics. Aave will repurchase tokens to reduce supply and shift from staking rewards to a more sustainable liquidity model. This included a weekly AAVE token buyback worth $1 million for six months, funded by protocol fees.
In an ideal scenario, this buyback plan could reach a total value of $100 million (3% of the circulating supply).
“We consider it the most important proposal in our history, feel free to have a read and provide feedback,” said Marc Zeller, founder of the Aave Chan Initiative (ACI).
Also in March, the decentralized exchange (DEX) dYdX approved “Proposal #225” to buy back DYDX tokens. The protocol will use platform revenue for the buyback.
Other crypto projects like Hyperliquid (HYPE) and Jupiter (JUP) have similar plans. Estimates suggest Hyperliquid will repurchase $600 million worth of tokens annually, using 50-100% of transaction fees. This protocol dominates decentralized finance (DeFi) despite the market downturn.
These are just a few of the most typical crypto projects. Many other projects, including Gnosis, Gains Network, and Arbitrum, employ similar strategies. So, could this reshape the current cryptocurrency market?
What’s Driving This Token Buyback Trend?
Discussing this buyback strategy, an X (formerly Twitter) user commented:
“Buybacks create steady demand and reduce circulating supply, which can stabilize or even increase token prices.” commented Capitanike.
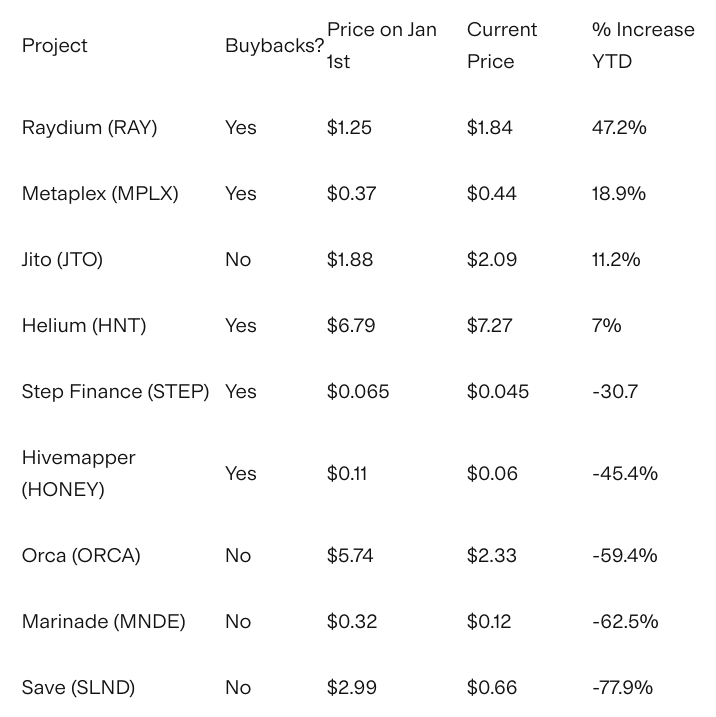
The fundamental economic principle of supply and demand is the key driver. By reducing circulating supply, crypto projects aim to increase token scarcity, which could push prices higher. According to SolanaFloor, projects with token buyback programs outperformed those without buybacks by 46.67% in 2024 (-0.6% vs. -47.15% YTD).
Performance of Projects with Token Buyback Programs Source: SolanaFloor
Secondly, the buyback can signal strong financial health for crypto projects. This is particularly effective in reassuring investors amid market volatility.
Thirdly, unlike the token burn strategy, many projects (such as AAVE and Gains Network) redistribute repurchased tokens to stakers or holders, aligning incentives. This approach could indicate the maturity of a project’s tokenomics model over time.
However, token buybacks are not without weaknesses. As this strategy becomes more widespread, regulators like the SEC may scrutinize it for potential manipulation or illicit activities.
Additionally, an improperly calculated buyback strategy could overly reduce token supply. If a project fails to balance new issuance or staking rewards, it might suffer from decreased trading volume. Moreover, buybacks could potentially mask financial weaknesses.
“What’s more plausible, in our opinion, is that these buybacks serve as proof that the projects raised too much during their ICO, are failing to develop anything useful, and don’t know what to do with their cash balances…” TokenData Research report.
The recent surge in crypto projects adopting token buybacks marks a significant evolution in tokenomics. While buybacks can enhance price stability, investor confidence, and ecosystem growth, they also carry manipulation risks and regulatory problems.
Pi Network (PI) has been down more than 8.5% in the last seven days. It has traded below $0.65 for six straight days but crashed below $0.60 today. The trend remains weak, with price action stuck below the Ichimoku Cloud.
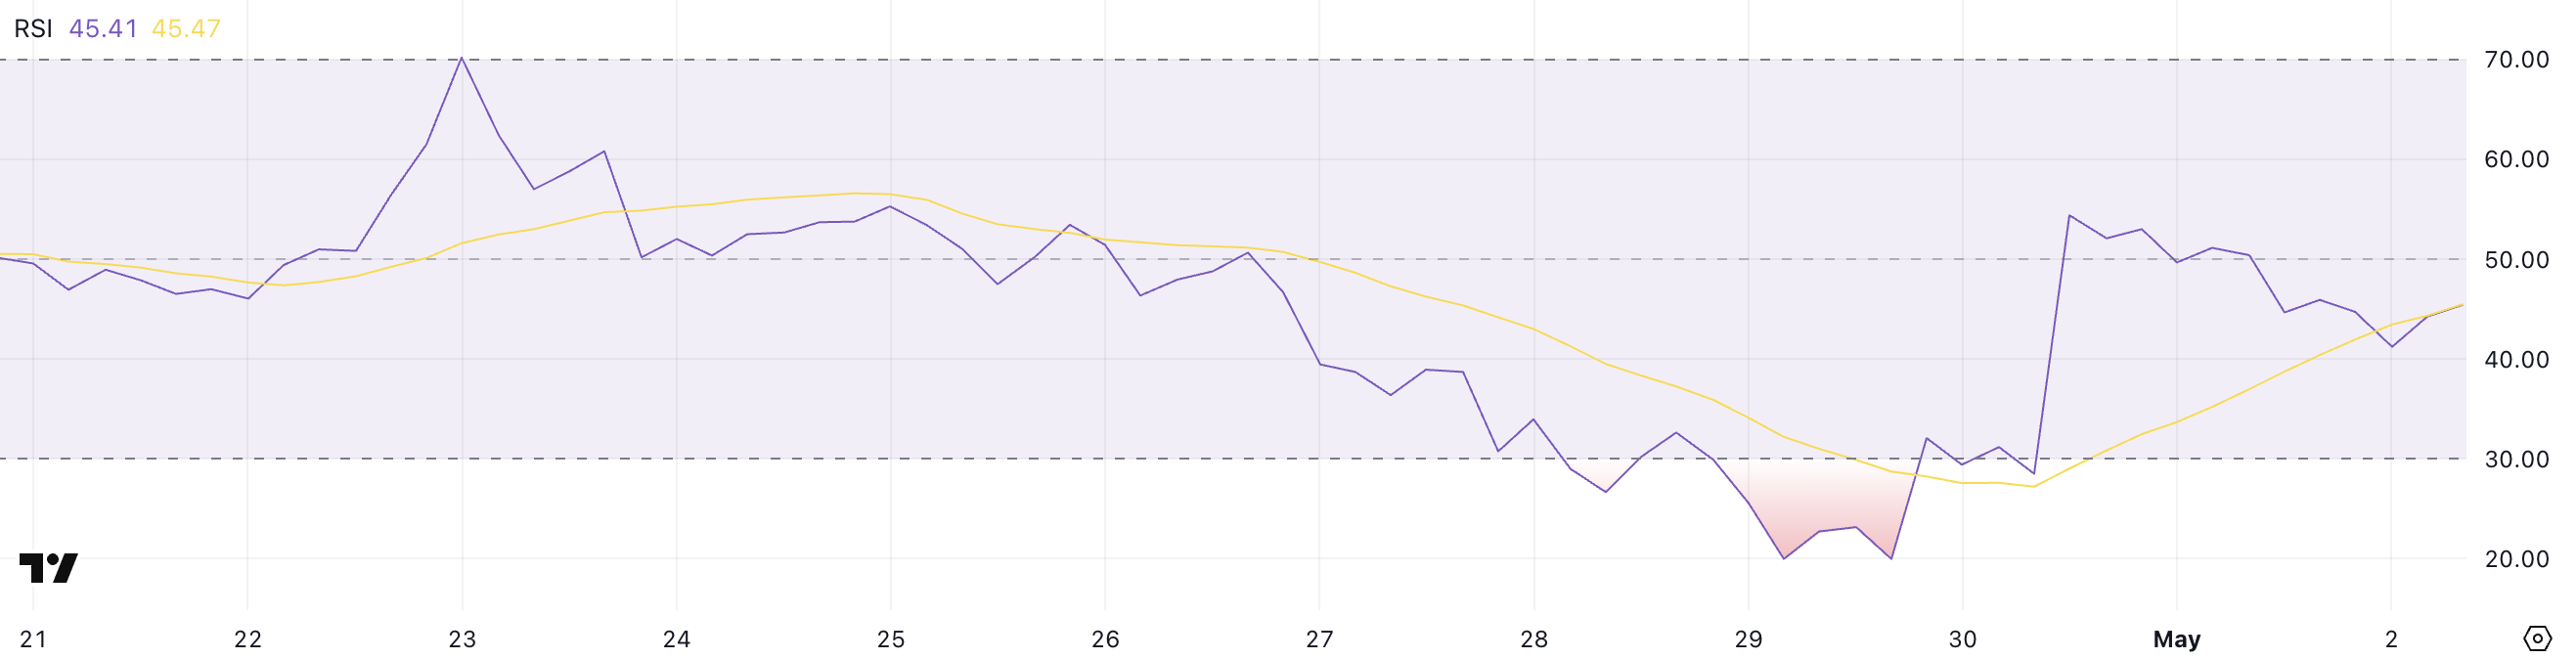
The altcoin’s RSI briefly went above 50 but has dropped back to 45, showing fading bullish momentum. EMAs are still bearish. It’s hovering just above key support, and the next move may decide between a deeper drop and a potential rebound.
Pi Network Faces Bearish Pressure Below the Ichimoku Cloud
Pi Network is still trading below the Ichimoku Cloud, signaling a bearish market structure overall. However, a potential shift may be developing, as the blue Tenkan-sen (conversion line) has recently crossed above the red Kijun-sen (base line).
This crossover is often seen as an early bullish signal, especially if confirmed by rising volume or a move into the cloud.
The Chikou Span (lagging line) is still below both the price candles and the cloud. This means any upside move has not yet been confirmed.
For a real trend reversal, PI must break into and above the cloud. The future cloud must also turn green, with all Ichimoku signals aligning bullishly.
Right now, the setup shows indecision. There’s a short-term bullish crossover, but the price is still under the cloud, and the broader trend remains bearish.
Pi Network Momentum Slows as RSI Dips Below 50
Pi Network’s RSI currently sits at 45.41, easing off after a sharp rally from 28.49 to 54.40 just two days ago. This indicates a slowdown in momentum following a brief period of recovery.
The pullback from above 50 suggests that buying pressure has weakened, and PI is entering a more neutral zone, where neither bulls nor bears are in full control.
The quick reversal also reflects uncertainty in the current price trend.
The Relative Strength Index (RSI) is a momentum oscillator ranging from 0 to 100, commonly used to identify overbought or oversold conditions.
Readings above 70 suggest an asset may be overbought and due for a correction, while readings below 30 indicate oversold conditions and potential for a bounce. Values between 30 and 70 are considered neutral, with 50 as the key pivot point.
PI’s current RSI at 45.41 is below that threshold, hinting at a slight bearish lean unless the metric turns back upward. If RSI continues to decline, it may reflect growing selling pressure and a risk of further price weakness.
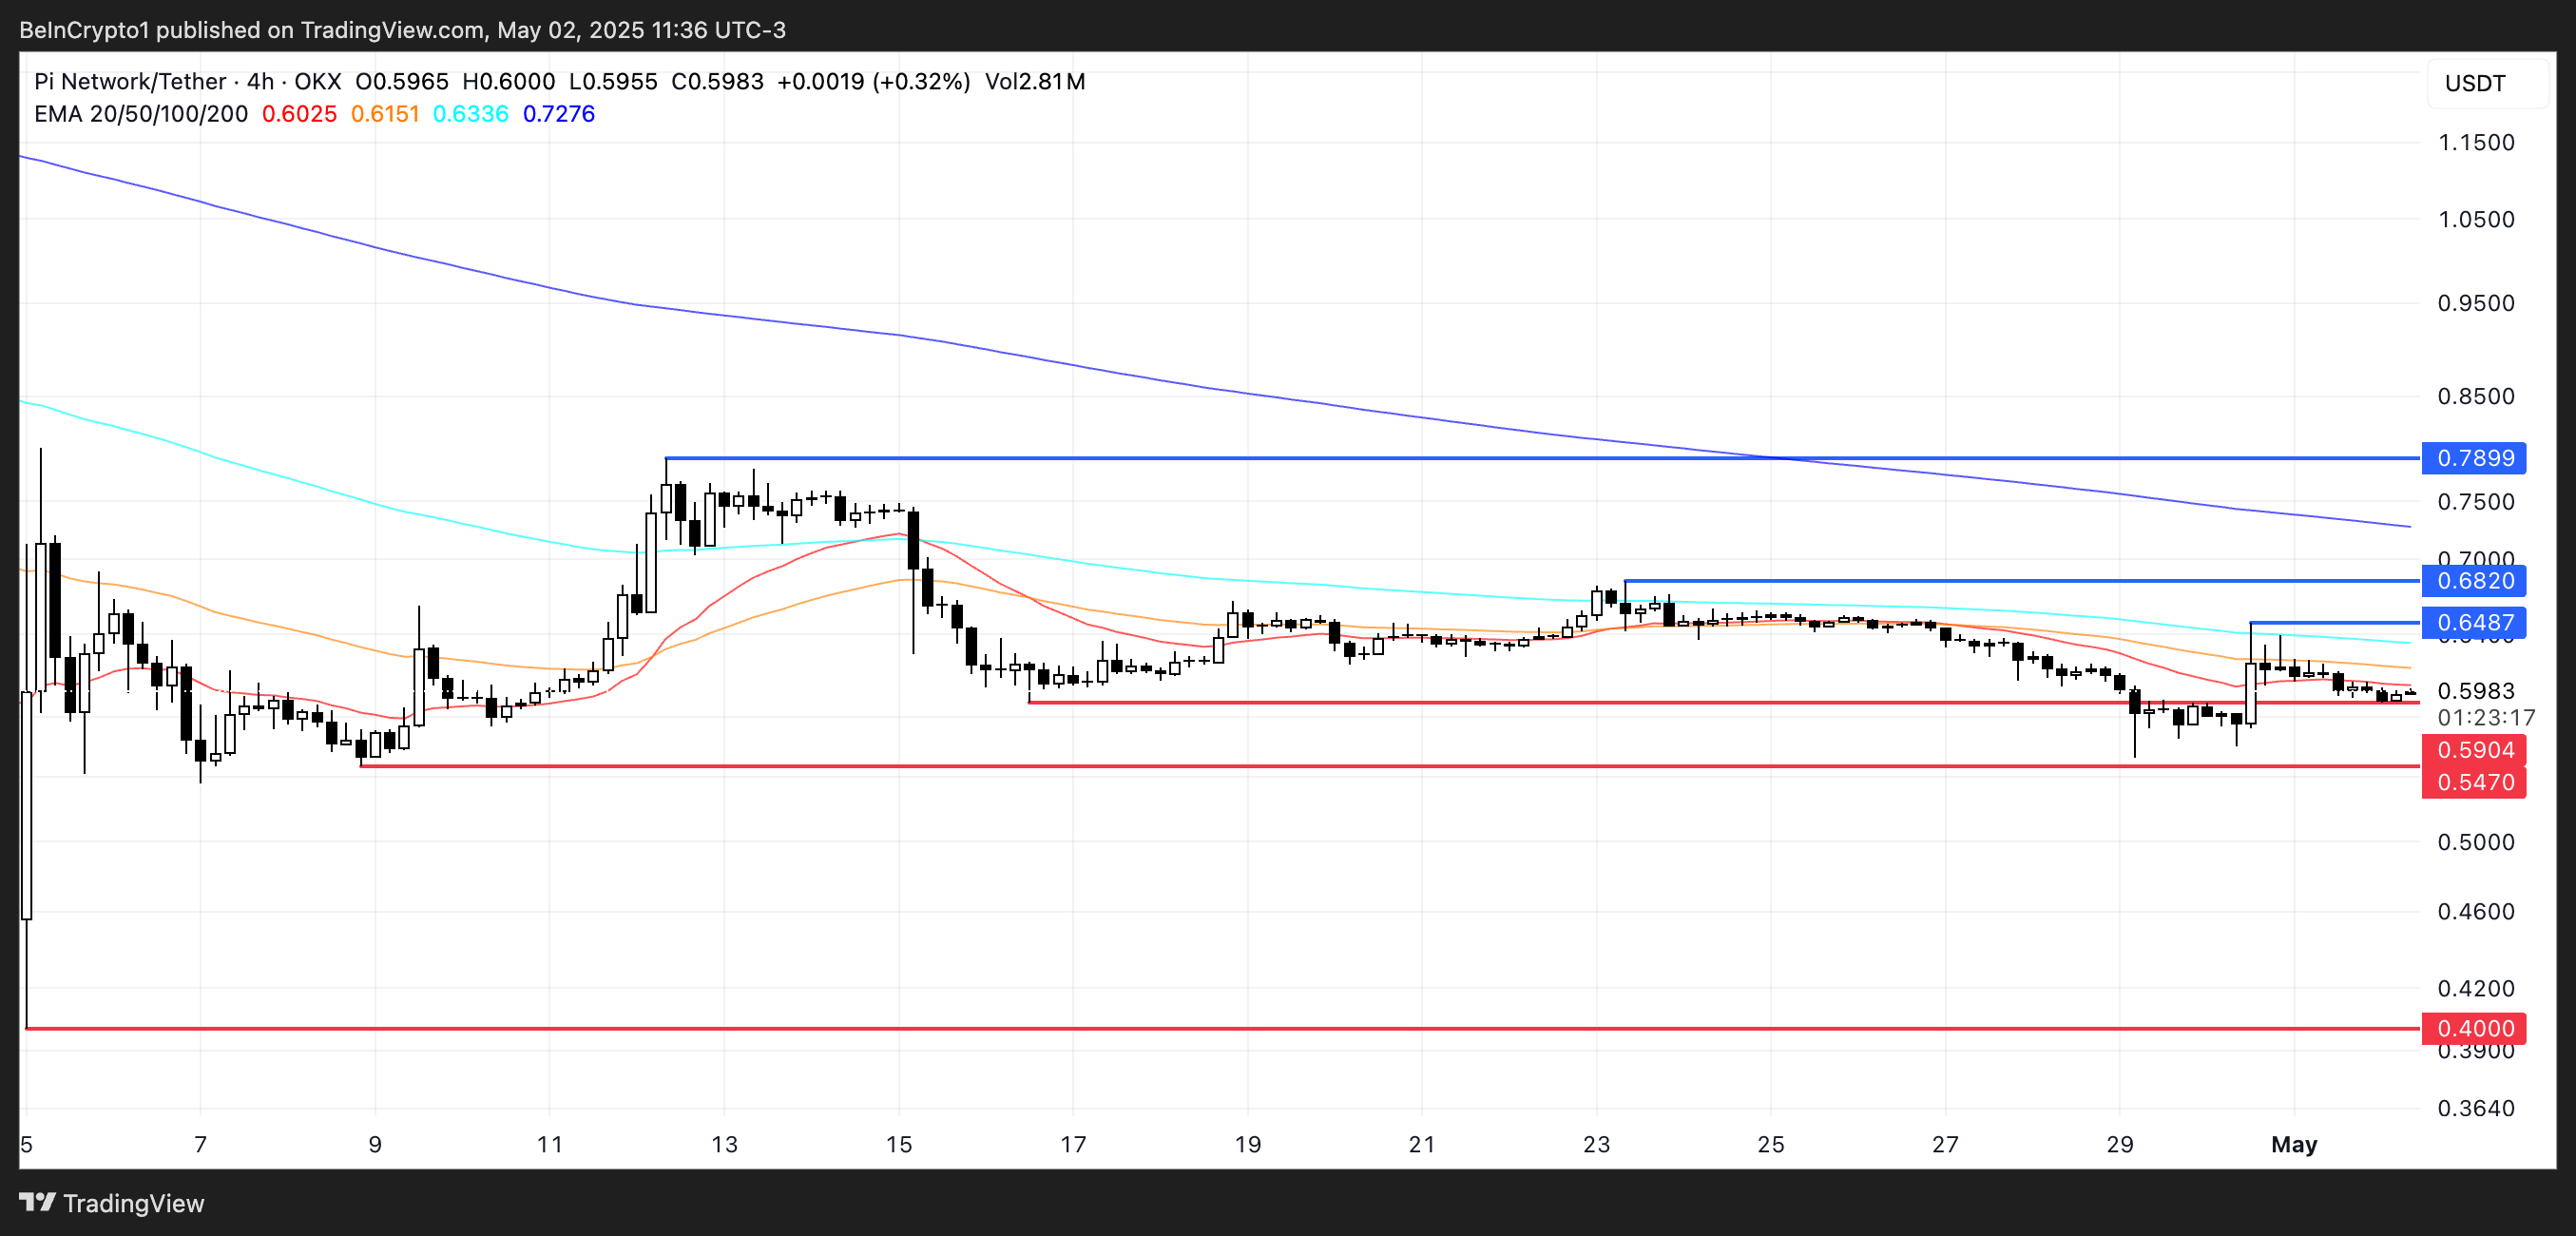
Pi Network Hovers Near Key Support With Bearish EMAs
PI price is trading just above a key support at $0.59, with bearish pressure building.
If this level is tested and broken, the next important supports lie at $0.547 and $0.40, potentially exposing the token to a deeper correction.
The Exponential Moving Averages (EMAs) remain in a bearish alignment, with short-term EMAs positioned below the long-term ones. This structure typically signals that the broader trend is still downward.
However, if the trend reverses and buyers step in, PI could climb to test resistance at $0.648, followed by $0.682.
A breakout above both—especially if supported by volume and a bullish EMA crossover—could push the price toward $0.789, signaling a shift toward a more sustained uptrend.
After months of decline, Solana meme coins are regaining bullish momentum. Daily trade volumes are increasing dramatically, and most of the leading tokens are posting notable price gains.
The increasing network activity is also helping Solana to recover after a 12-month low. Most recently, pump-and-dump schemes and tariff chaos rocked the meme coin sector, but speculative assets are regaining momentum as macroeconomic fears start to cool down.
Are Solana Meme Coins On the Rise Again?
Solana meme coins have been a popular sector of the crypto ecosystem, but a few controversies have taken bites out of the market in recent months.
“Meme trading platform Axiom’s daily trading volume exceeded $100 million for the first time on April 14, accounting for about 50% of the market share of Solana Meme trading platform. The number of trading users reached 26,800, a record high,” claimed Colin Wu.
Axiom may represent half of the trading for these assets, but it isn’t the only site with heightened volumes. Pump.fun recently launched Pumpswap, a new decentralized exchange that quickly captured 14% of Solana’s DEX market.
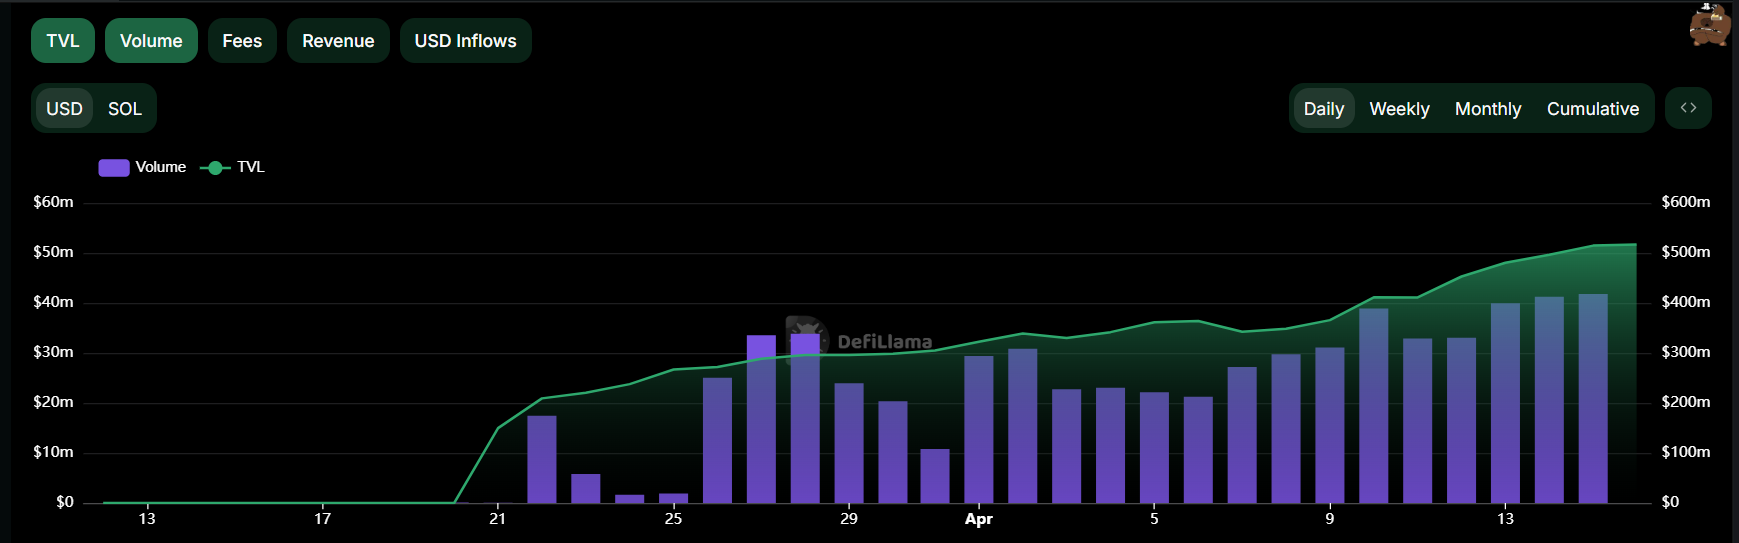
Trading volumes are spiking on PumpSwap, with daily trading volume surging by 50% on Tuesday, April 15.
Data from DefiLlama shows that DEX trading on Solana is starting to recover after a massive drop in March. In other words, Solana meme coins’ growth isn’t isolated to either of these platforms either.
These stats have a long way to go before they recover their all-time high from January, but these signs of regrowth are still very promising.
Additionally, individual Solana meme coins are making huge strides in price performance. In the last week, eight of the ten largest assets in this category posted double-digit gains.
For now, it seems like Solana meme coins are eyeing a real comeback, at least for the short term. However, another macroeconomic shock could see these risk assets reacting more severely than the wider market.