While the Shiba Inu price has crashed by 65% from its November highs, one crypto analyst believes it is too resilient to fail and that it is much better than other meme coins like Dogecoin and Pepe. As such, if her reasons are correct, the SHIB price will likely bounce back in the long term.
Shiba Inu Price Could Soar as Analyst Makes Her Bullish Case
A crypto analyst has suggested that Shiba Inu is too strong to fail. That is likely a reference to the “too big to fail” phrase that refers to the biggest banks in the United States.
In an X post, an anonymous analyst going by the name ShibaBaby Shib, explained that Shiba Inu had transitioned from being a meme coin into a full-fledged ecosystem with real utility.
She pointed to Shibarium, its layer-2 network that aims to compete with other players like Base and Arbitrum. Additionally, she pointed to other utility tokens in the ecosystem like BONE, LEASH, and TREAT. Each of these token has a clear utility in the crypto industry, with BONE being used to handle payments in Shibarium. She said:
“SHIB isn’t just hype—it’s a movement with infrastructure, vision, and unstoppable community strength.”
Shibarium has become a rapidly growing layer-2 network, handling over 1.05 billion transactions. It has also added over 197 million addresses over time. Its growth will contribute to Shiba Inu’s performance by increasing its burning mechanism.
In addition, unlike other inflationary meme coins, Shiba Inu continues to burn billions of tokens weekly. Burning reduces the number of coins in circulation, boosting the value of the remaining tokens.
SHIB Price Technical Analysis
The daily chart reveals that the Shiba Inu price has formed a few bullish chart patterns that point to 3x in the longer term. It formed a big falling wedge between November last year and March. A strong bullish breakout often follows this pattern, especially if it is a big one.
SHIB price has also formed a triple-bottom pattern at $0.00001080. This pattern is made up of three low swings and a neckline, which, in this case, stands at $0.000033, its highest level in 2024.
Most recently, it has formed a smaller double-bottom with a neckline at $0.00001567.
Therefore, while it is too early to predict, it is likely that the coin will bounce back, and possibly hit the neckline at $0.00003335. This SHIB price forecastis about 300% above today’s level.
Shiba Inu Price
The alternative scenario is dire for the coin. A drop below the triple-bottom point at $0.00001080 will be a sign that bears have won and push the coin much lower over time.
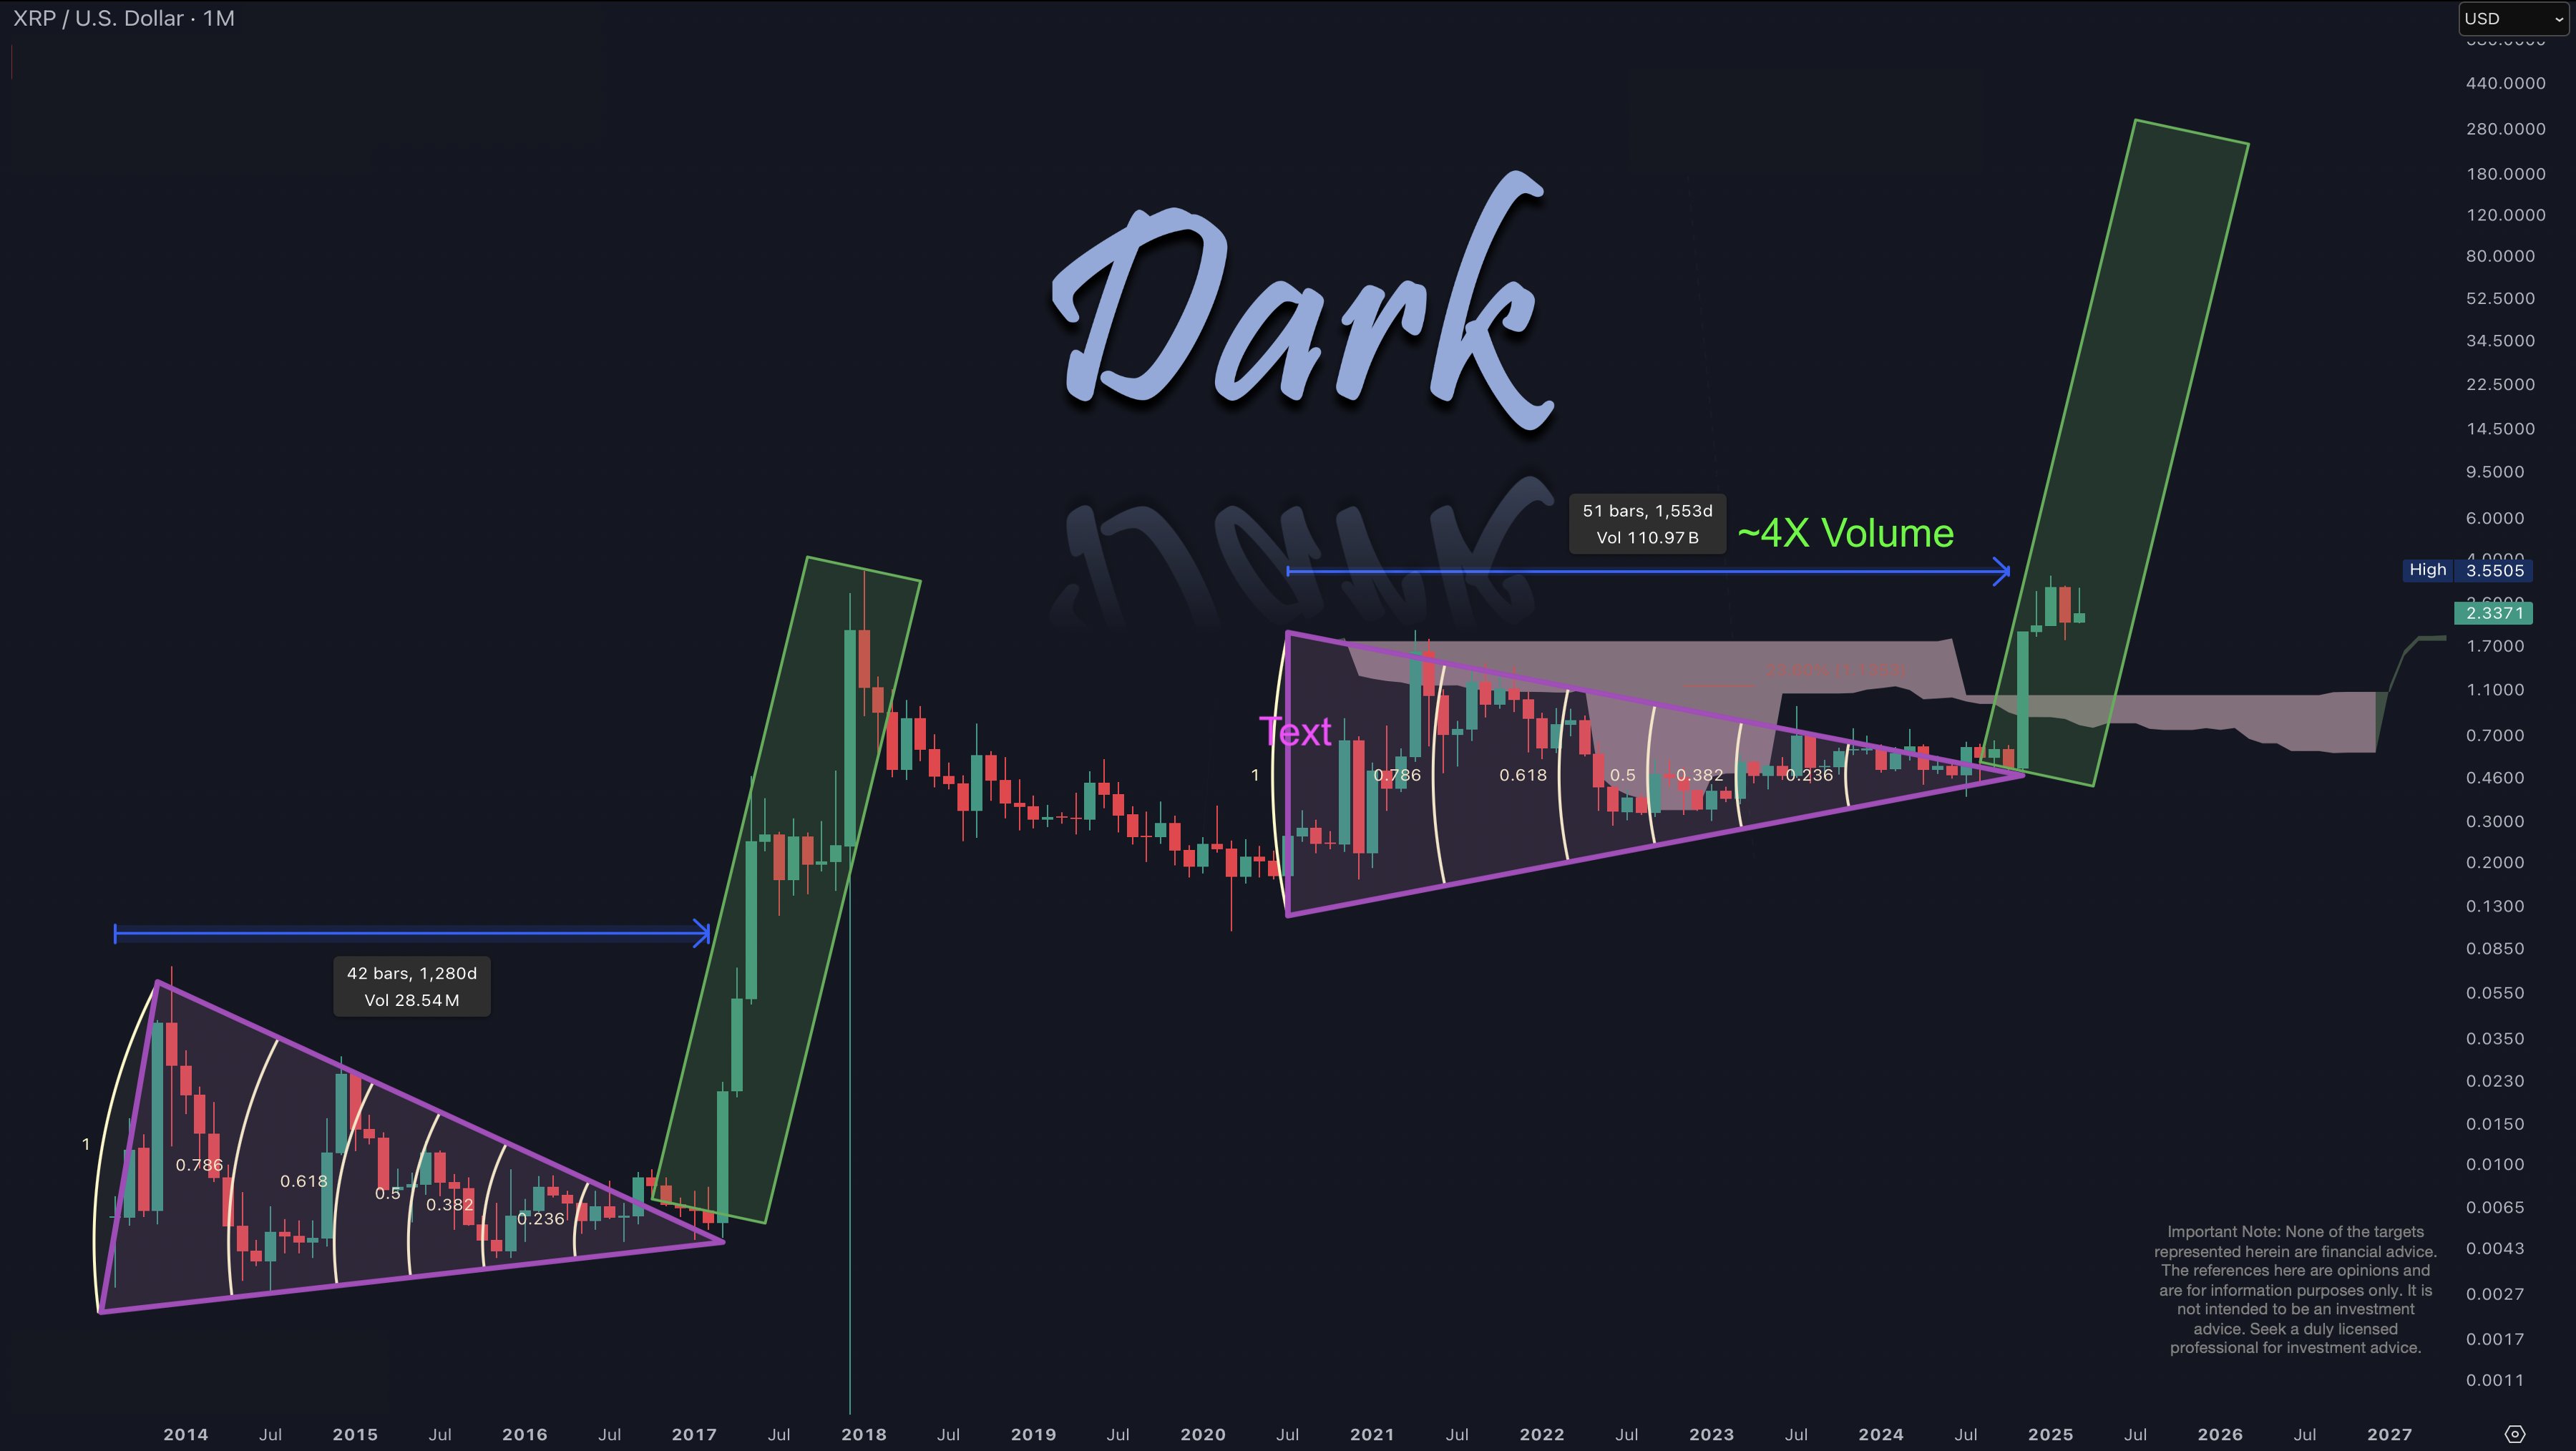
Crypto expert Dark Defender predicted that the XRP price could rally to $280, providing a bullish outlook for the crypto. The expert alluded to XRP’s historical performance as to why the coin could reach such an ambitious price target.
Crypto Expert Predicts XRP Price Rally To $280
In an X post, Dark Defender predicted an XRP price rally to $280 as he raised the possibility of the crypto replicating its 2017 bull run performance. In 2017, XRP witnessed a price rally of over 60,000% on its way to its current all-time high (ATH) at around $3.3.
The expert’s accompanying chart showed that XRP could reach this $280 target between 2026 and 2027, although the parabolic rally could begin this year as the crypto looks to replicate its 2017 performance.
Interestingly, crypto analyst Egrag Crypto had also made a similar prediction to Dark Defender. The analyst predicted that XRP could rally to $222 if history repeats itself, alluding to the 2017 bull run.
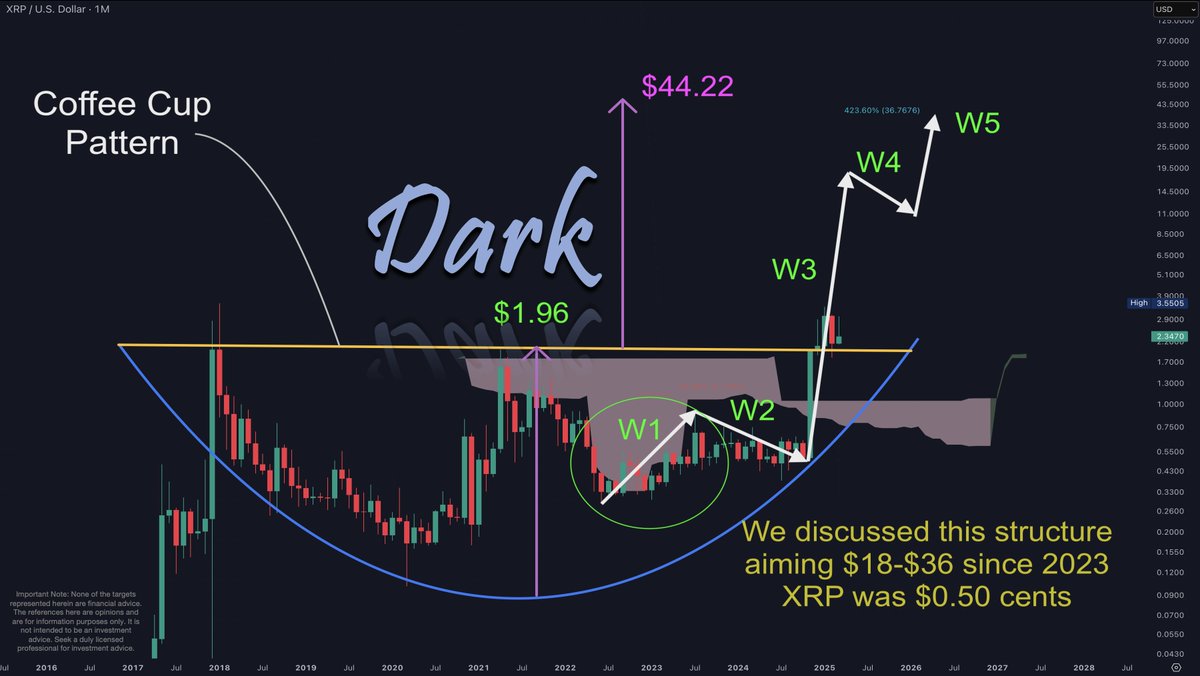
Coffee-Cup Pattern Shows Rally To $44 Is Possible
In an earlier post, Dark Defender made a more conservative prediction of an XRP price rally to $44 based on a ‘Coffee Cup’ pattern. He explained that this market pattern is a U-shaped formation on a price chart, indicating a potential bullish trend reversal after a downtrend. This pattern typically takes weeks to months to develop fully.
The expert stated that he has paired this pattern with the Elliot Waves, which has given a better picture of XRP’s future trajectory. He remarked that wave 3 is charging toward $5.85 and $18.22. Wave 5 is eyeing $36, while the cup’s depth plus Coffee level is brewing up for a rally to as high as $44.22.
XRP Is Testing Critical Resistance
In an X post, crypto analyst CasiTrades stated that the XRP price is testing critical resistance at around $2.54 and is currently sitting just below the trendline of a consolidation pattern. She further remarked that if the crypto breaks and holds above this $2.54 price level, the next targets are still $2.70 and $3.05.
The analyst had previously highlighted those price levels as the upside targets when she warned that XRP could drop to as low as $1.5 if it fails to hold above $2.42. Meanwhile, in her recent analysis, CasiTrades remarked that she is still leaning towards the idea that the crypto is still in the early stages of Wave 3.
The analyst added that it is just not obvious yet, but once XRP breaks previous highs, the crypto could rally to $9.50 for the official Wave 3 extension. She noted that this aligns with the macro $8 to $13 price target.
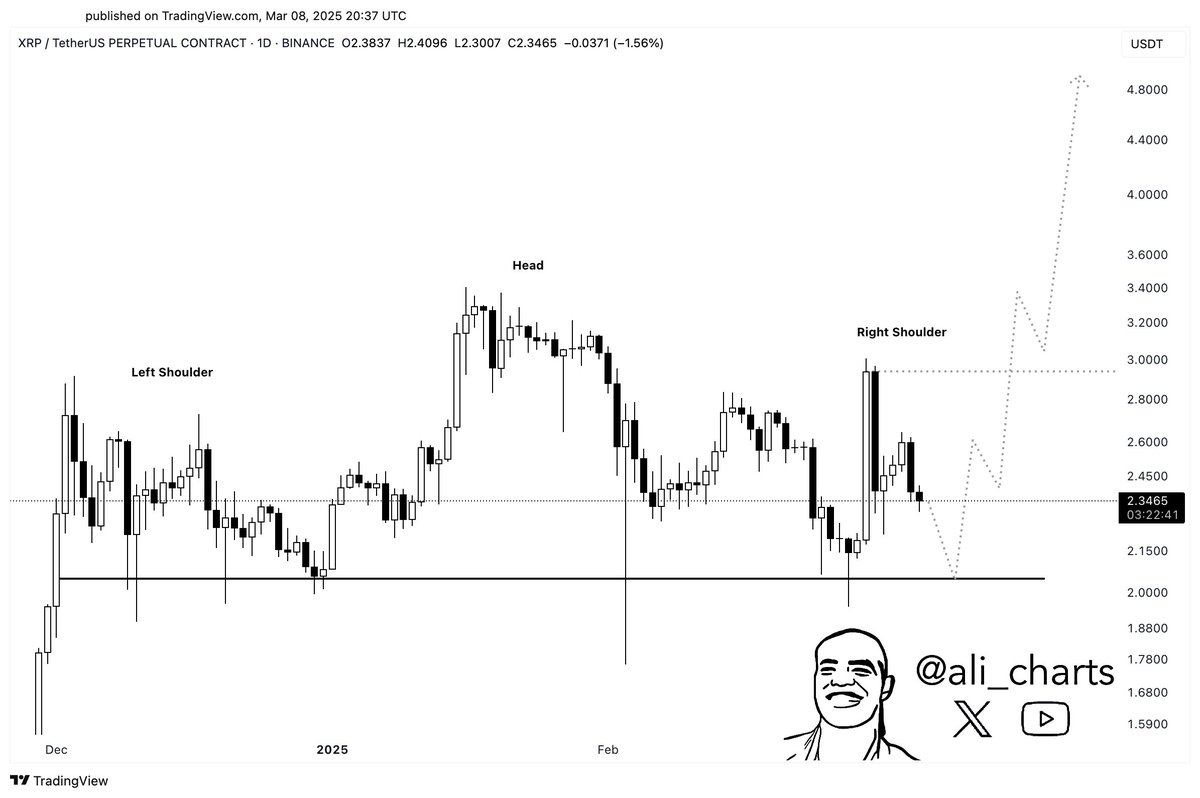
Crypto analyst Ali Martinez predicted that the XRP price could soon rally to $5. He stated that if XRP avoids closing below the head-and-shoulders neckline and breaks above the right shoulder instead, it could invalidate the bearish pattern. He added that this move might trigger a bullish breakout toward $5.
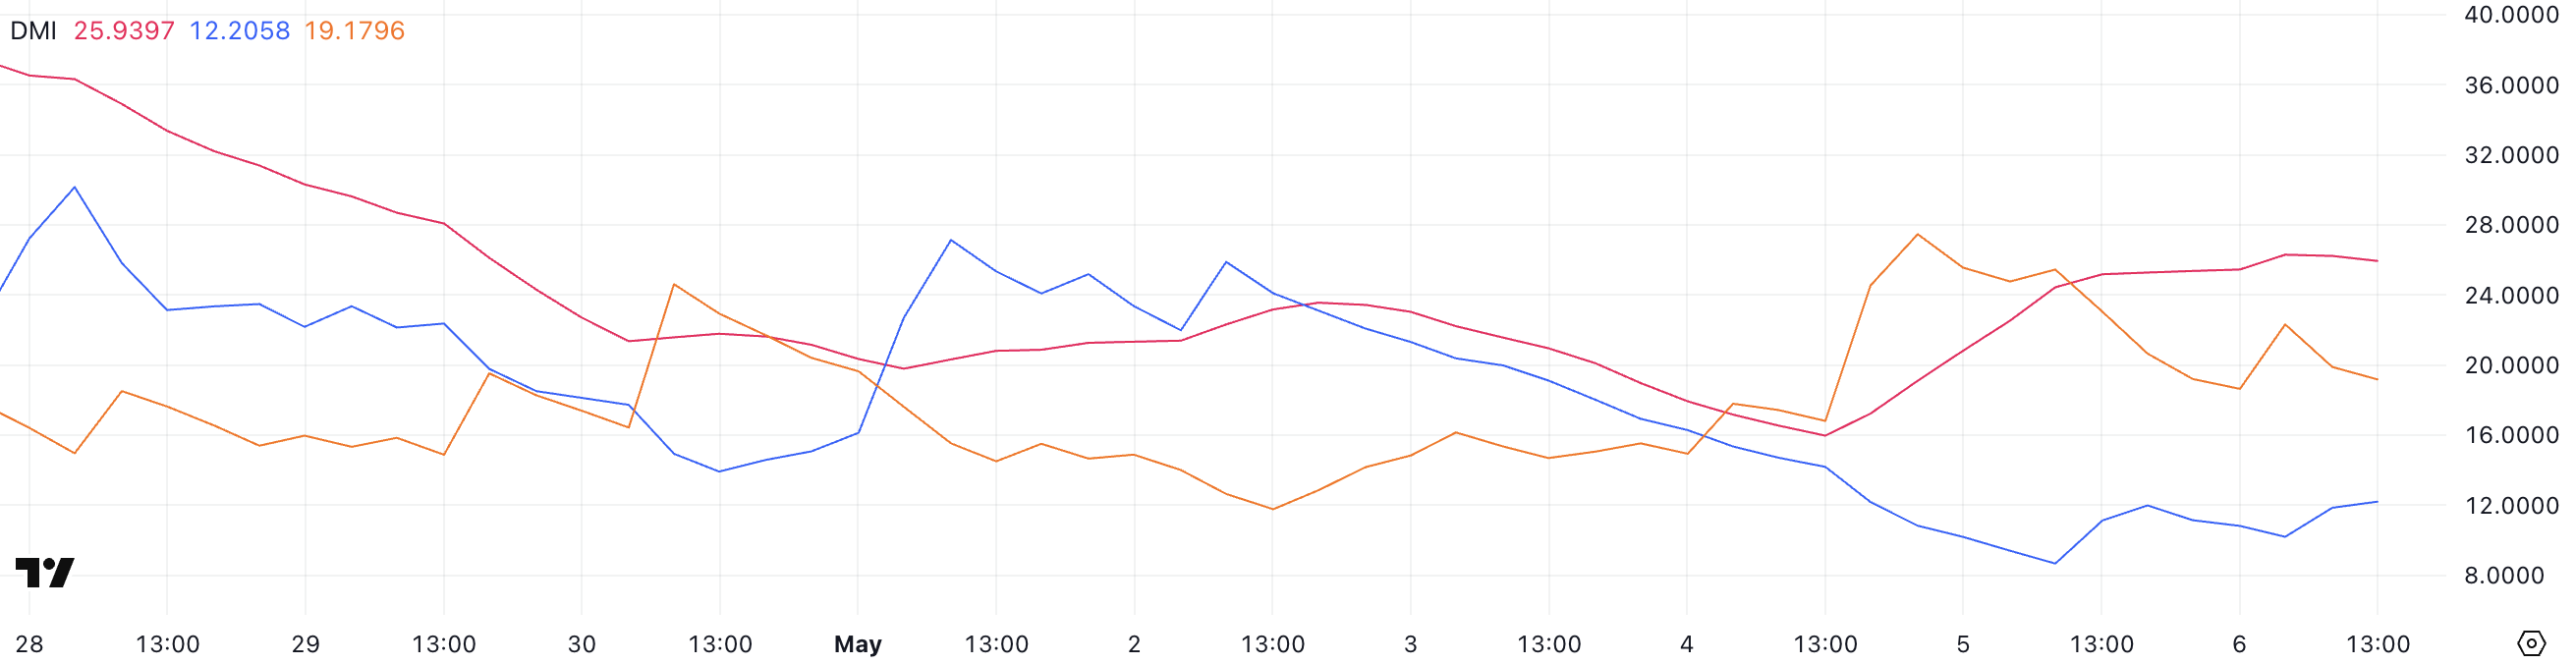
Bitcoin (BTC) enters the second week of May trading in a fragile but critical zone, with conflicting technical signals and growing macro uncertainty shaping short-term expectations. While the ADX from the Directional Movement Index is rising, bearish pressure still dominates, and momentum remains weak across multiple indicators.
Although the price continues to hold above the $92,900 support level, weakening EMAs and the looming FOMC meeting leave Bitcoin’s $100,000 recovery path uncertain, but not out of reach.
BTC Trend Strength Rises, but Bears Still in Control
Bitcoin’s Directional Movement Index (DMI) is showing a notable shift.
The ADX, which measures the strength of a trend regardless of direction, has climbed sharply to 25.93, up from 15.97 just two days ago—crossing the key 25 threshold that signals a trend is starting to gain traction.
This rising ADX suggests that volatility is returning and a new directional move may be forming, even if the direction itself is still unclear.
Looking at the components of the DMI, +DI (bullish strength) has bounced to 12.2, up slightly from yesterday’s low of 8.67 but still down significantly from 21.31 three days ago.
Meanwhile, -DI (bearish strength) is at 19.17, slightly off its peak of 25.44 but still higher than three days ago. This indicates that although the recent bearish momentum has cooled somewhat, sellers still have the upper hand.
With ADX rising and -DI leading, Bitcoin could remain under pressure unless +DI recovers sharply in the coming days.
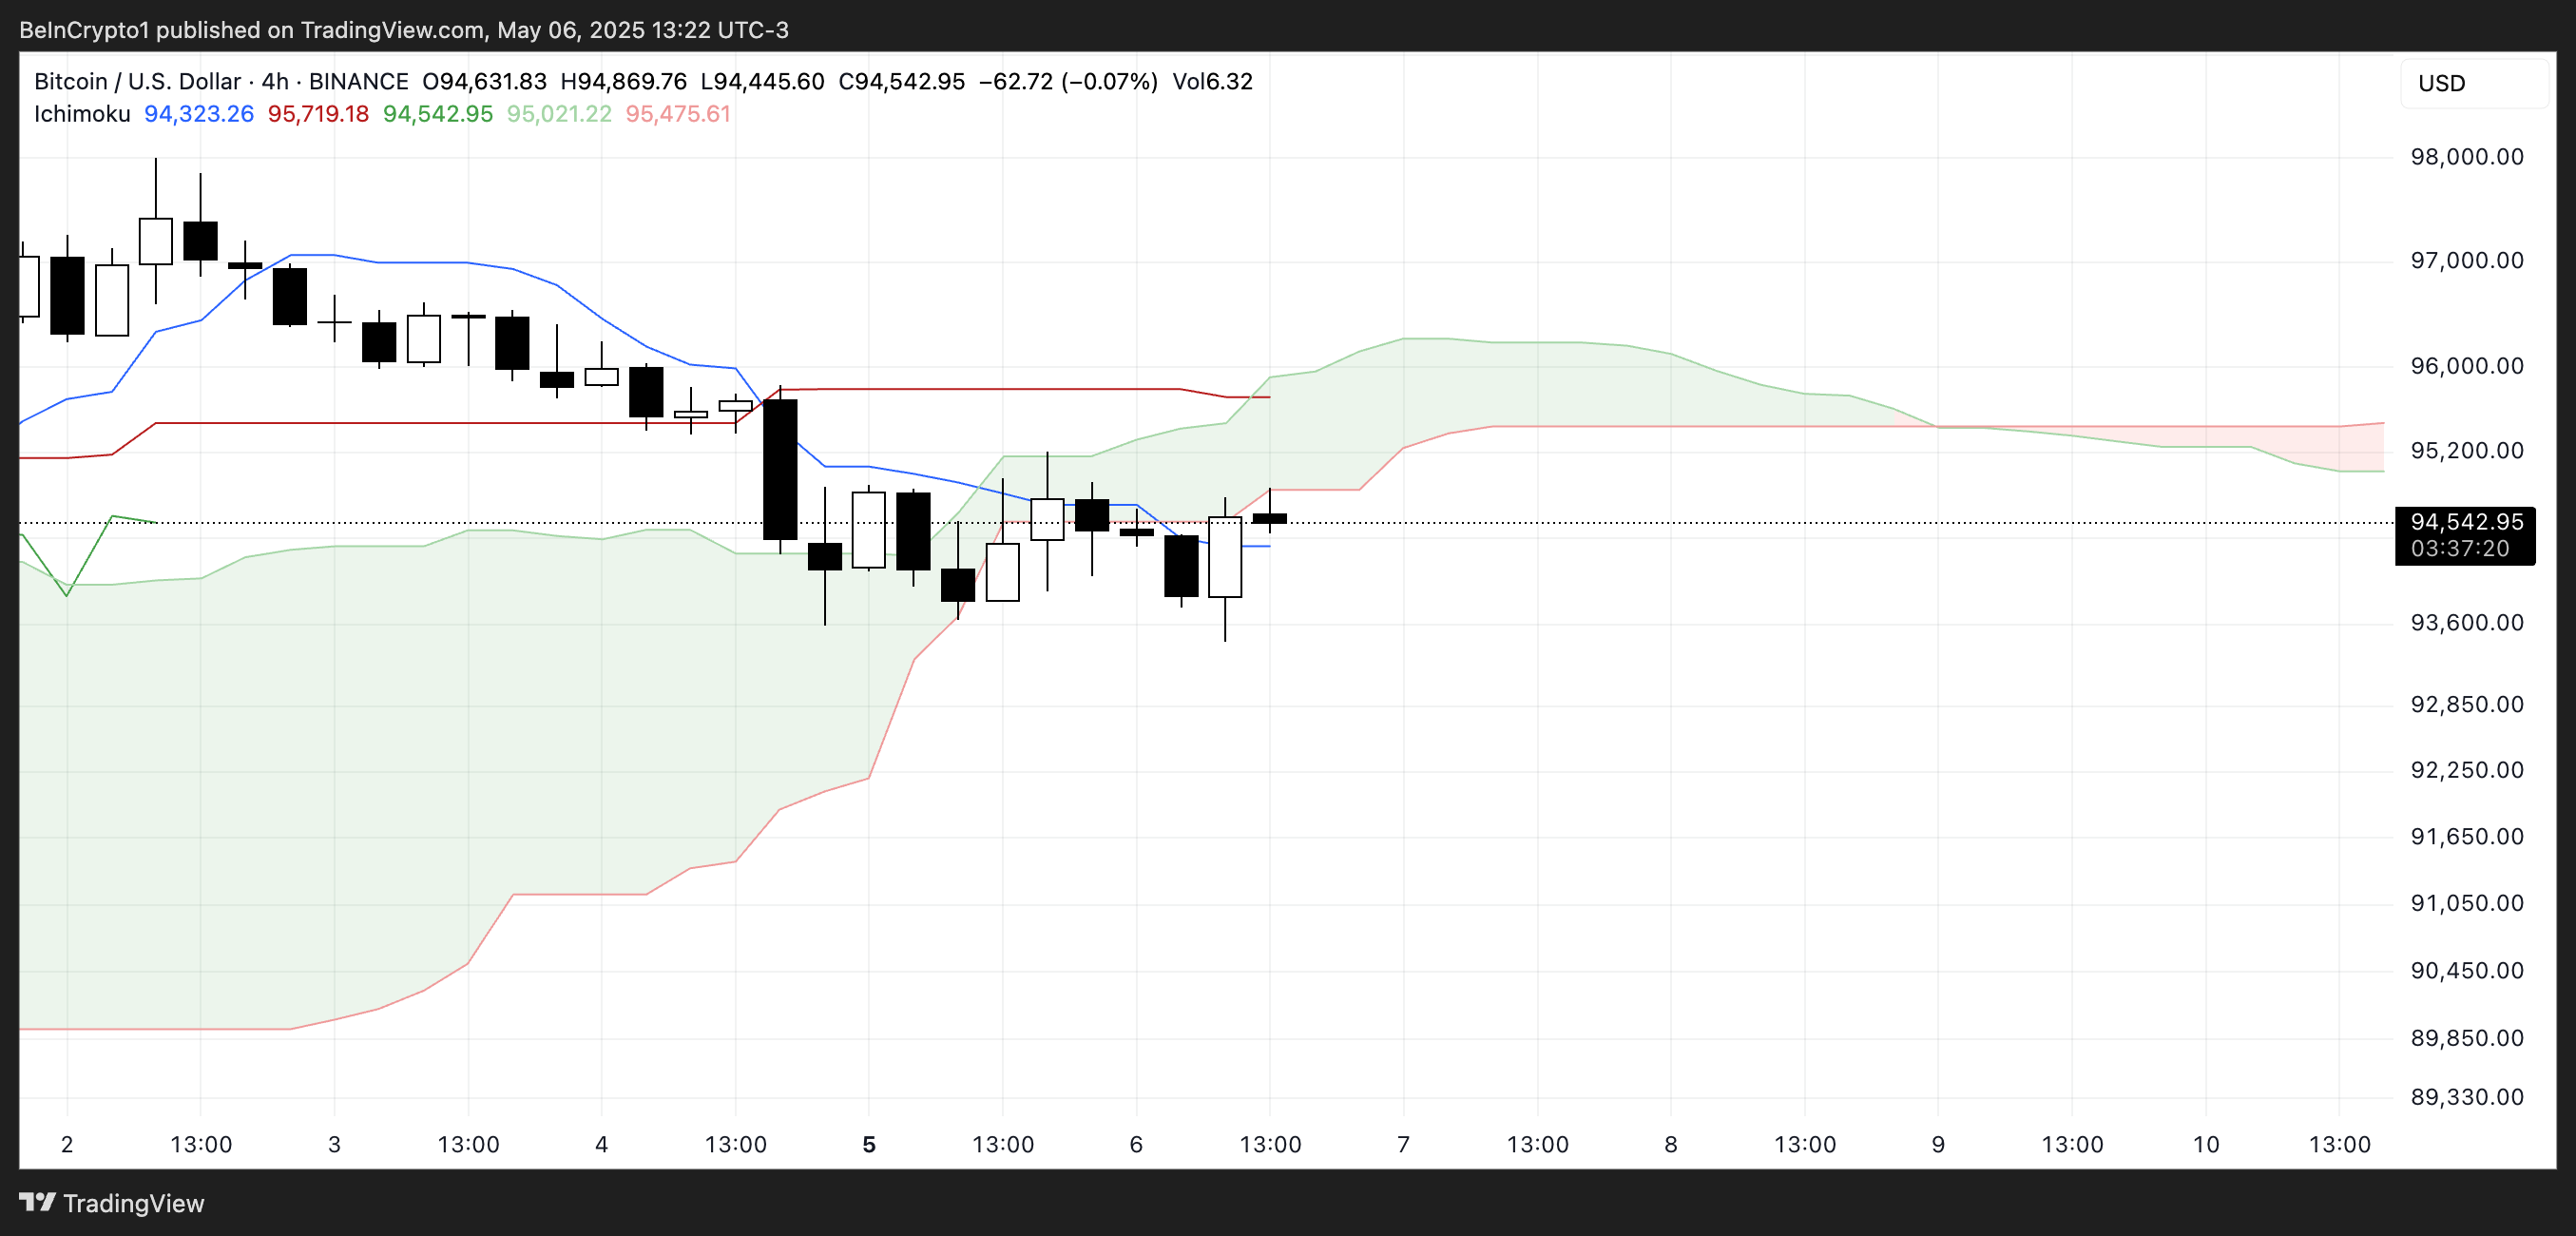
Bitcoin Trapped Below the Cloud as Momentum Stalls
The current Ichimoku Cloud chart for Bitcoin reflects a market in consolidation, with a slight bearish undertone. Price action is sitting very close to the blue Kijun-sen (baseline), which typically represents medium-term trend momentum.
Trading beneath this line suggests that BTC lacks the strength to reclaim bullish momentum in the short term. The white candlesticks hovering near the cloud’s lower boundary indicate indecision among traders, with no clear breakout in sight.
The green Kumo (cloud) itself is relatively thin at this stage, hinting at a fragile support zone that could easily be broken if bearish pressure returns.
Looking ahead, the red Senkou Span B—the top of the projected cloud—is acting as dynamic resistance, capping any upward attempts. For a stronger bullish signal, BTC would need to close decisively above both the Kijun-sen and the entire cloud.
Complicating matters further, the Tenkan-sen (conversion line) is flat and overlapping with the Kijun-sen, signaling weak momentum and a lack of direction. Flat Tenkan and Kijun lines often precede sideways movement or delayed trend development.
Until Bitcoin breaks convincingly above the cloud with rising volume, the current setup leans neutral to bearish, with price trapped in a zone of low conviction and limited momentum.
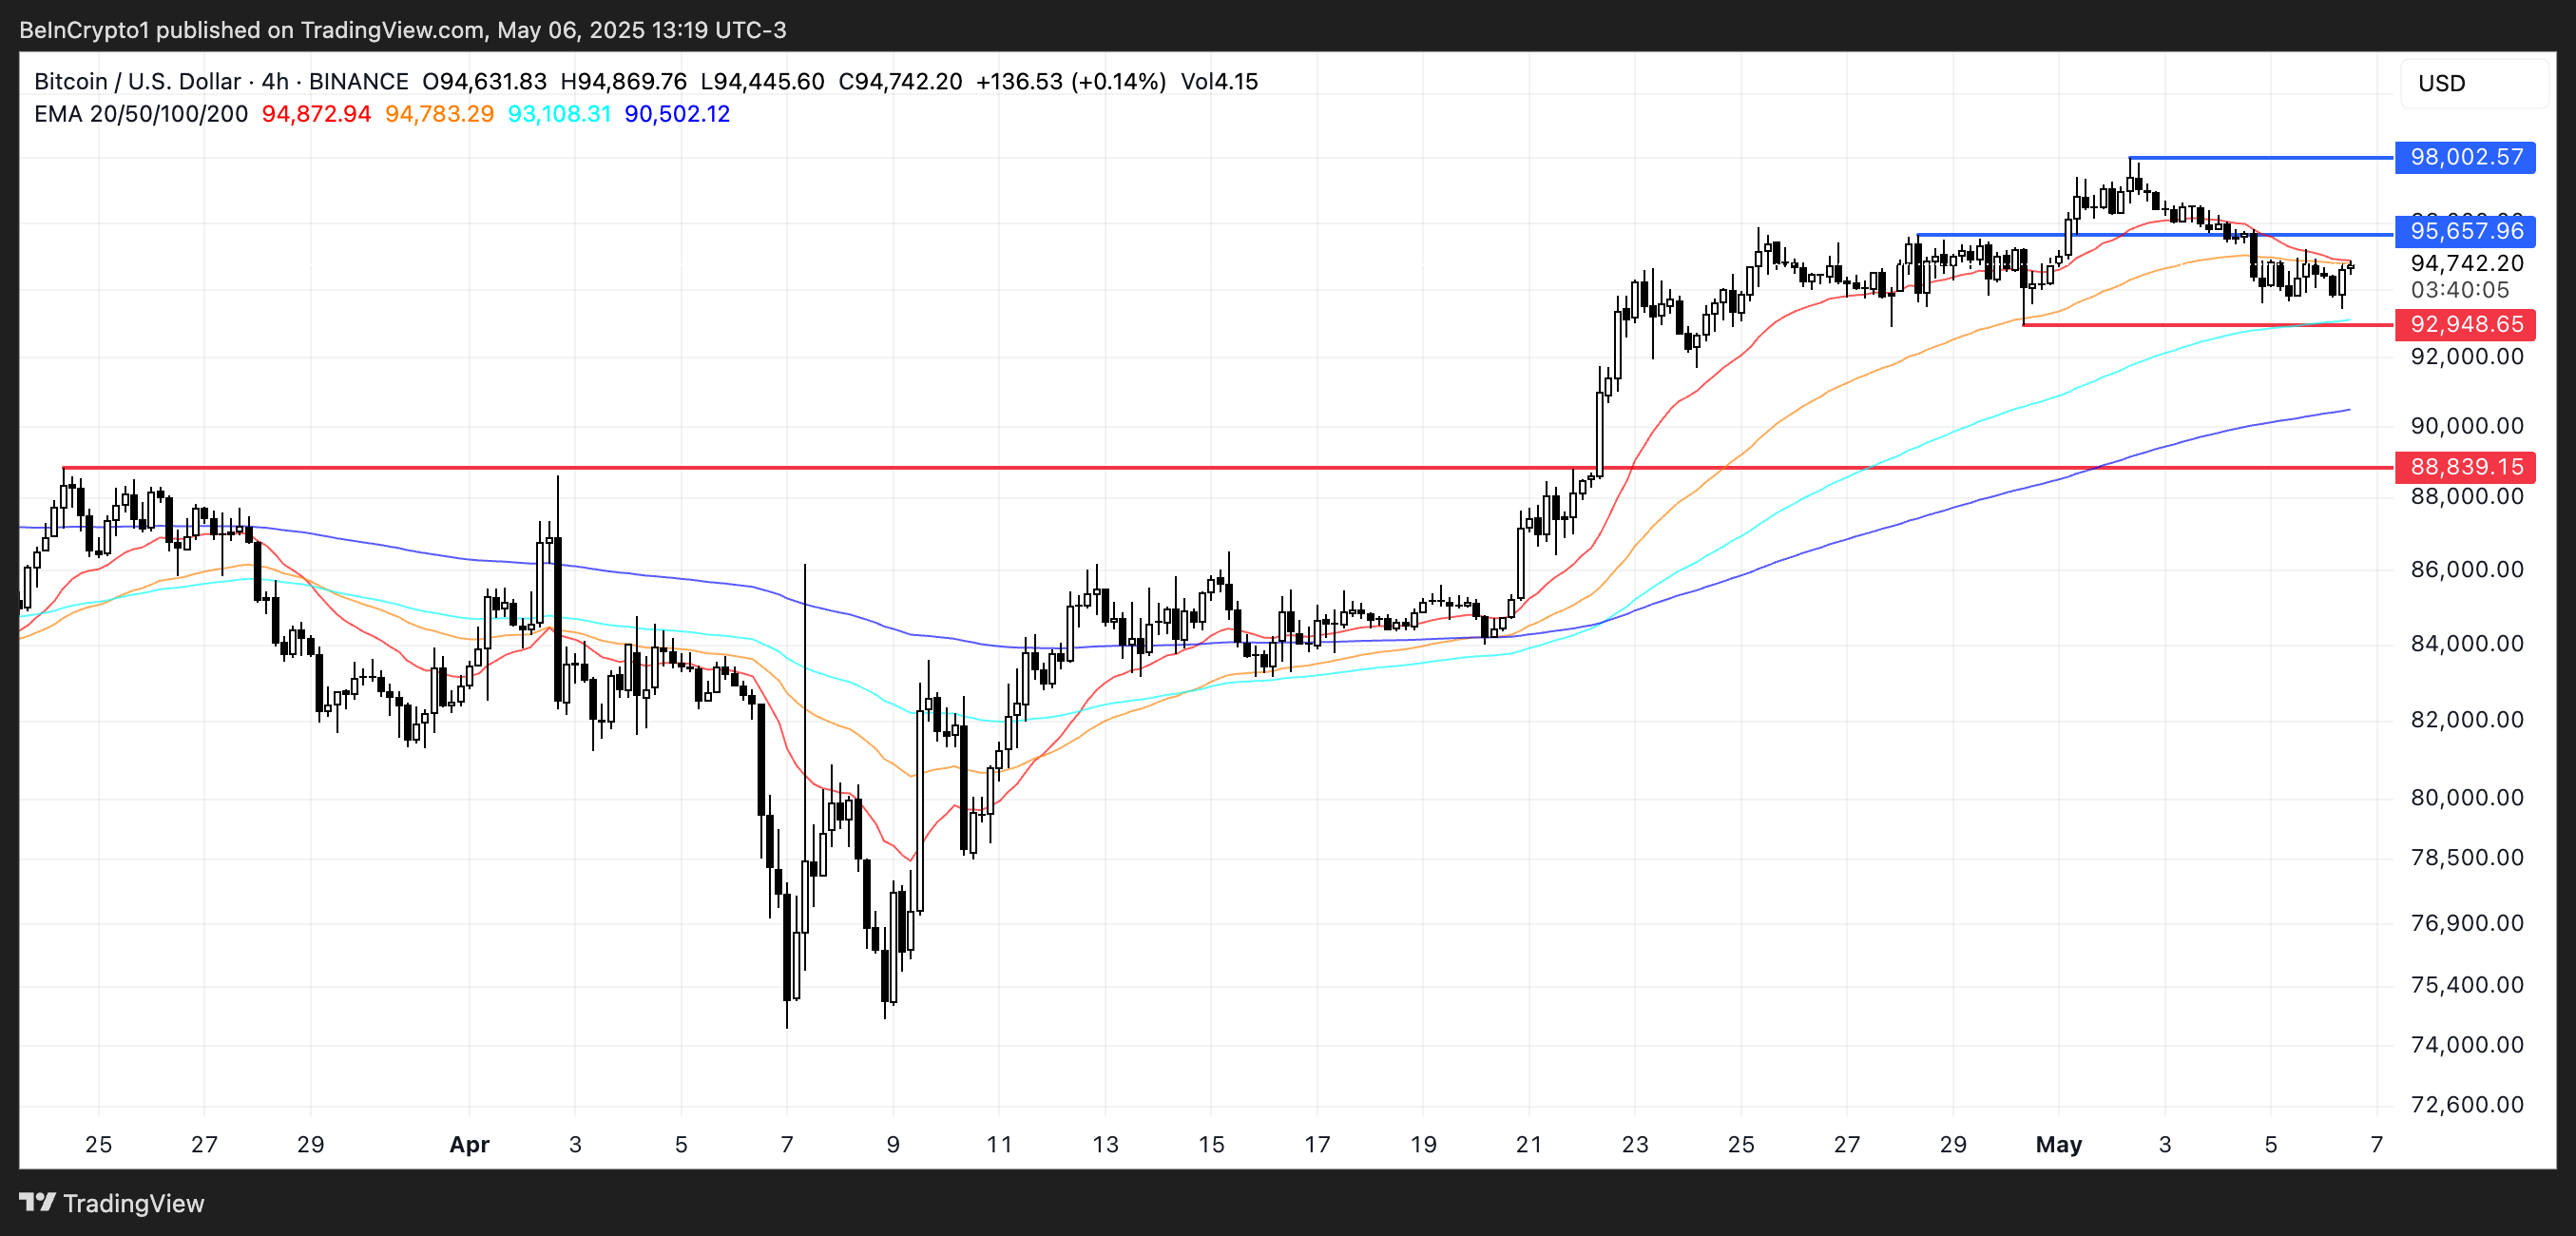
Bitcoin Holds Key Support as $100,000 Reclaim Hangs in the Balance
Bitcoin price has remained resilient above the $90,000 level since April 22, repeatedly holding support near $92,945 despite broader market uncertainty. The exponential moving averages (EMAs) still reflect a bullish structure, with short-term averages positioned above long-term ones.
However, there are early signs of weakening momentum, as the short-term EMAs have begun to slope downward—an indication that buyers may be losing strength soon.
If BTC fails to hold its key support, a drop toward $88,839 could follow, breaking the structure that has held for over two weeks.
Still, some analysts remain confident. Nick Purin, founder of The Coin Bureau, believes Bitcoin is well-positioned to reclaim the $100,000 mark, even as markets brace for volatility surrounding the upcoming FOMC meeting:
“It will be a volatile week. Firstly, we have the FOMC meeting tomorrow. While it’s pretty clear there will be no rate cuts, it’s what Chair Powell says that could move the markets. On top of that, trading volume is low and the long/short ratio is sitting at 50/50, which means that, yet again, BTC can swing in either direction from here. The good news is that there’s a great deal of buying interest around the $90,000-$93,000 range, so a dip to those levels is nothing to be concerned about – it will likely bounce back. And overall, the BTC/USD chart is looking strong as it continues to print higher lows.” – Purin told BeInCrypto.
Nick states how Fed next decisions could influence the market in the next months:
“If the Fed surprises with some dovish tones as well as guidance for rate cuts in June, there’s room for Bitcoin to rally all the way back up to that $100,000 level, which remains a liquidity magnet. But even if Powell strikes a hawkish tone, the impact on BTC will likely be minimal. There’s simply too much positive momentum – spot BTC ETFs are hoovering up assets, corporates are building up BTC treasuries and the correlation between Bitcoin and stocks is breaking down. On top of this, historic data shows that BTC has posted gains during nine out of the last 12 Mays. So, despite the likelihood of heightened volatility, the near future is looking promising. As such, following the old adage of ‘sell in May’ would be madness at this point.” – Purin told BeInCrypto.
A recovery in momentum could first drive BTC to retest resistance at $95,657, with a breakout potentially leading to $98,002 and eventually a challenge of the psychological $100,000 level.
With macro headwinds and technical crossroads converging this week, the next move will likely hinge on how BTC responds to its support zone and how broader market sentiment reacts to Fed commentary.
Eric Trump has warned traders against shorting Bitcoin and Ethereum. His remarks came as the Ethereum price edges closer to its all-time high, fuelled by a wave of corporate treasury acquisitions and high-profile endorsements. Eric Trump Has A Warning for Bears Eric Trump took to X to celebrate a sharp rally in the Ethereum price