Ethereum (ETH) trades at $3,821 today, July 30, with a 53% gain in one month. Ethereum price gains in July have been due to multiple factors like altcoin season chatter and demand from institutions. However, a new bullish factor, DeFi resurgence, has entered the picture, and it might not only help ETH reclaim $4,000 but
Today, April 9, 2025, following the opening bell of the US market, the overall cryptocurrency market jumped by 1.90%, indicating a potential upside rally. Amid this, Pepe (PEPE), the popular meme coin, has formed a bullish price action and is poised for a massive upside rally.
Pepe (PEPE) Technical Analysis and Upcoming Levels
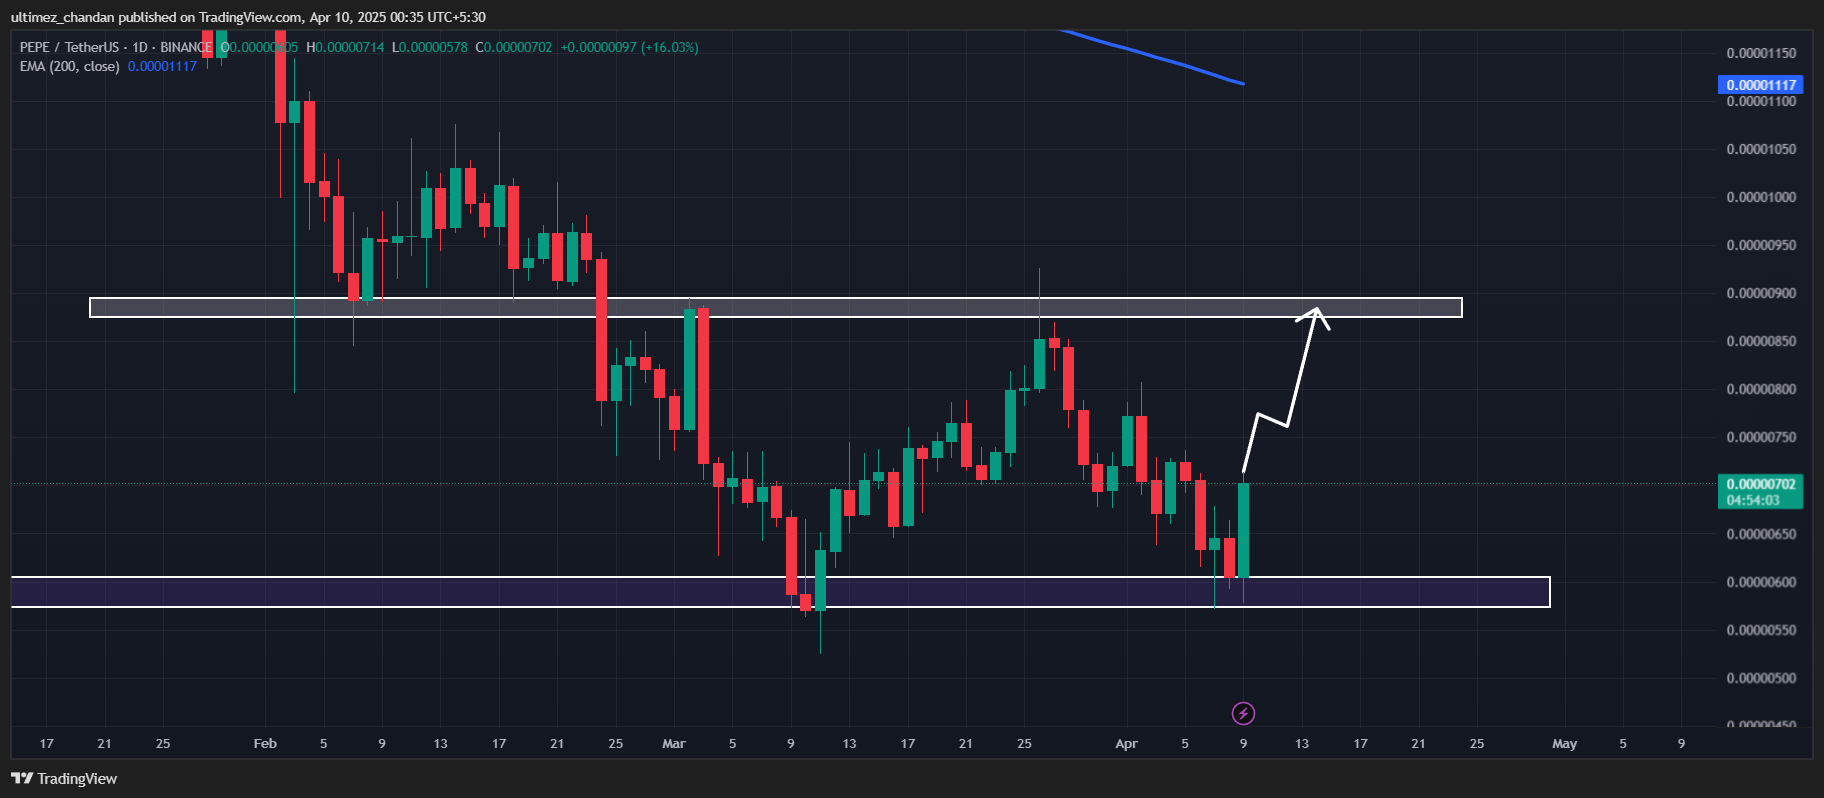
According to expert technical analysis, PEPE appears to be forming a bullish double-bottom price pattern on the daily time frame. In addition to this bullish pattern, the meme coin has also broken out of a descending trendline that it had been following since March 26, 2025.
Source: Trading View
Based on recent price momentum and historical patterns, if the PEPE price holds above the $0.00000678 level, there is a strong possibility it could soar by 30% to reach the $0.0000090 level in the future.
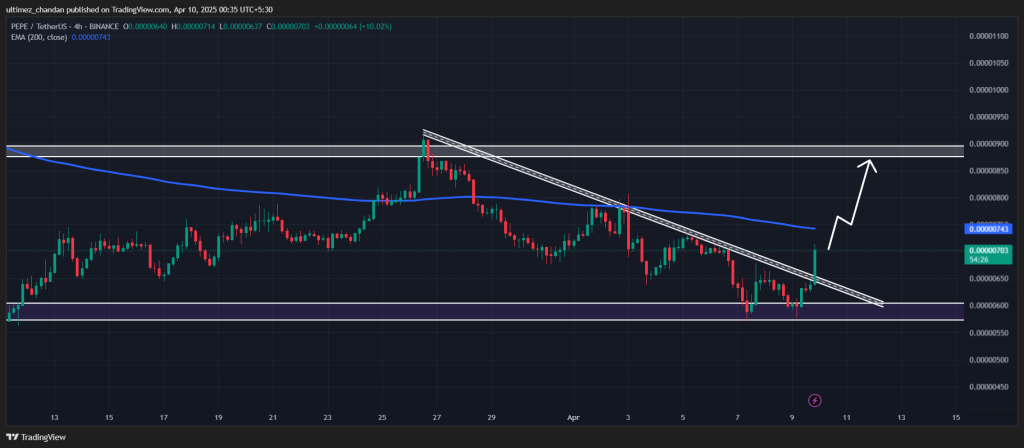
Source: Trading View
Despite this bullish price action, PEPE is currently trading below the 200-day Exponential Moving Average (EMA) on the daily time frame, indicating strong bearish sentiment for the asset.
Current Price Momentum
At press time, PEPE is trading near $0.00000698 and has registered a price surge of over 15% in the past 24 hours. Meanwhile, during the same period, its trading volume jumped by 75%, indicating heightened participation from traders and investors compared to the previous day.
Why Is PEPE’s Price Rising?
The potential reason behind this sudden price surge is President Donald Trump’s recent post on X (formerly Twitter). In the post, Trump stated, “I have authorized a 90-day PAUSE, and a substantially lowered Reciprocal Tariff during this period, of 10%, also effective immediately. Thank you for your attention to this matter!”
$5.76 Million Worth of Bullish Bet
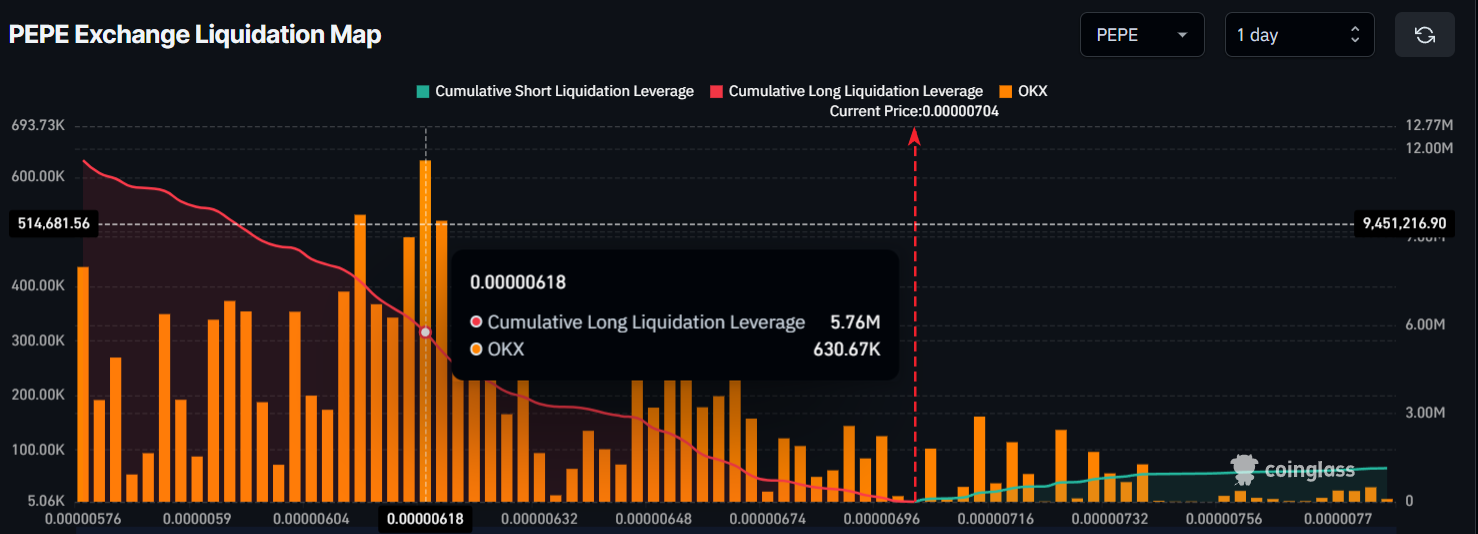
Following this announcement, the overall market—and PEPE in particular—turned bullish, with intraday traders also shifting their positions toward the bullish side, as reported by on-chain analytics firm Coinglass.
Data revealed that traders are currently over-leveraged at $0.00000618 on the lower side (support) and $0.00000714 on the upper side (resistance), having built $5.76 million and $305.60k worth of long and short positions, respectively, over the past 24 hours.
Source: Coinglass
This metric suggests that the bulls are back and currently dominating the asset, potentially driving the meme coin’s upside momentum.
The post PEPE Poised For 30% Rally, Chart Flashes Buy Signal appeared first on Coinpedia Fintech News
Today, April 9, 2025, following the opening bell of the US market, the overall cryptocurrency market jumped by 1.90%, indicating a potential upside rally. Amid this, Pepe (PEPE), the popular meme coin, has formed a bullish price action and is poised for a massive upside rally. Pepe (PEPE) Technical Analysis and Upcoming Levels According to …
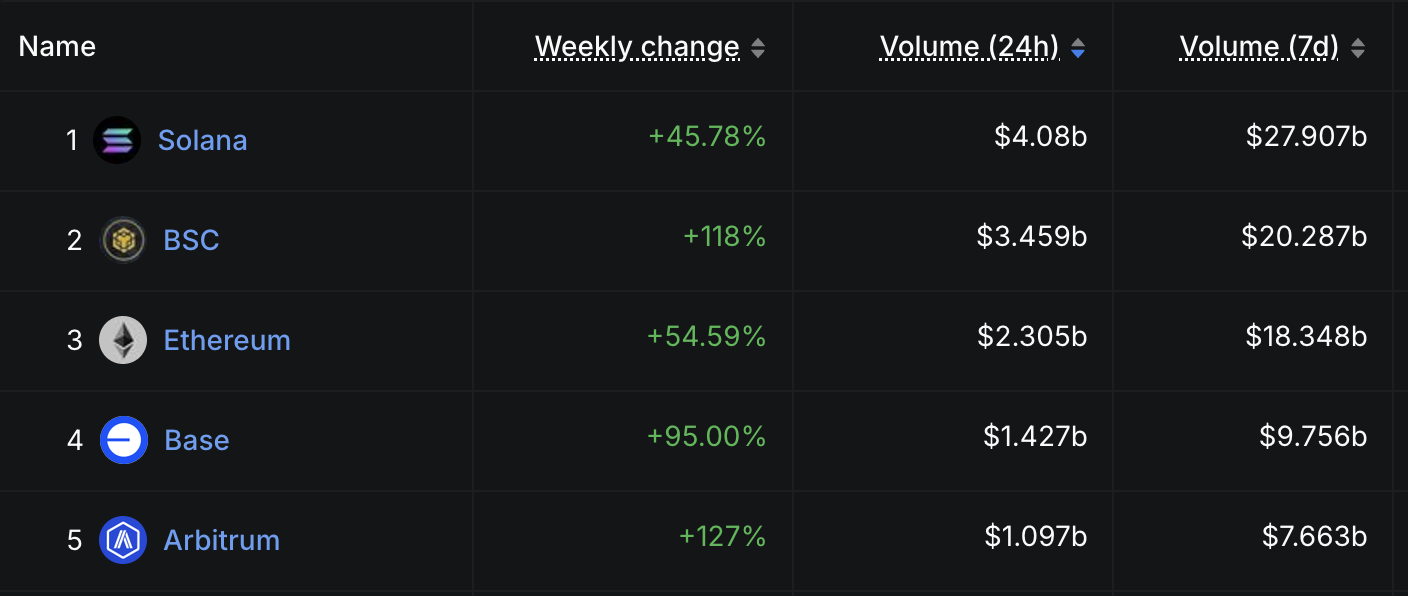
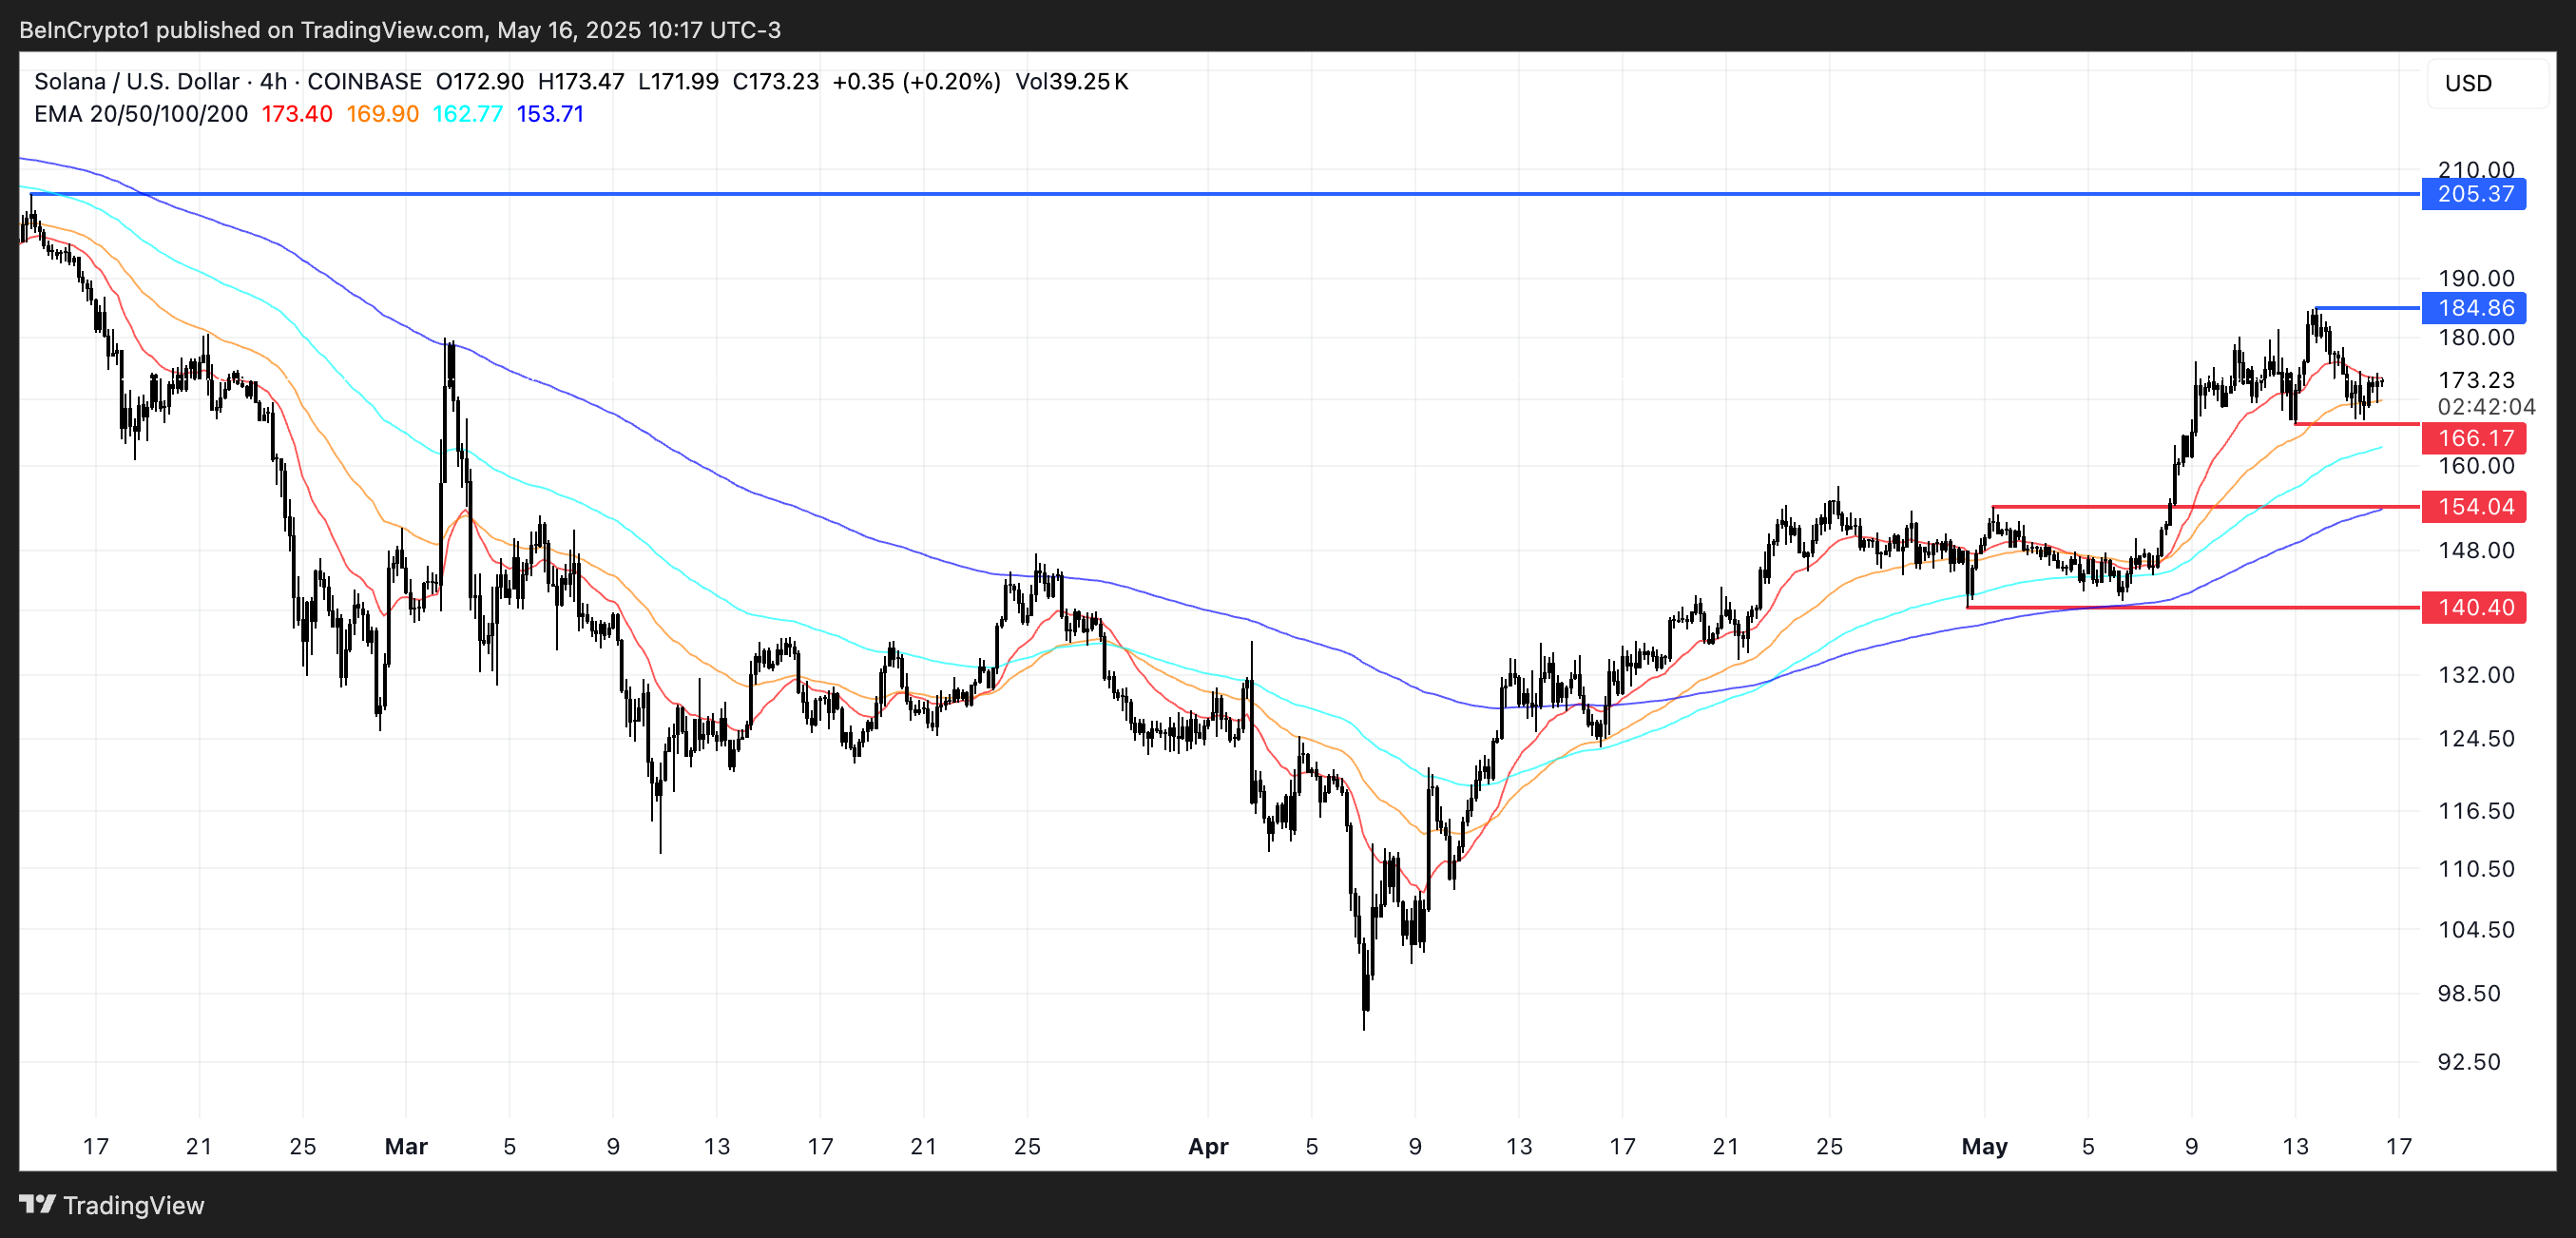
Solana (SOL) is up 28.4% over the past month, but its momentum has slowed. After briefly touching $184, it has gained just 0.78% in the last seven days. Despite this, Solana continues to dominate DEX metrics, leading all chains with $27.9 billion in weekly volume.
The broader ecosystem remains active, with multiple Solana-based apps among the top fee generators. However, technical indicators such as RSI, Ichimoku Cloud, and EMA lines suggest the rally may be losing steam, signaling a potential period of consolidation or correction ahead.
Solana Leads DEX Market With $27.9 Billion Weekly Volume and Surging App Activity
The weekly DEX volume for Solana surged by 45.78%, signaling a strong resurgence in on-chain activity after decreasing activity between March and April.
This rise is a spike and part of a broader trend, with volumes consistently staying above the $20 billion mark over the past month.
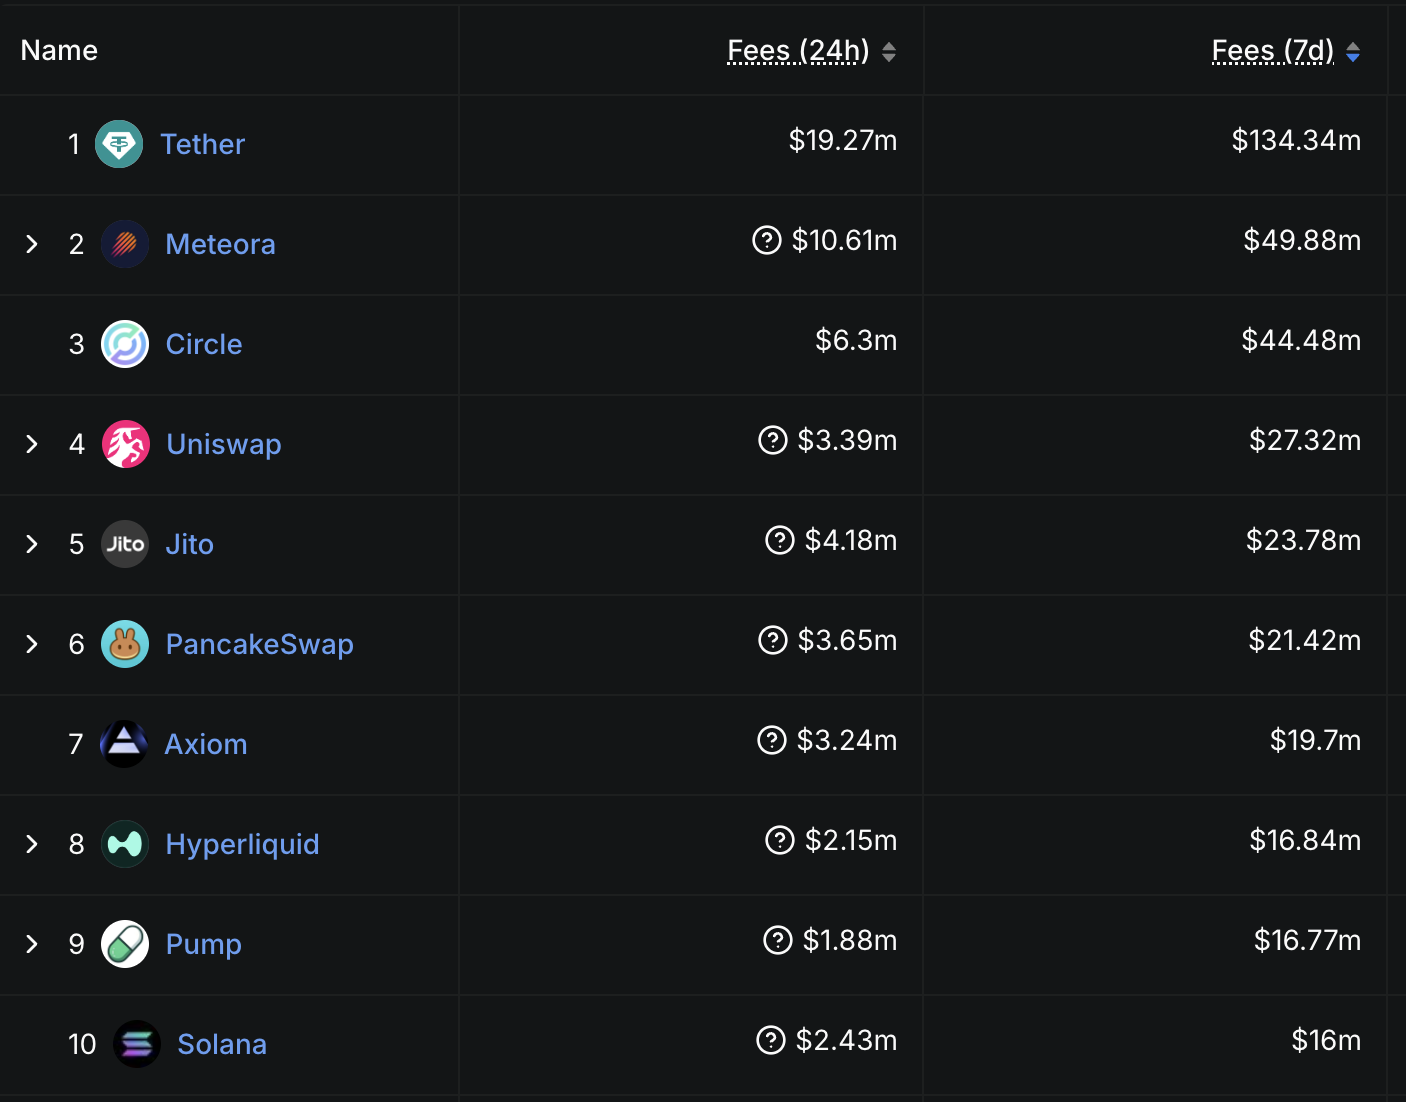
Top Apps and Chains by Fees and Revenue. Source: DeFiLlama.
Adding to its momentum, Solana is home to four of the past week’s ten highest fee-generating apps and chains. This includes familiar platforms and newcomers, showing a healthy diversity in the ecosystem.
Believe App, a newly launched Solana-based launchpad, stands out in the recent surge. In the last 24 hours alone, it generated $3.68 million in fees—surpassing well-established platforms like PancakeSwap, Uniswap, and Tron.
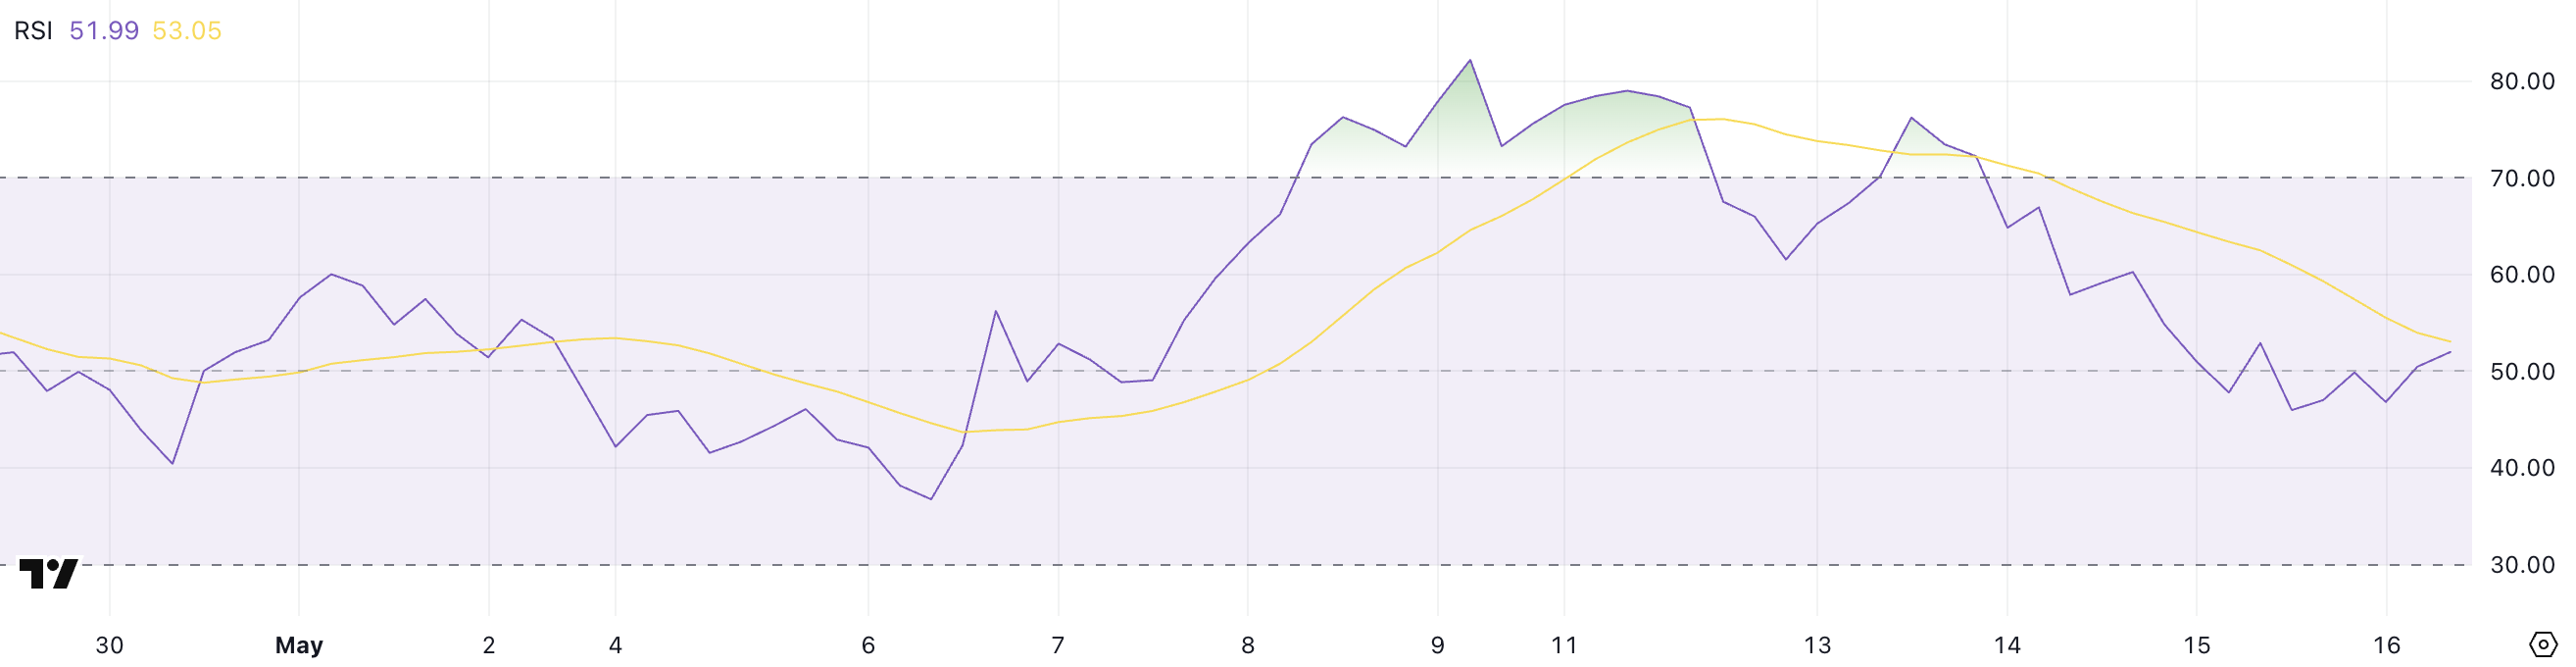
Momentum Cools for SOL as Indicators Turn Neutral
Solana’s Relative Strength Index (RSI) has dropped to 51.99, down from 66.5 just three days ago, signaling a clear loss of bullish momentum.
Over the past few days, the RSI has hovered between 44 and 50, reflecting a more neutral market sentiment after previously nearing overbought conditions.
The RSI is a momentum indicator that ranges from 0 to 100, with values above 70 indicating overbought conditions and below 30 signaling oversold territory. At 51.99, Solana sits in the neutral zone, which typically suggests a period of consolidation or indecision.
If the RSI rises above 60 again, it could point to renewed bullish strength; if it dips below 45, further downside pressure may follow.
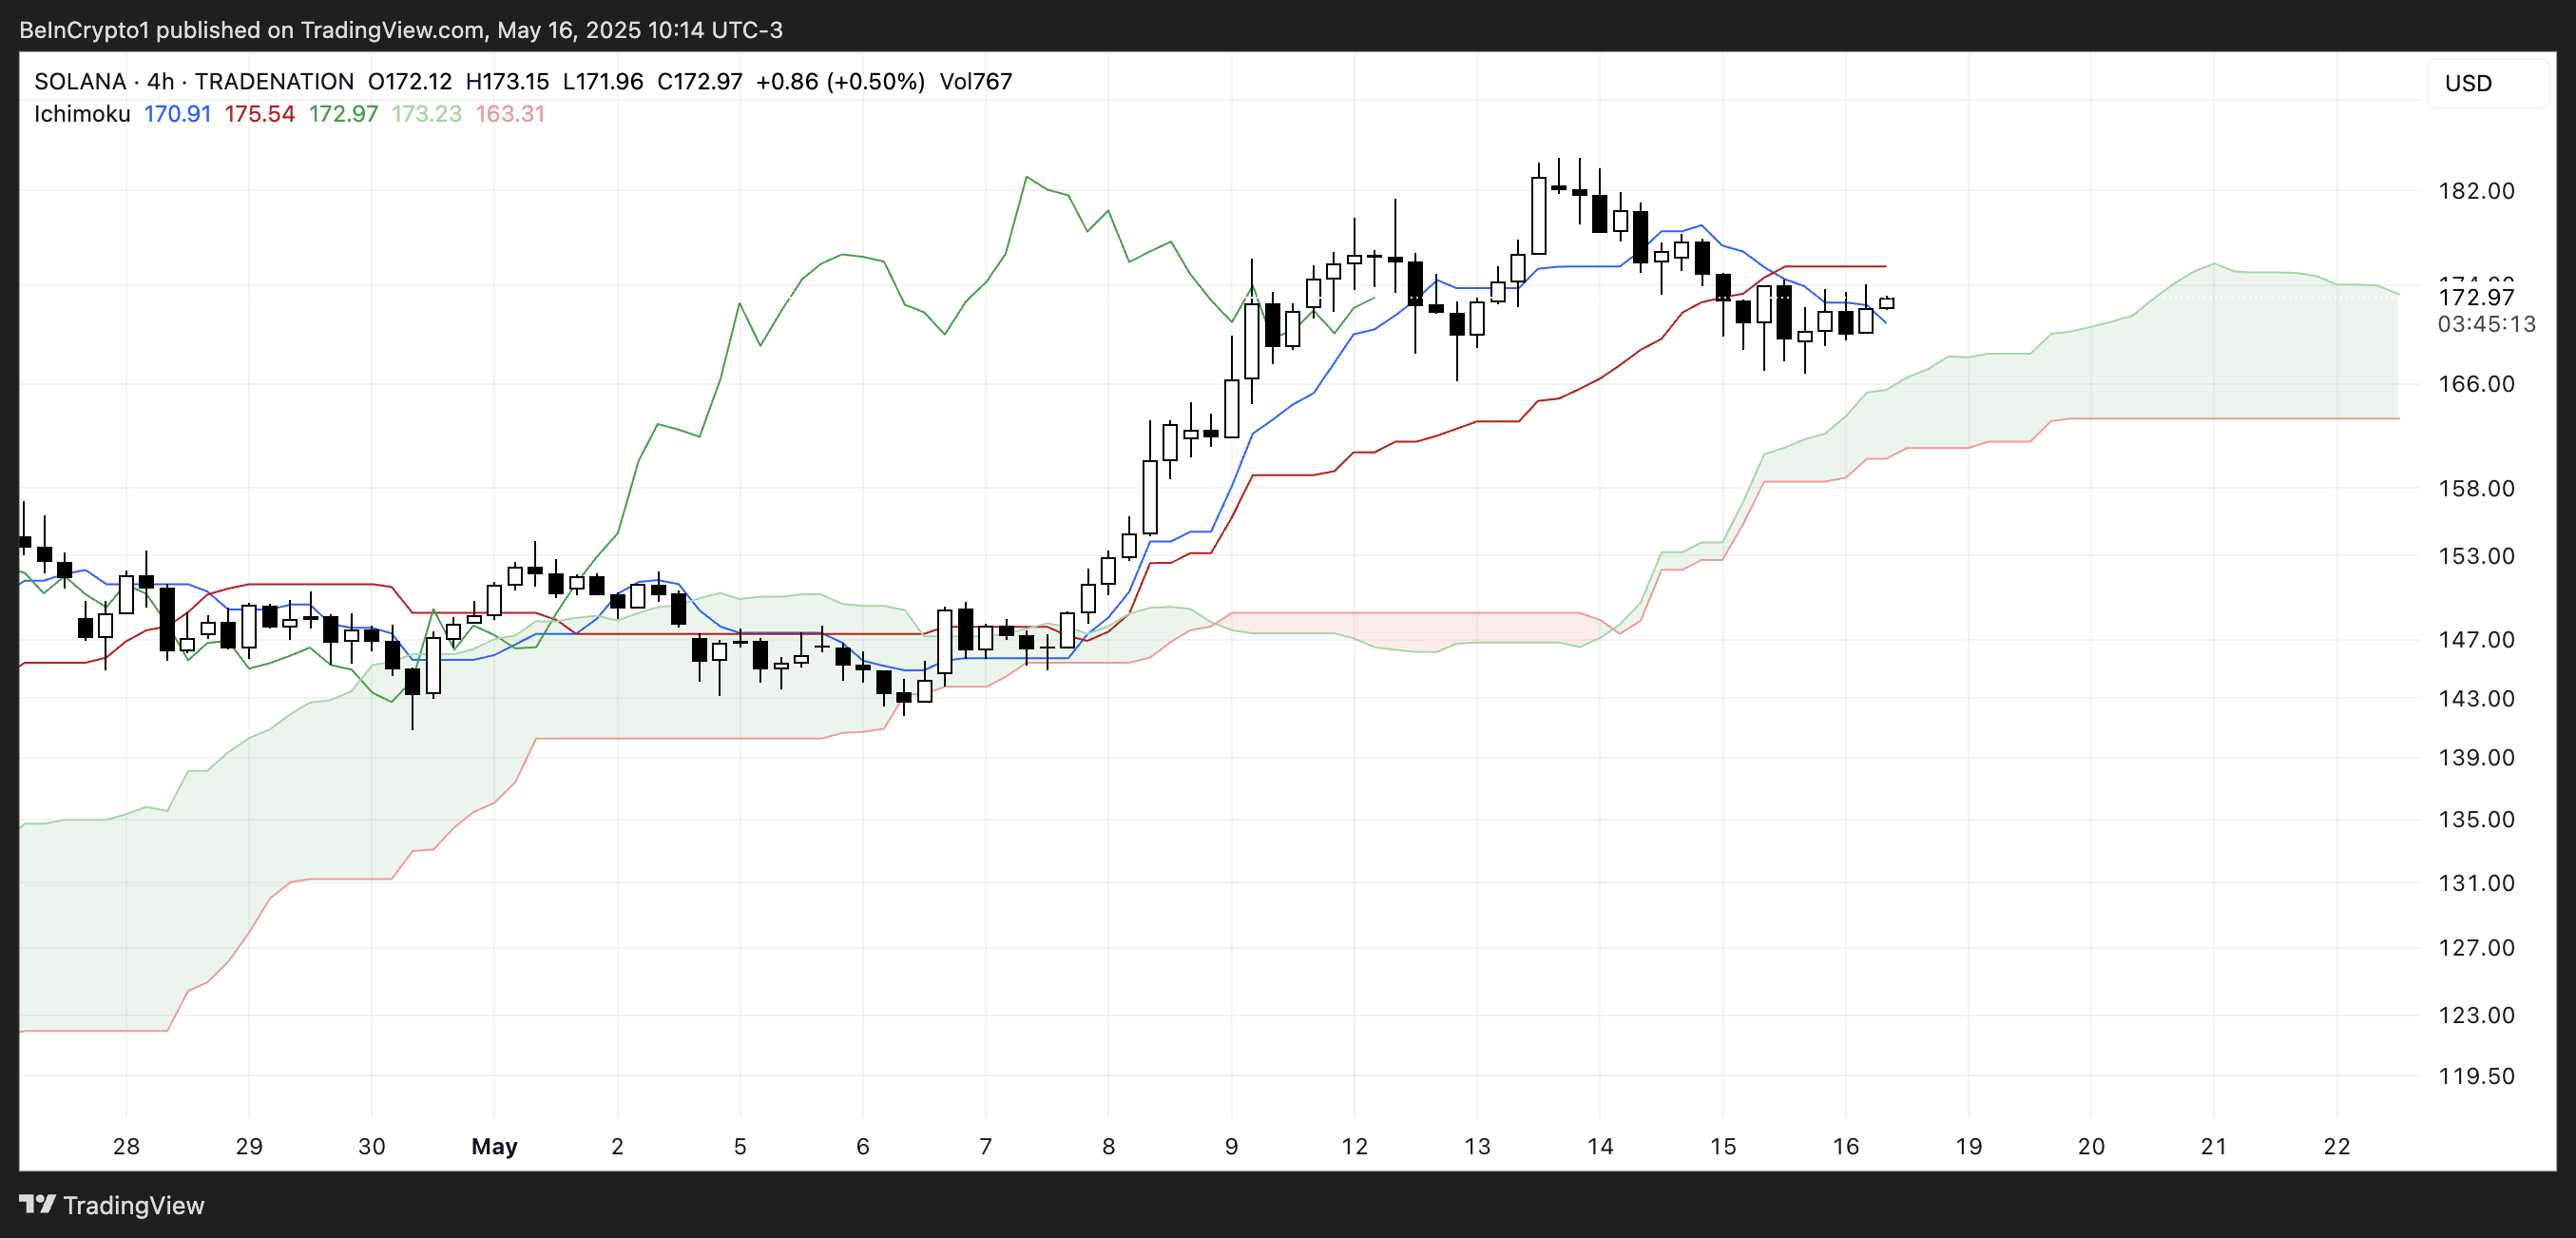
The price is hovering near the Kijun-sen (red line) and Tenkan-sen (blue line), both of which have started to flatten—indicating a slowdown in momentum.
The Chikou Span (green lagging line) remains above the candles, suggesting that the broader trend still has a bullish bias. However, the lack of distance between it and the current price action reflects weakening strength.
The Kumo Cloud (green and red shaded area) ahead is still bullish, with the leading span lines spread apart, providing support beneath the current price.
However, with candles now closely interacting with the Kijun-sen and failing to strongly break above the Tenkan-sen, the short-term sentiment appears cautious.
If the price can push decisively above the blue line, momentum may return, but any drift into the cloud could signal the start of a more prolonged consolidation phase or potential trend reversal.
Solana’s Bullish EMA Structure Faces Momentum Slowdown
Solana’s EMA lines remain bullish, with the short-term moving averages positioned above the longer-term ones. However, the gap between these lines is narrowing, suggesting that upward momentum is weakening.
Solana price recently failed to break past a key resistance level, and although a retest could open the path toward reclaiming the $200 zone, the lack of strong follow-through raises questions about the trend’s strength.
Complementing this cautious outlook, the Ichimoku Cloud and RSI indicators point to a potential cooldown. Solana recently held above an important support level but remains vulnerable—if that support breaks, further downside could follow.
The broader structure still leans bullish, but the market appears to be at a crossroads. The next move likely depends on whether buyers can reclaim initiative or sellers push through key lower levels.
XRP’s price action has been volatile over the past week, and right now, it’s testing a resistance level around the $2.19 to $2.20 mark. This level has proven difficult for XRP to break in recent days, with the token getting rejected each time it approaches this zone.
A confirmed move above $2.20, with prices holding steadily, could open the door for a rally toward the next target around $2.25. The next resistance area sits between $2.30 and $2.35.
Support Zones to Watch
On the downside, XRP has strong support levels between $2.10 and $2.07. If prices drop, these levels are expected to attract buying interest and potentially stabilize the market. As of now, XRP seems to be trading sideways within this range, showing no clear breakout in either direction.
A Market Moving with Bitcoin
XRP’s next big move could depend heavily on what Bitcoin does next. If Bitcoin struggles to break through its own resistance levels, altcoins like XRP could follow a similar path, staying range-bound for a little longer. On the other hand, if Bitcoin makes a strong breakout, it might give XRP the momentum it needs to move higher.
Long-Term Outlook Still Positive
Looking at the bigger picture, XRP has been holding firm within a wider price channel for several months. While the short-term trend appears neutral, the long-term setup remains bullish as long as prices stay above key support levels.
On the bullish side, XRP now has over 7.1 million wallets.. The price may be taking a short break, but another big move could be coming soon. At the time of writing, XRP is trading at $2.19. A successful push above $2.20 could be the first step in a fresh rally.
The post XRP Price Prediction For June 30 appeared first on Coinpedia Fintech News
XRP’s price action has been volatile over the past week, and right now, it’s testing a resistance level around the $2.19 to $2.20 mark. This level has proven difficult for XRP to break in recent days, with the token getting rejected each time it approaches this zone. A confirmed move above $2.20, with prices holding …