After coming close to its all-time high near $4,878 just days ago, the Ethereum price is now trading below $4,300. Despite the dip, it has managed to hold onto strong monthly gains of 15.3%, showing some resilience.
But while many short-term holders are jumping in to “buy the dip,” things aren’t all good for near-term traders. A key bearish signal is starting to show up on the 4-hour chart.
Short-Term Buyers Are Growing, While Reserves Stay Near Lows
The Ethereum HODL wave chart shows that new buyers have been slowly loading up over the past 30 days.
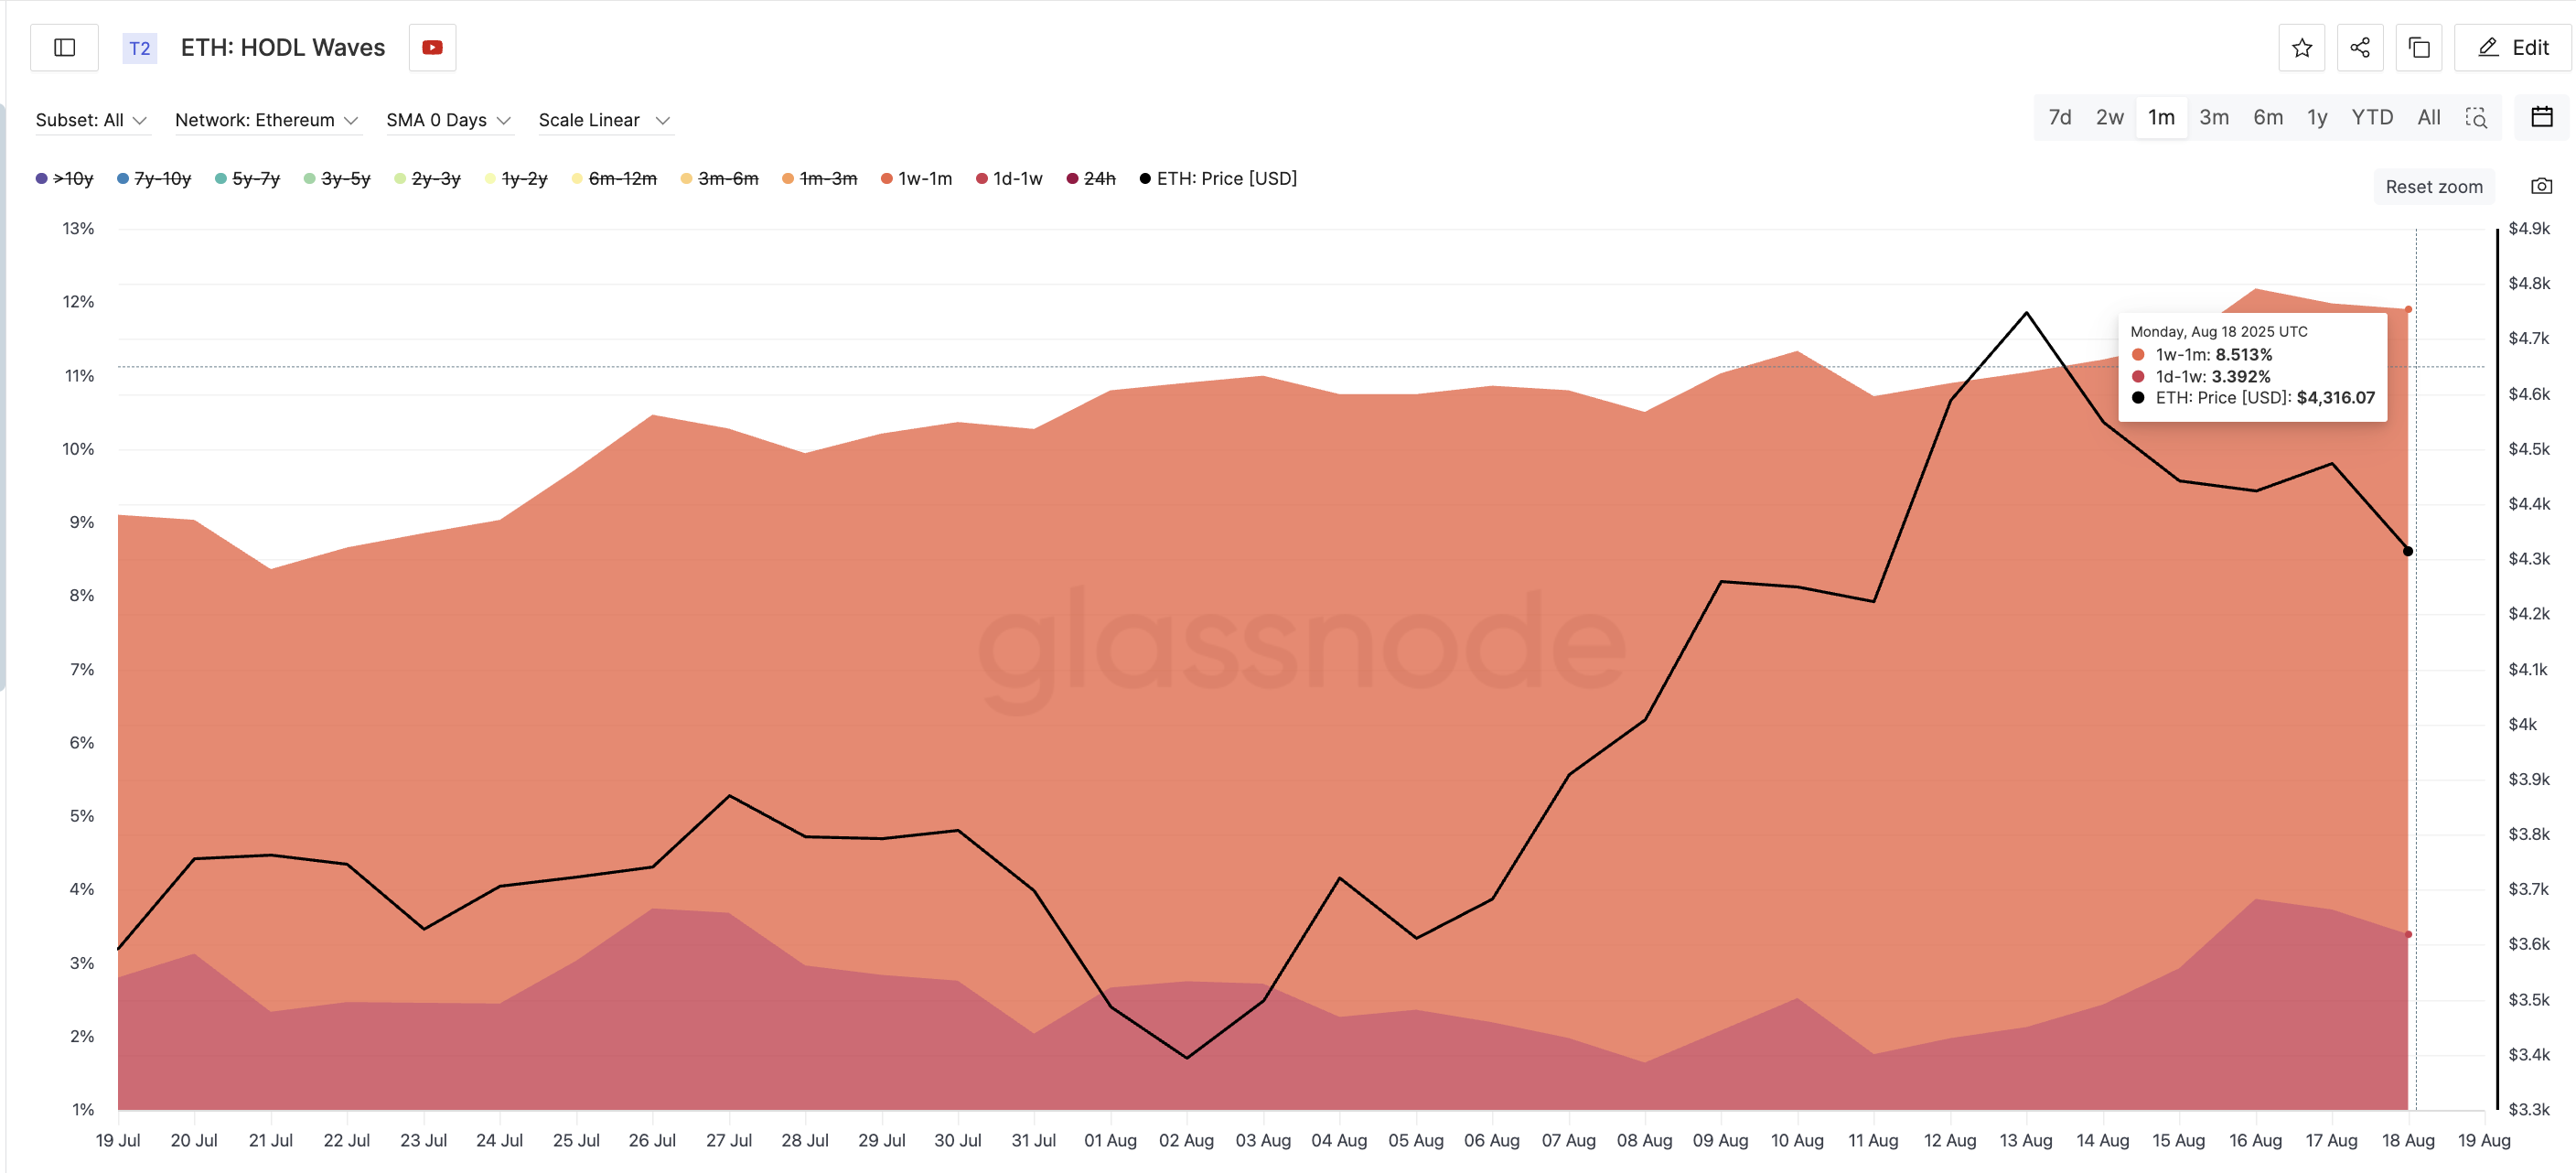
Two key short-term cohorts — wallets that held ETH for 1 day to 1 week, and 1 week to 1 month — have increased their share of supply:
- 1d–1w cohort grew from 2.8% to 3.39%
- 1w–1m cohort jumped from 6.3% to 8.5%
That’s a clear sign of fresh buying. It suggests dip-buying activity is picking up from traders who likely entered during the recent pullback. HODL Waves show the percentage of coins held over different time periods, helping identify shifts between long-term and short-term holders.
For token TA and market updates: Want more token insights like this? Sign up for Editor Harsh Notariya’s Daily Crypto Newsletter here.
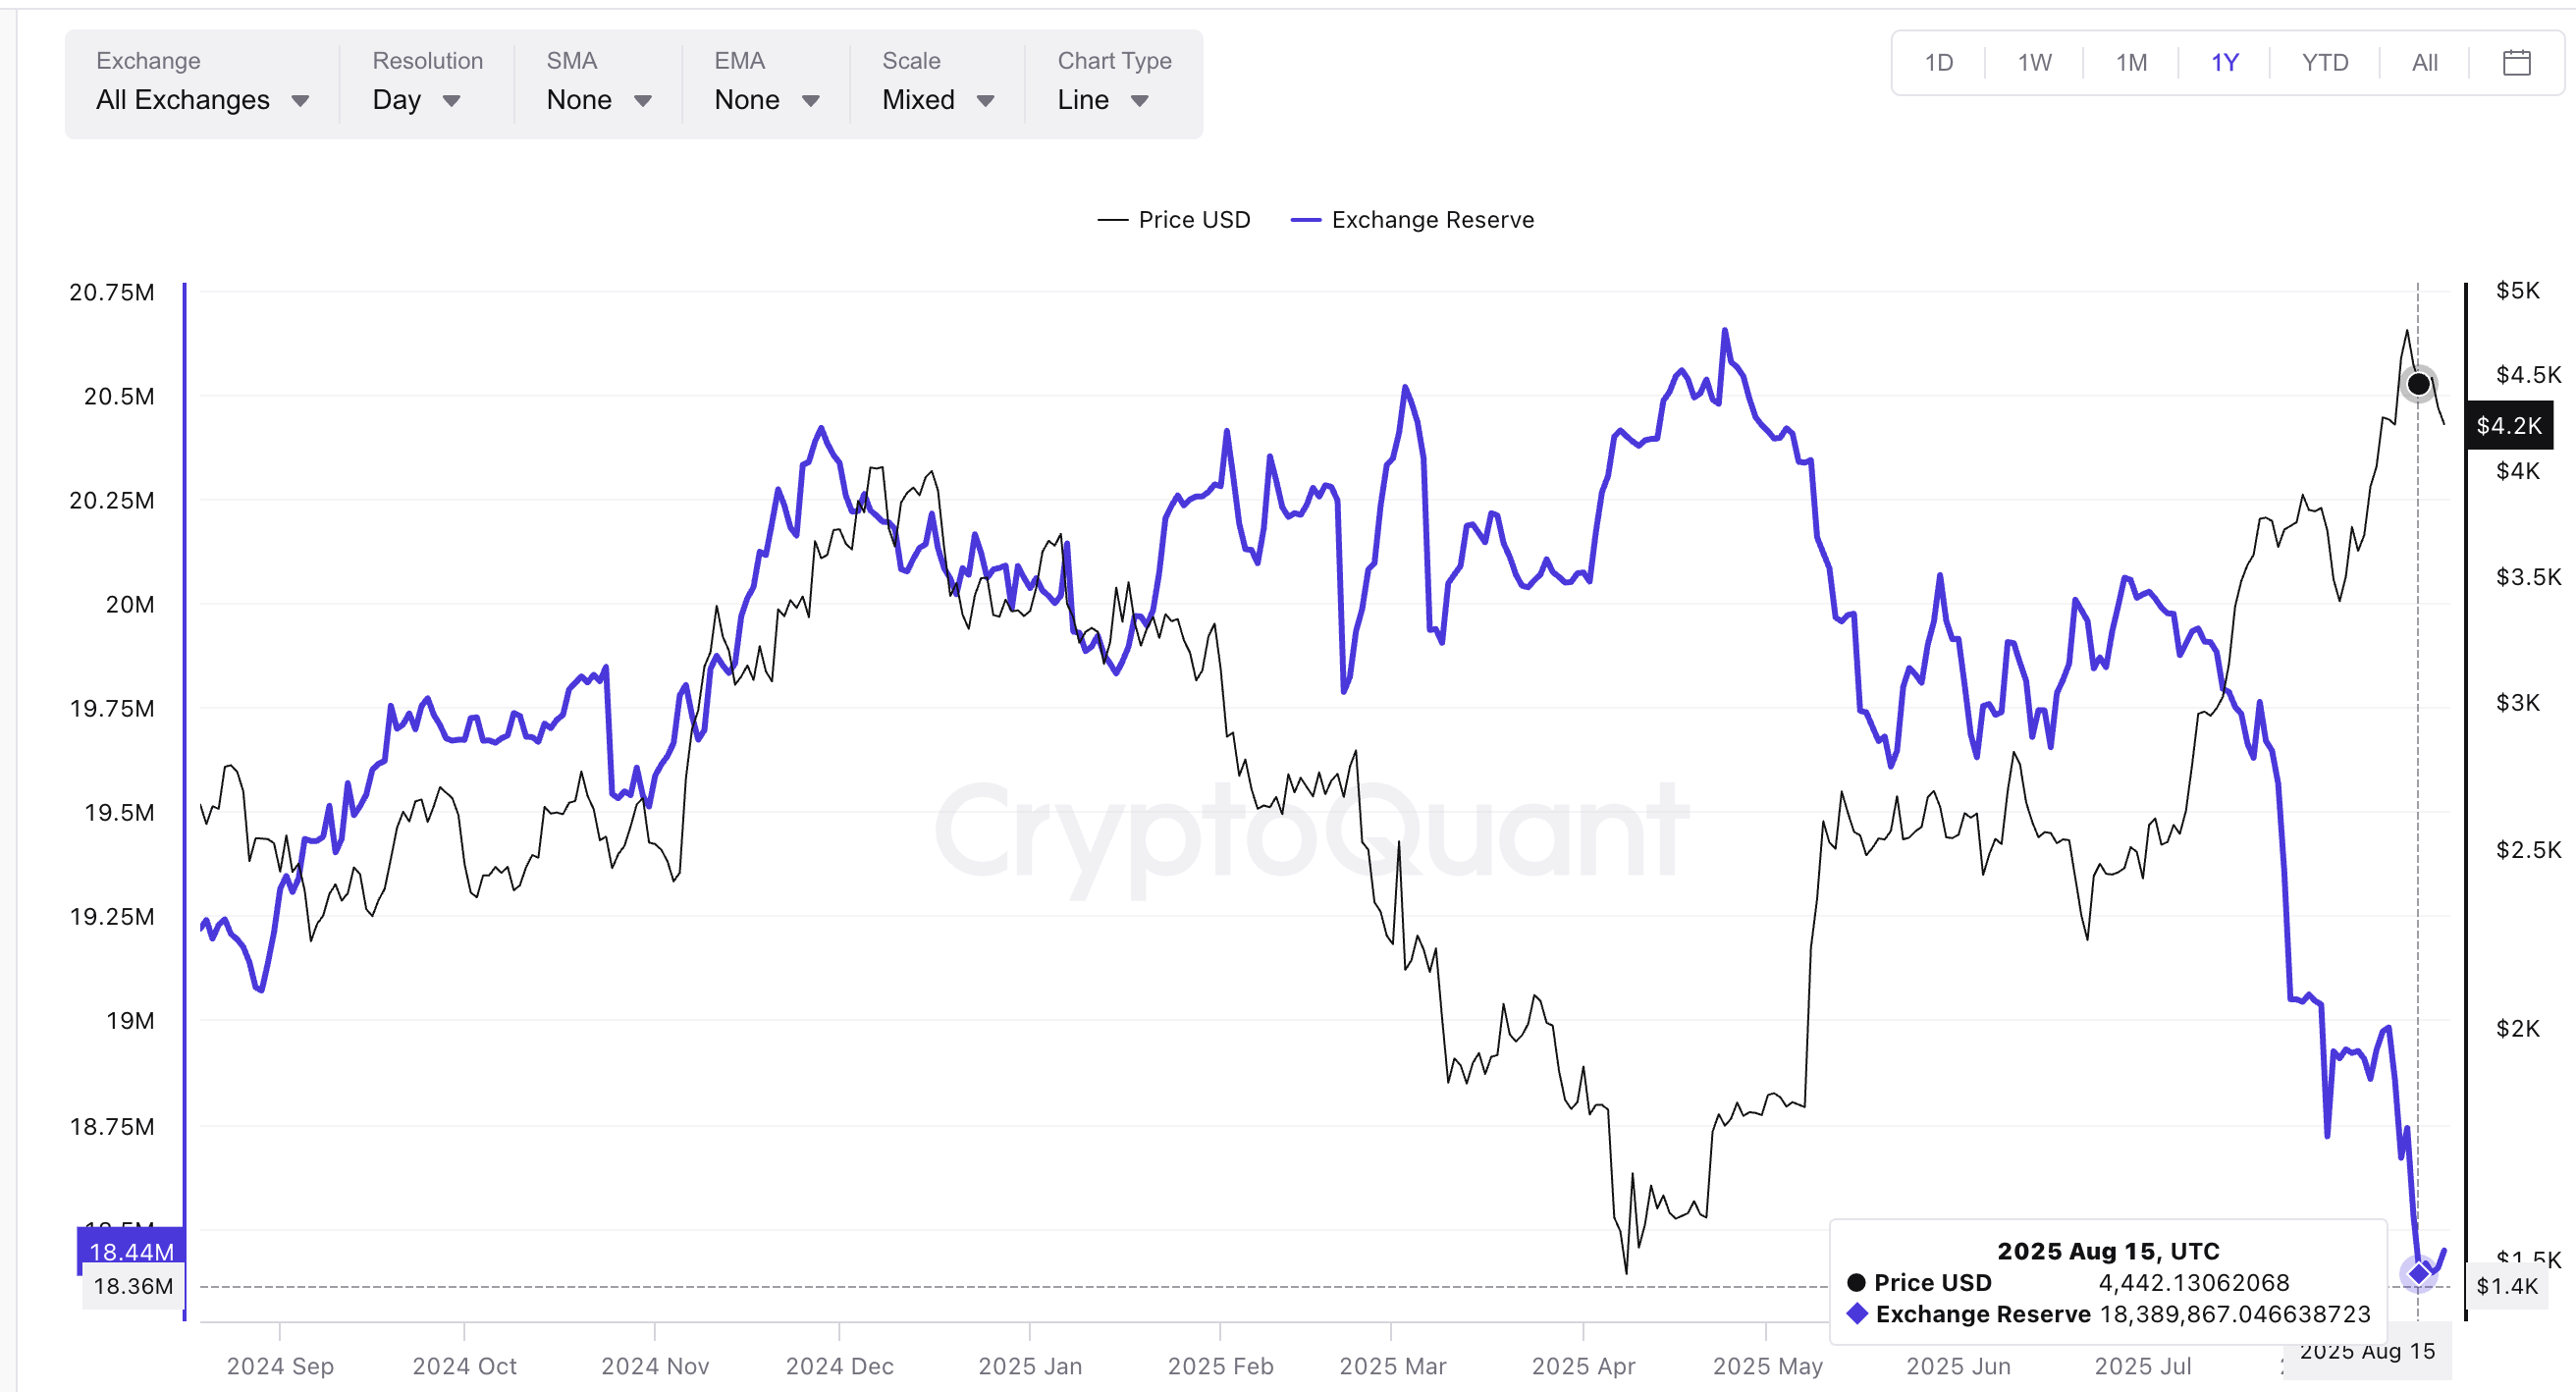
At the same time, Ethereum’s exchange reserves are still hovering around 9-year lows. Even after whale-led ETH inflows, the reserves moved only slightly from 18.389 million ETH on August 15 to 18.404 million ETH at press time. That’s still extremely low, meaning fresh buying keeps happening every time the Ethereum price dips.
Low reserves usually mean less ETH available for immediate selling; another good sign if traders are going long.
One Chart Pattern Could Send The Ethereum Price Down to $4,000
Despite the bullish signs from buyers and exchange flows, the short-term chart shows a potential problem.
On the 4-hour chart, the 20-period EMA or Exponential moving average (red line) is about to cross below the 50-period EMA (orange line) — a bearish “death” crossover. If this happens, it’s usually seen as a sign of incoming selling pressure.
The EMA is a type of moving average that gives more weight to recent prices, helping traders react faster to recent market changes. An EMA crossover occurs when a shorter-period EMA crosses above or below a longer-period EMA, often signaling a shift in price trend direction.
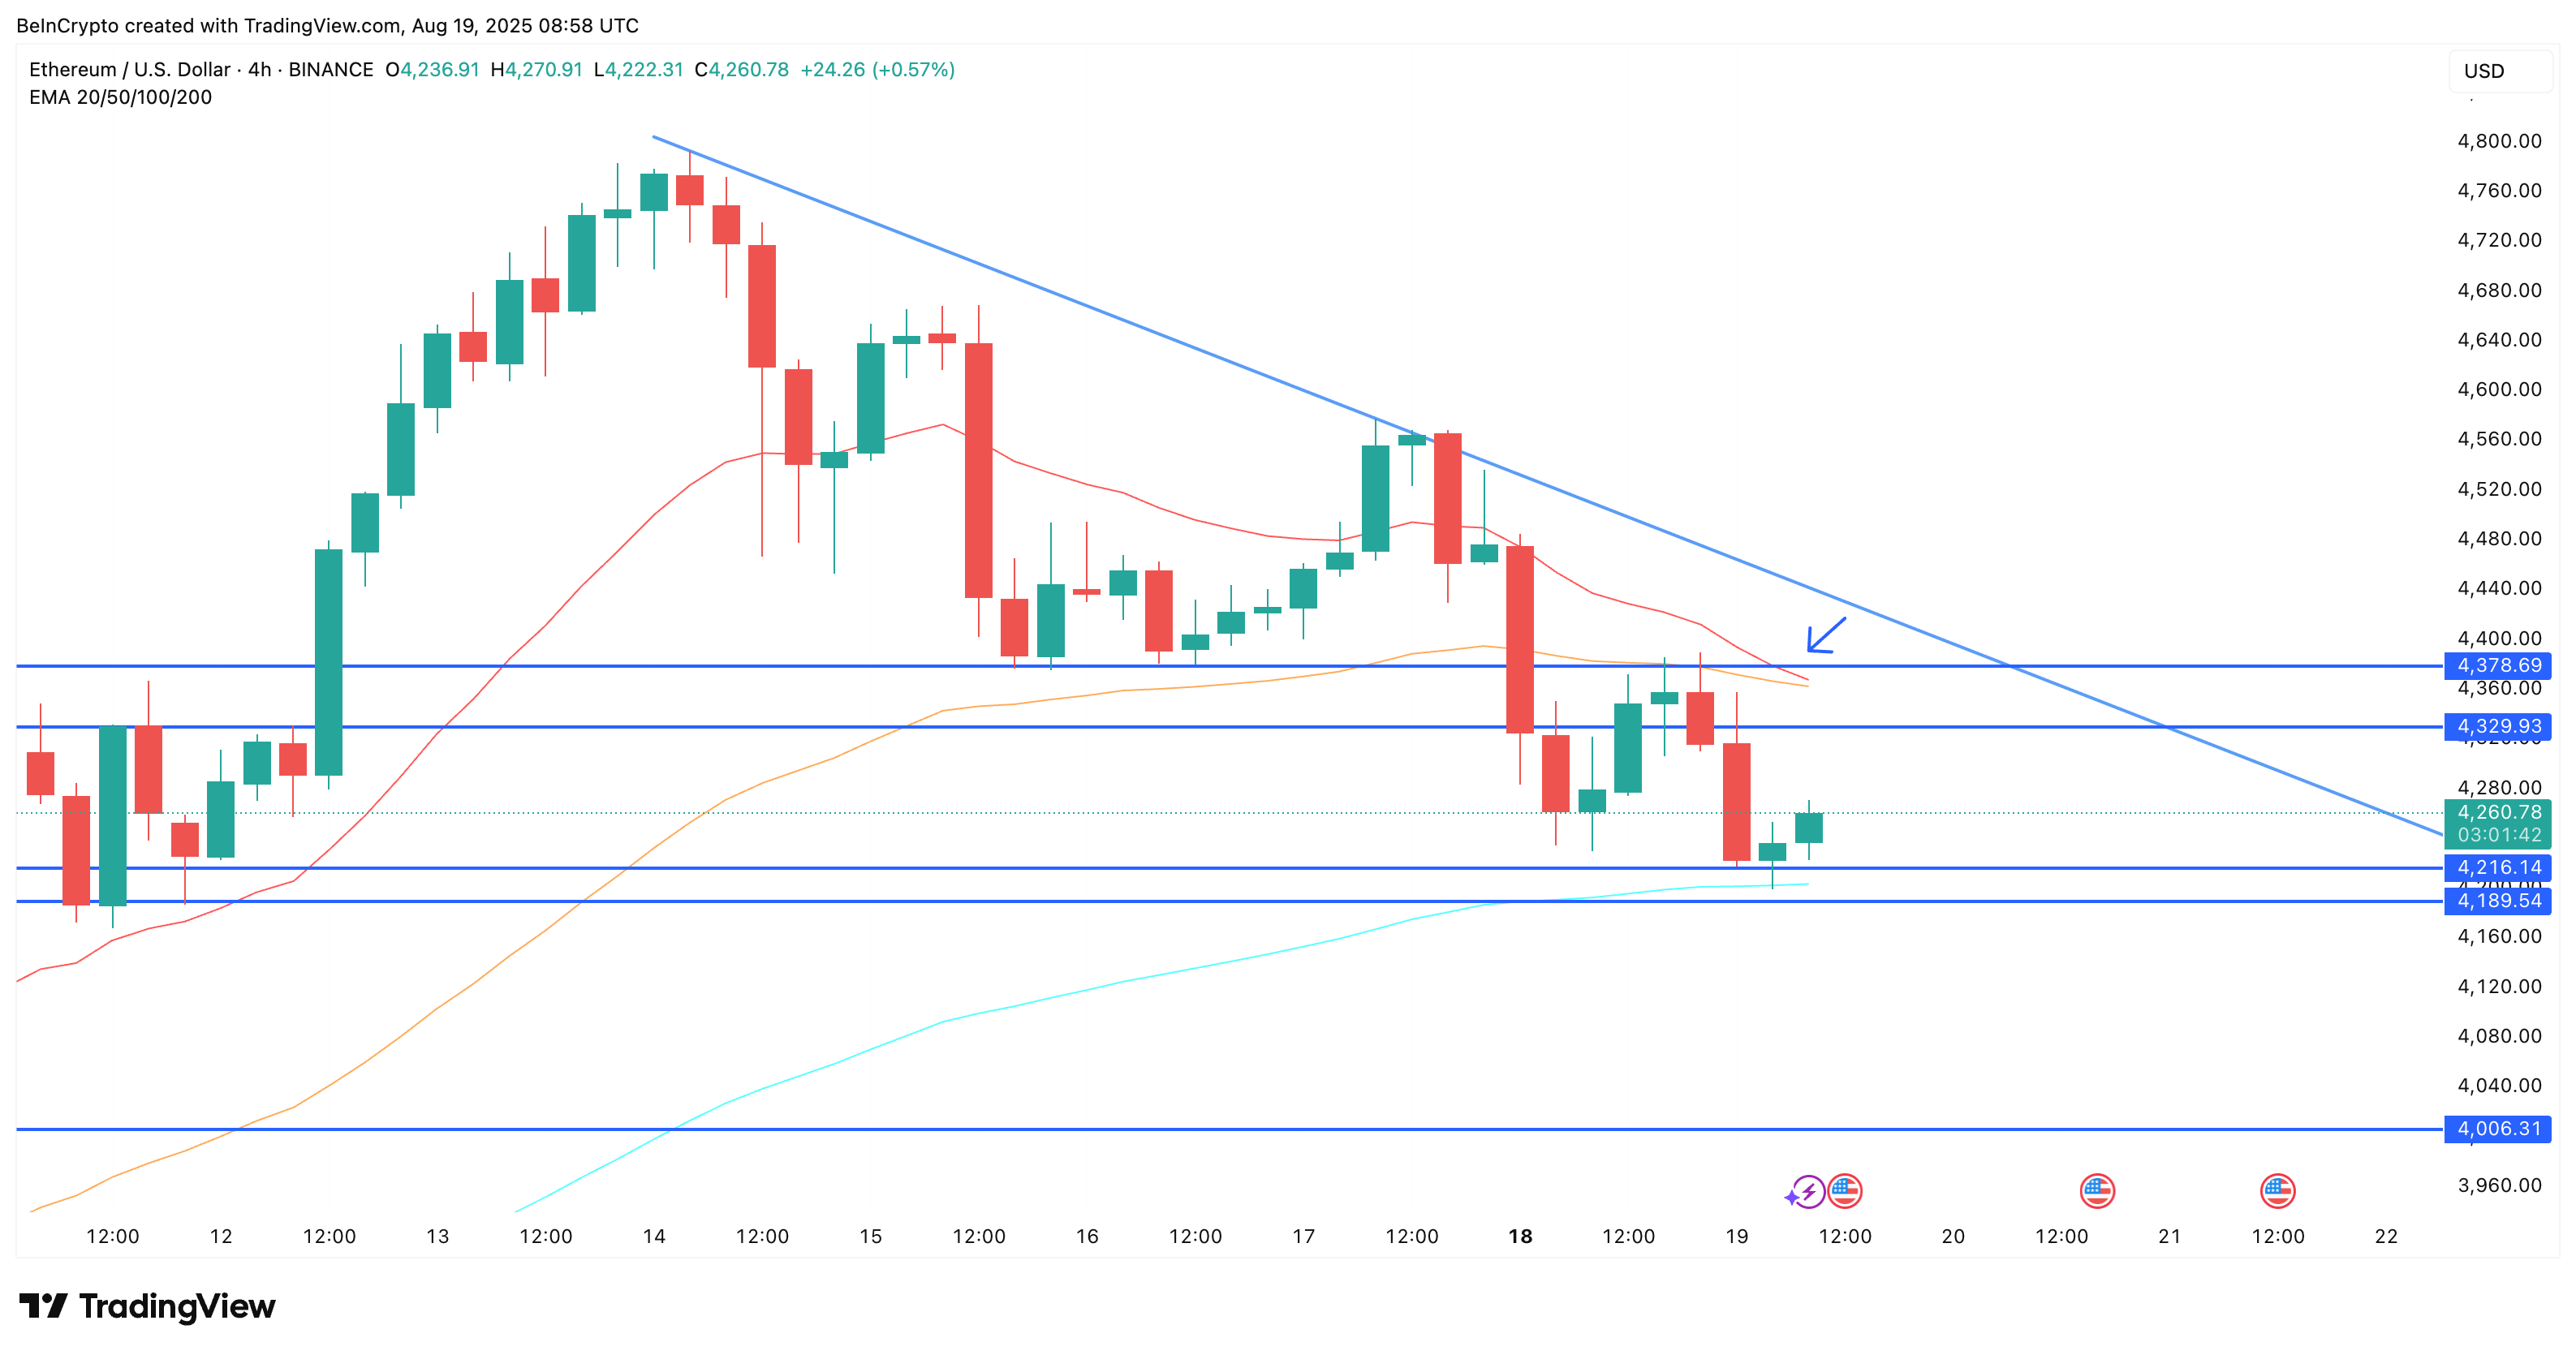
Additionally, the ETH price is currently forming a descending triangle, a bearish continuation pattern. It’s now testing two important support levels: $4,216 and $4,189. A break below these could trigger a sharper selloff.
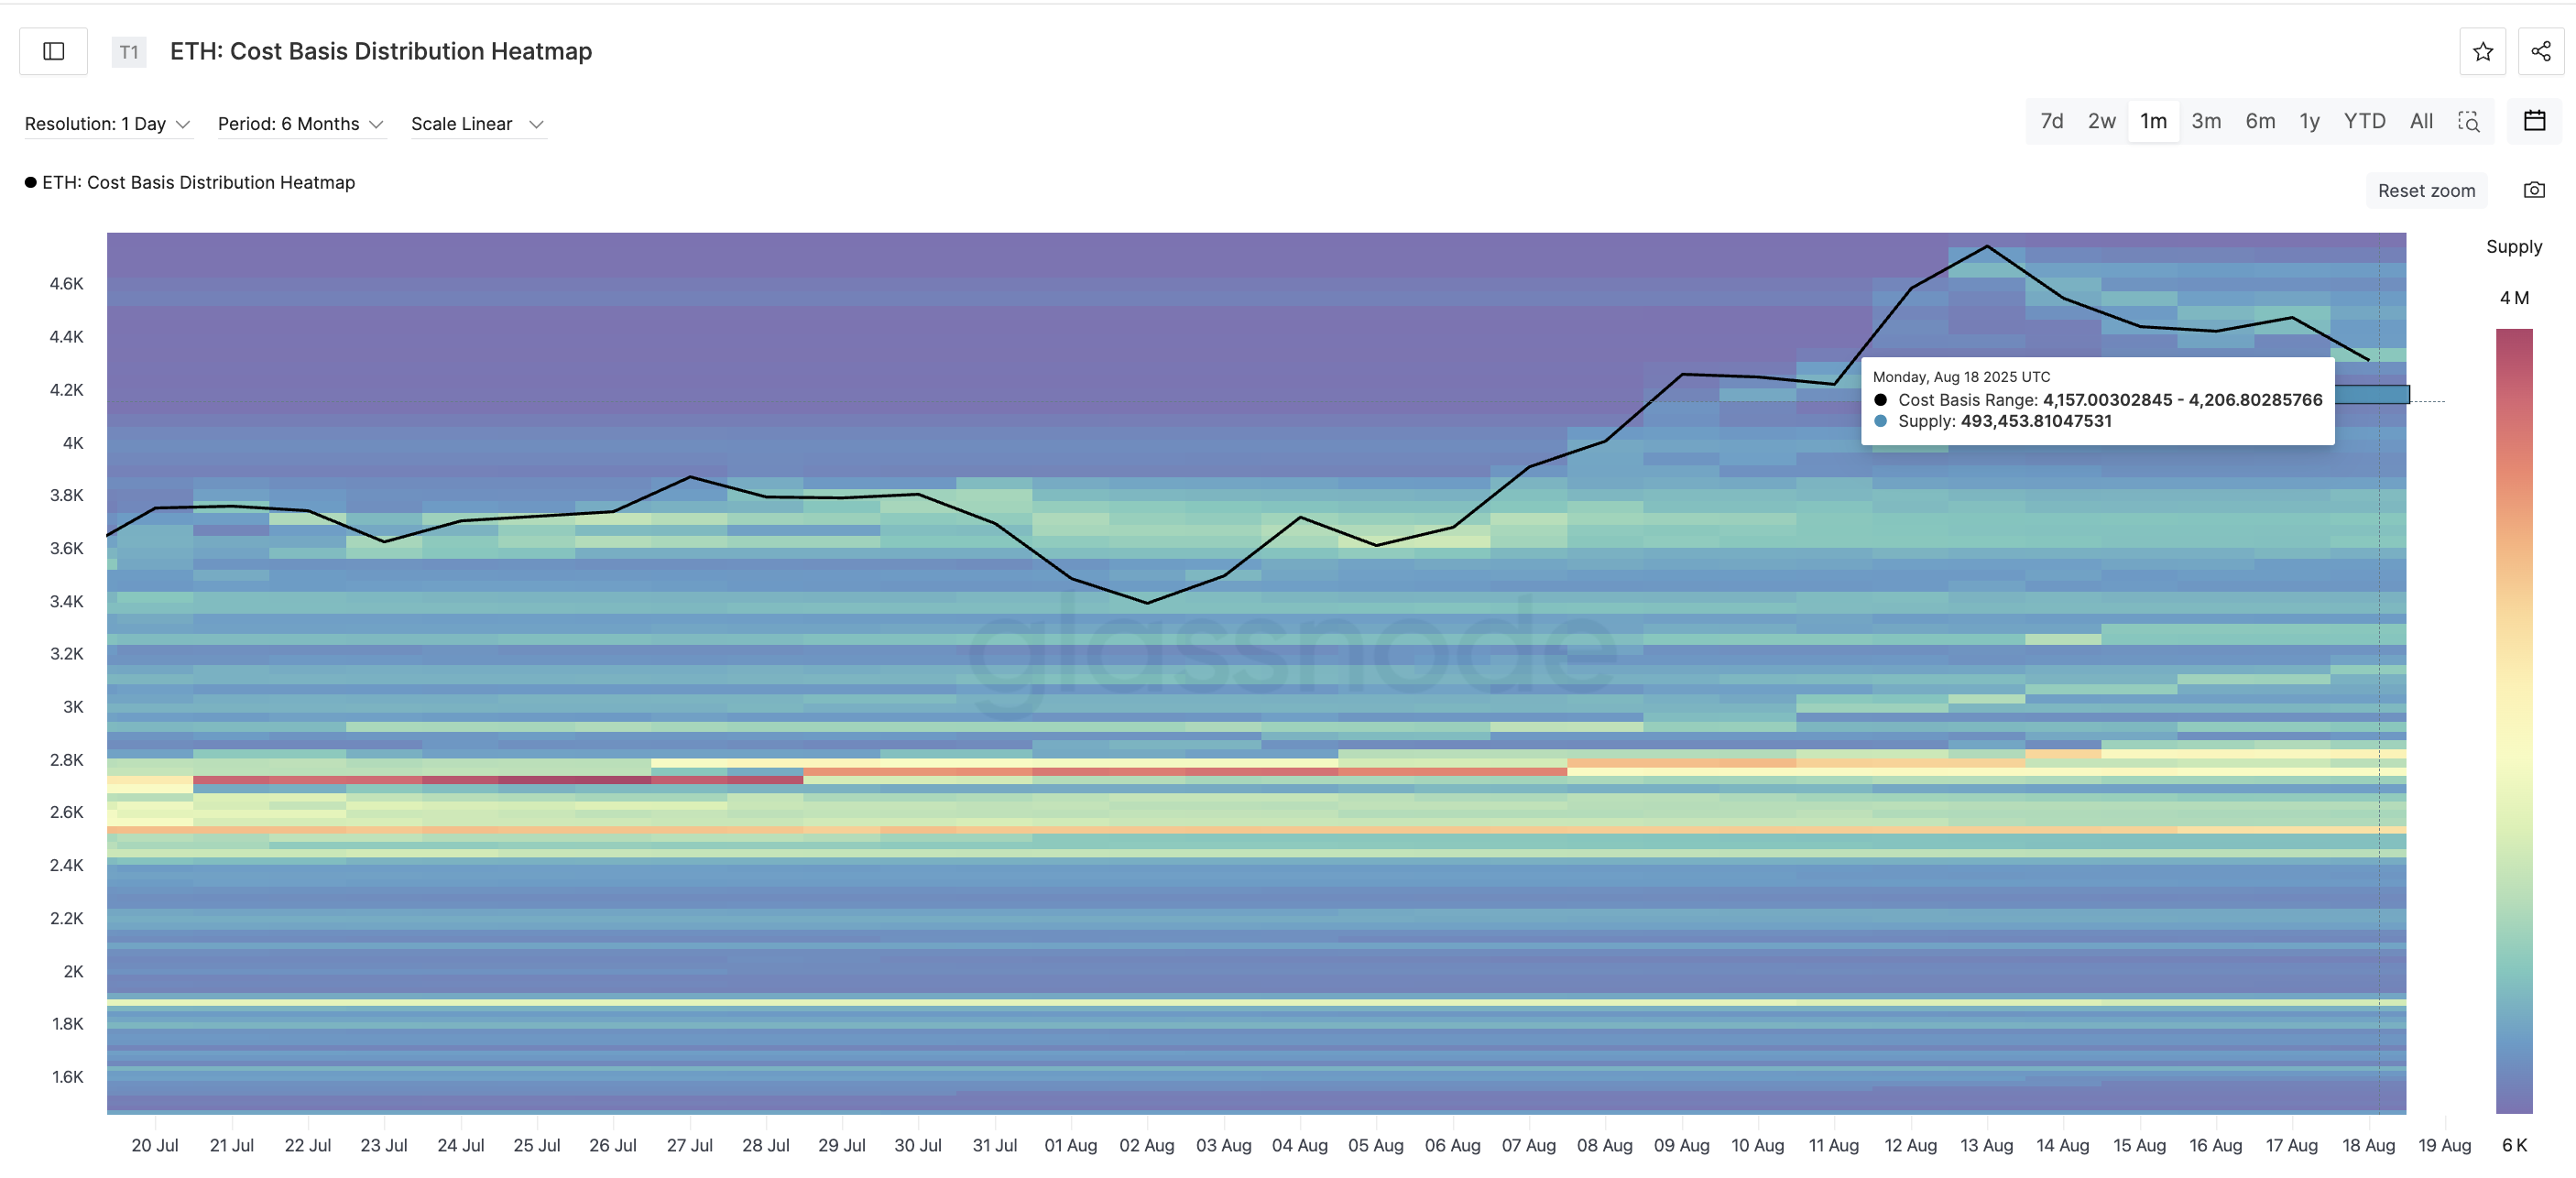
The heatmap further shows weak demand zones just below these levels. There isn’t much strong support at these levels, meaning ETH might fall quickly to $4,006 if sellers take control.
The bearish outlook would simmer down a bit if the Ethereum price manages to reclaim $4,378. In doing so, it might invalidate the bearish crossover and turn the 20-EMA and 50-EMA lines into support.
The post Ethereum Price Eyes Recovery as New Buyers Step In, Yet One Major Risk Looms appeared first on BeInCrypto.