On-chain data shows whales have been accumulating Ether relentlessly in the last few days.
ETH price has to consistently close above $1,687 in the coming days to invalidate the multi-week correction.
Ethereum has continued to bleed to Solana, and the trend is likely to continue in the coming months.
Ethereum (ETH) price followed Bitcoin (BTC) in a bullish outlook on Tuesday, April 22, potentially ending a multi-week market correction. The large-cap altcoin, with a fully diluted valuation of about $205 billion, recorded a 36 percent surge in its 24-hour average trading volume to hover about $20B at the time of this writing.
For the first time since April 6, Ether’s price rallied beyond $1.7k on Tuesday during the mid-North American session.
Ethereum Whales Gradually Returns
According to market data from Intotheblock, Ethereum’s adoption rate has gradually grown, signaling potential decoupling from crazy speculation. The rising tokenization of real-world assets (RWAs) on the Ethereum network has helped increase on-chain activity and attract more whale traders.
On-chain data by Lookonchain shows a whale investor has accumulated 48,477 ETH from crypto exchanges since Feb 15, and is currently sitting on a loss of about $21 million. Meanwhile, cash outflow from U.S. spot Ether ETFs has significantly declined in the past few days, signaling growing market confidence.
Midterm Ether Price Target
For the first time since the second inauguration of U.S. President Donald Trump, Ether price, against the U.S. dollar pierced through the daily falling logarithmic trend. After establishing a robust support level above $1,500 in the past two weeks, Ether’s price is well primed for a market reversal.
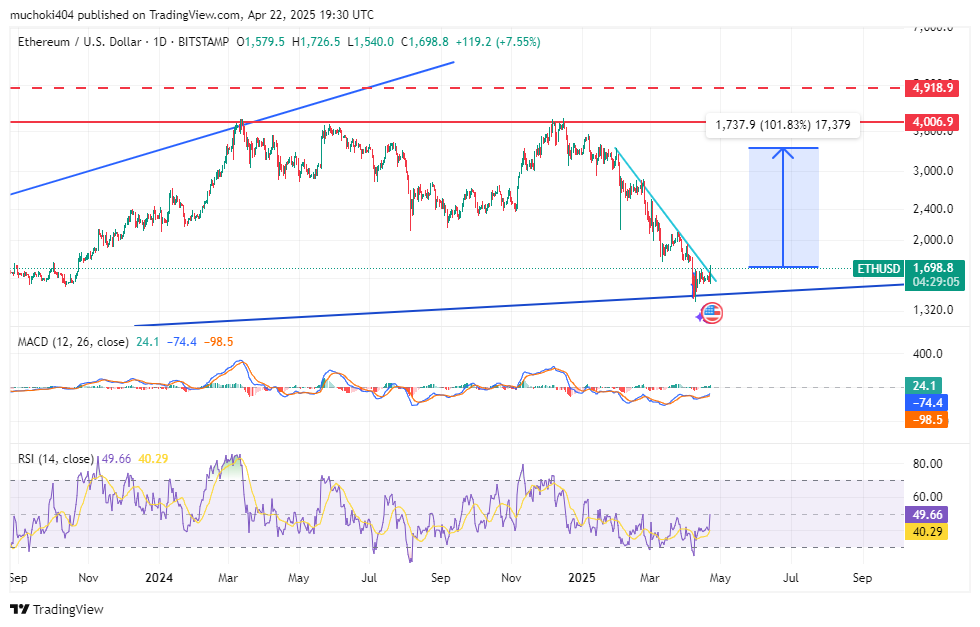
From a technical analysis standpoint, the daily MACD indicator is approaching the bullish flippening zone. Meanwhile, the daily Relative Strength Index (RSI) has been forming a bullish divergence and a reversal will be confirmed if the indicator consistently closes above the 50 percent level.
Made in USA coins have underperformed in the first 100 days of Trump’s new term, with all five leading US-linked assets down at least 20% since January 20. This comes despite the administration’s more crypto-friendly tone and a recent wave of regulatory relief.
In contrast, non–USA coins like Bitcoin and TRON have held up better, showing more resilience even as Ethereum and Dogecoin posted steep losses. The divergence highlights the impact of broader policy pressures—such as tariffs—potentially offsetting domestic crypto reforms.
Made in USA Coins Struggle Under the Trump Era
All five leading “Made in USA” coins have declined by at least 20% since January 20, the day of Trump’s inauguration. While recent short-term gains have helped improve sentiment, the broader 100-day trend remains negative for these U.S.-linked assets.
This performance comes despite expectations of a more favorable environment for crypto under the current administration.
Solana (SOL) is the weakest performer in this group, down over 41% since Trump took office, even after gaining more than 18% in the past 30 days.
On the other hand, SUI has rallied 58% in the same period, supported by strong growth in meme coin trading and decentralized exchange (DEX) volume. Recently, it became the fifth-largest chain by DEX activity.
ADA, LINK, and XRP have all posted modest gains between 7% and 10% over the past month, but remain down more than 24% in the first 100 days of the administration.
Made in USA Coins Performance Since January 20. Source: Messari.
The overall performance of Made in USA coins has diverged from initial expectations following Trump’s return, which included promises of a more crypto-friendly stance.
While the SEC, now under Paul Atkins, has dropped several cases against crypto firms, removing regulatory overhang, other policy developments may limit the upside.
In particular, ongoing trade pressures tied to Trump’s tariff strategy may create additional headwinds for U.S.-linked crypto assets.
Despite ETH and DOGE Losses, Non–USA Coins Hold Up Better
Among the five largest non–USA coins, only two have posted significant losses over the last 100 days. Ethereum (ETH) has fallen by more than 43%, and Dogecoin (DOGE) has fallen by nearly 51%.
These declines stand out sharply, especially given the more stable performance of other top assets. Bitcoin (BTC) is down just 6% in the same period, while BNB has slipped by nearly 12%.
Short-term trends offer a more balanced view. Bitcoin has gained nearly 16% over the past 30 days, reflecting stronger momentum than its peers.
Biggest Coins (Excluding Made in USA Coins) Performance Since January 20. Source: Messari.
DOGE is up more than 7% in the same window, while BNB and ETH have remained largely flat. TRON (TRX) is the only top coin outside the US-linked group to post gains over both timeframes, up 7.5% over the last 100 days.
The broader group of global assets has fared relatively better than Made in USA coins. Despite steep losses in ETH and DOGE, the group has outperformed Made in USA coins like SOL and ADA, many of which have dropped more than 20–40% in the same timeframe.
This divergence suggests that while regulatory sentiment in the US may improve, macro and policy-specific headwinds could weigh more heavily on domestic crypto assets.
Both Bitcoin and the stock markets surged today after Treasury Secretary Scott Bessent allegedly suggested that tariffs with China will be eased. This is the second time in a month that tariff rumors led to a market rally.
However, TradFi market hype began deflating without the White House assuring a pause, while Bitcoin remained steady. This could prove a useful data point that Bitcoin is decoupling from the stock market after previous correlation.
Today, a Bloomberg report claims that Scott Bessent believes that the US will de-escalate proposed China tariffs.
“The next steps with China are, no one thinks the current status quo is sustainable at 145 and 125 [percent]. So I would posit that over the very near future, there will be a de-escalation. And I think that that should give the world, the markets, a sigh of relief… We have an embargo now, on both sides, right?” one source claimed Bessent said.
Immediately after this rumor began circulating, Bitcoin’s price began rising alongside traditional stocks. The Dow Jones rebounded 1,000 points, the S&P 500 went up by 500, and Nasdaq rose 3%.
Together, these factors created a fresh degree of market optimism.
Bitcoin Daily Price Chart. Source: BeInCrypto
Bessent, a longtime crypto advocate, has been more ambivalent than other cabinet members like Peter Navarro or Howard Lutnick regarding tariffs.
Additionally, regardless of his personal beliefs, he has no actual authority to change Trump’s decision. After a period of relief, TradFi stocks began to fall once again.
Nasdaq Deflates from Tariff Hopes. Source: Google Finance
There are two interesting takeaways from this. First of all, two weeks ago, the stock market fell after the White House officially denied pause rumors. Today, however, there hasn’t been any official response to Bessent’s tariff comments.
Nonetheless, traditional markets still fell, while BTC remained steady above $91,000 and the overall crypto market cap hit $2.96 trillion.
Does this data give credence to the notion that Bitcoin will be safe during a recession? It’s hard to say so far. If it rises alongside bullish macroeconomic developments but remains stable during bearish ones, that seems too good to be true.
Still, it’s subject to very different concerns from TradFi. Investors should closely examine further tariff rumors in the future.
Ethereum price plunged below $1,600 over the weekend as BTC’s slide ignited sharp liquidations across major altcoins, including ETH.
Ethereum (ETH) dips below $1,700 as BTC Weakness Spreads to Atcoin Markets
Ethereum (ETH) sharply turned bearish over the weekend as bearish headwins from the US trade war extended towards the crypto sector.
On Sunday April 6, ETH price dropped to a 3-week low near $1,650 on Sunday, April 6, tracking Bitcoin’s rapid decline below the psychologically critical $80,000 mark.
Bitcoin weekend slump triggered panic across altcoin markets, and Ethereum was no exception—recording a sharp 11.24% drop within 24 hours.
Ethereum (ETH) Price Action, April 6 | Source: CoinMarketCap
According to data from CoinMarketCap, the 11% downtrend representing its lowest intraday print since mid-March.
The move erased nearly all of last week’s gains, which had come after Ethereum briefly climbed above $1,770 during Thursday’s risk-off rally sparked by China’s reciprocal tariffs.
The initial ETH bullish momentum, however, has unraveled as BTC bulls failed to sustain upside pressure into the weekend, leading to cascading losses across the broader crypto ecosystem.
Ethereum Liquidation Map Shows ETH Bulls Have $79M Lifeline at $1,554
Coinglass liquidation data paints a grim but actionable picture for ETH traders. Over the past 24 hours, Ethereum has seen more than $164.7 million in long liquidations—second only to Bitcoin, which accounted for $203.7 million.
The bulk of these liquidations occurred during Sunday’s swift plunge, suggesting bulls were heavily leveraged during BTC’s decline.
The Ethereum liquidation heatmap from Coinglass highlights a significant support concentration around the $1,550–$1,570 region. Specifically, over $76.2 million in leveraged long interest is stacked at the $1,554 level.
This zone now acts as a key inflection point: if ETH price defends this level, it could serve as a springboard for recovery as bargain buyers step in. However, if that support crumbles, a steeper correction toward $1,480 or even $1,420 could play out, as there are few notable liquidity cushions below that range.
With Bitcoin still struggling below $80,000, Ethereum’s near-term prospects remain fragile. Until BTC reclaims lost ground and market confidence stabilizes, ETH bulls face the dual threat of weak price action and thinning order book support.
For now, all eyes remain on the $1,554 liquidation cluster. A strong defense of this level, combined with increased market volumes could prevent further losses. Otherwise, Ethereum’s next leg may head deeper into the low-$1,500s, as bears tighten their grip heading into the new trading week.
Ethereum Price Forecast: ETH Risks $1,480 as RSI Hits Oversold and Price Breaks Below $1,655 VWAP
Ethereum price forecast signals lean negative, having plunged 11.73% to $1,594—its largest single-day loss in over a month. This decline was fueled by Bitcoin’s collapse below $80,000, triggering cross-market liquidations that erased recent gains across the altcoin complex.
Ethereum’s rejection near $1,800 and breakdown through $1,655—the VWAP level—confirms renewed downside momentum, with ETH now trading decisively below its 8-EMA and 21-EMA.
Ethereum Price Forecast
The Ethereum price forecast now leans cautiously bearish as technical indicators deteriorate.
The daily RSI prints 28.59, confirming oversold territory for the first time since early March. While this suggests a short-term bounce could develop, it also reflects capitulation from bulls, especially as the broader trend structure continues to weaken.
Price action is now below the 50-day SMA at $1,787 and far under the 200-day SMA at $1,894—both critical resistance levels that previously provided directional bias for long setups.
A bullish defense at $1,555 could stabilise sentiment, but failure to hold that lifeline increases the likelihood of testing $1,480, a key liquidity pocket. Unless Bitcoin reclaims $80K soon, Ethereum may remain vulnerable to further weakness. Near-term recovery will depend on buyers reclaiming $1,655 and sustaining momentum above the short-term EMAs.