Ethereum developers are proposing a 4x increase in the gas limit to 150M for the upcoming Fusaka hard fork. This adjustment aims to boost Layer 1 (L1) execution, enabling the network to manage more transactions with greater efficiency. By raising the gas limit, Ethereum seeks to enhance its overall performance, ensuring smoother operations and better scalability as the network evolves.
Ethereum price sits at $3,677, up about 16.5% this week. It keeps stepping over $3,800, only to get shoved back down.
With a big unstaking queue hanging in the background and momentum cooling a bit, the obvious question is whether this door finally swings open or shuts again. Two key metrics can help understand what happens from here.
Exchange Supply Ratio Near Lows
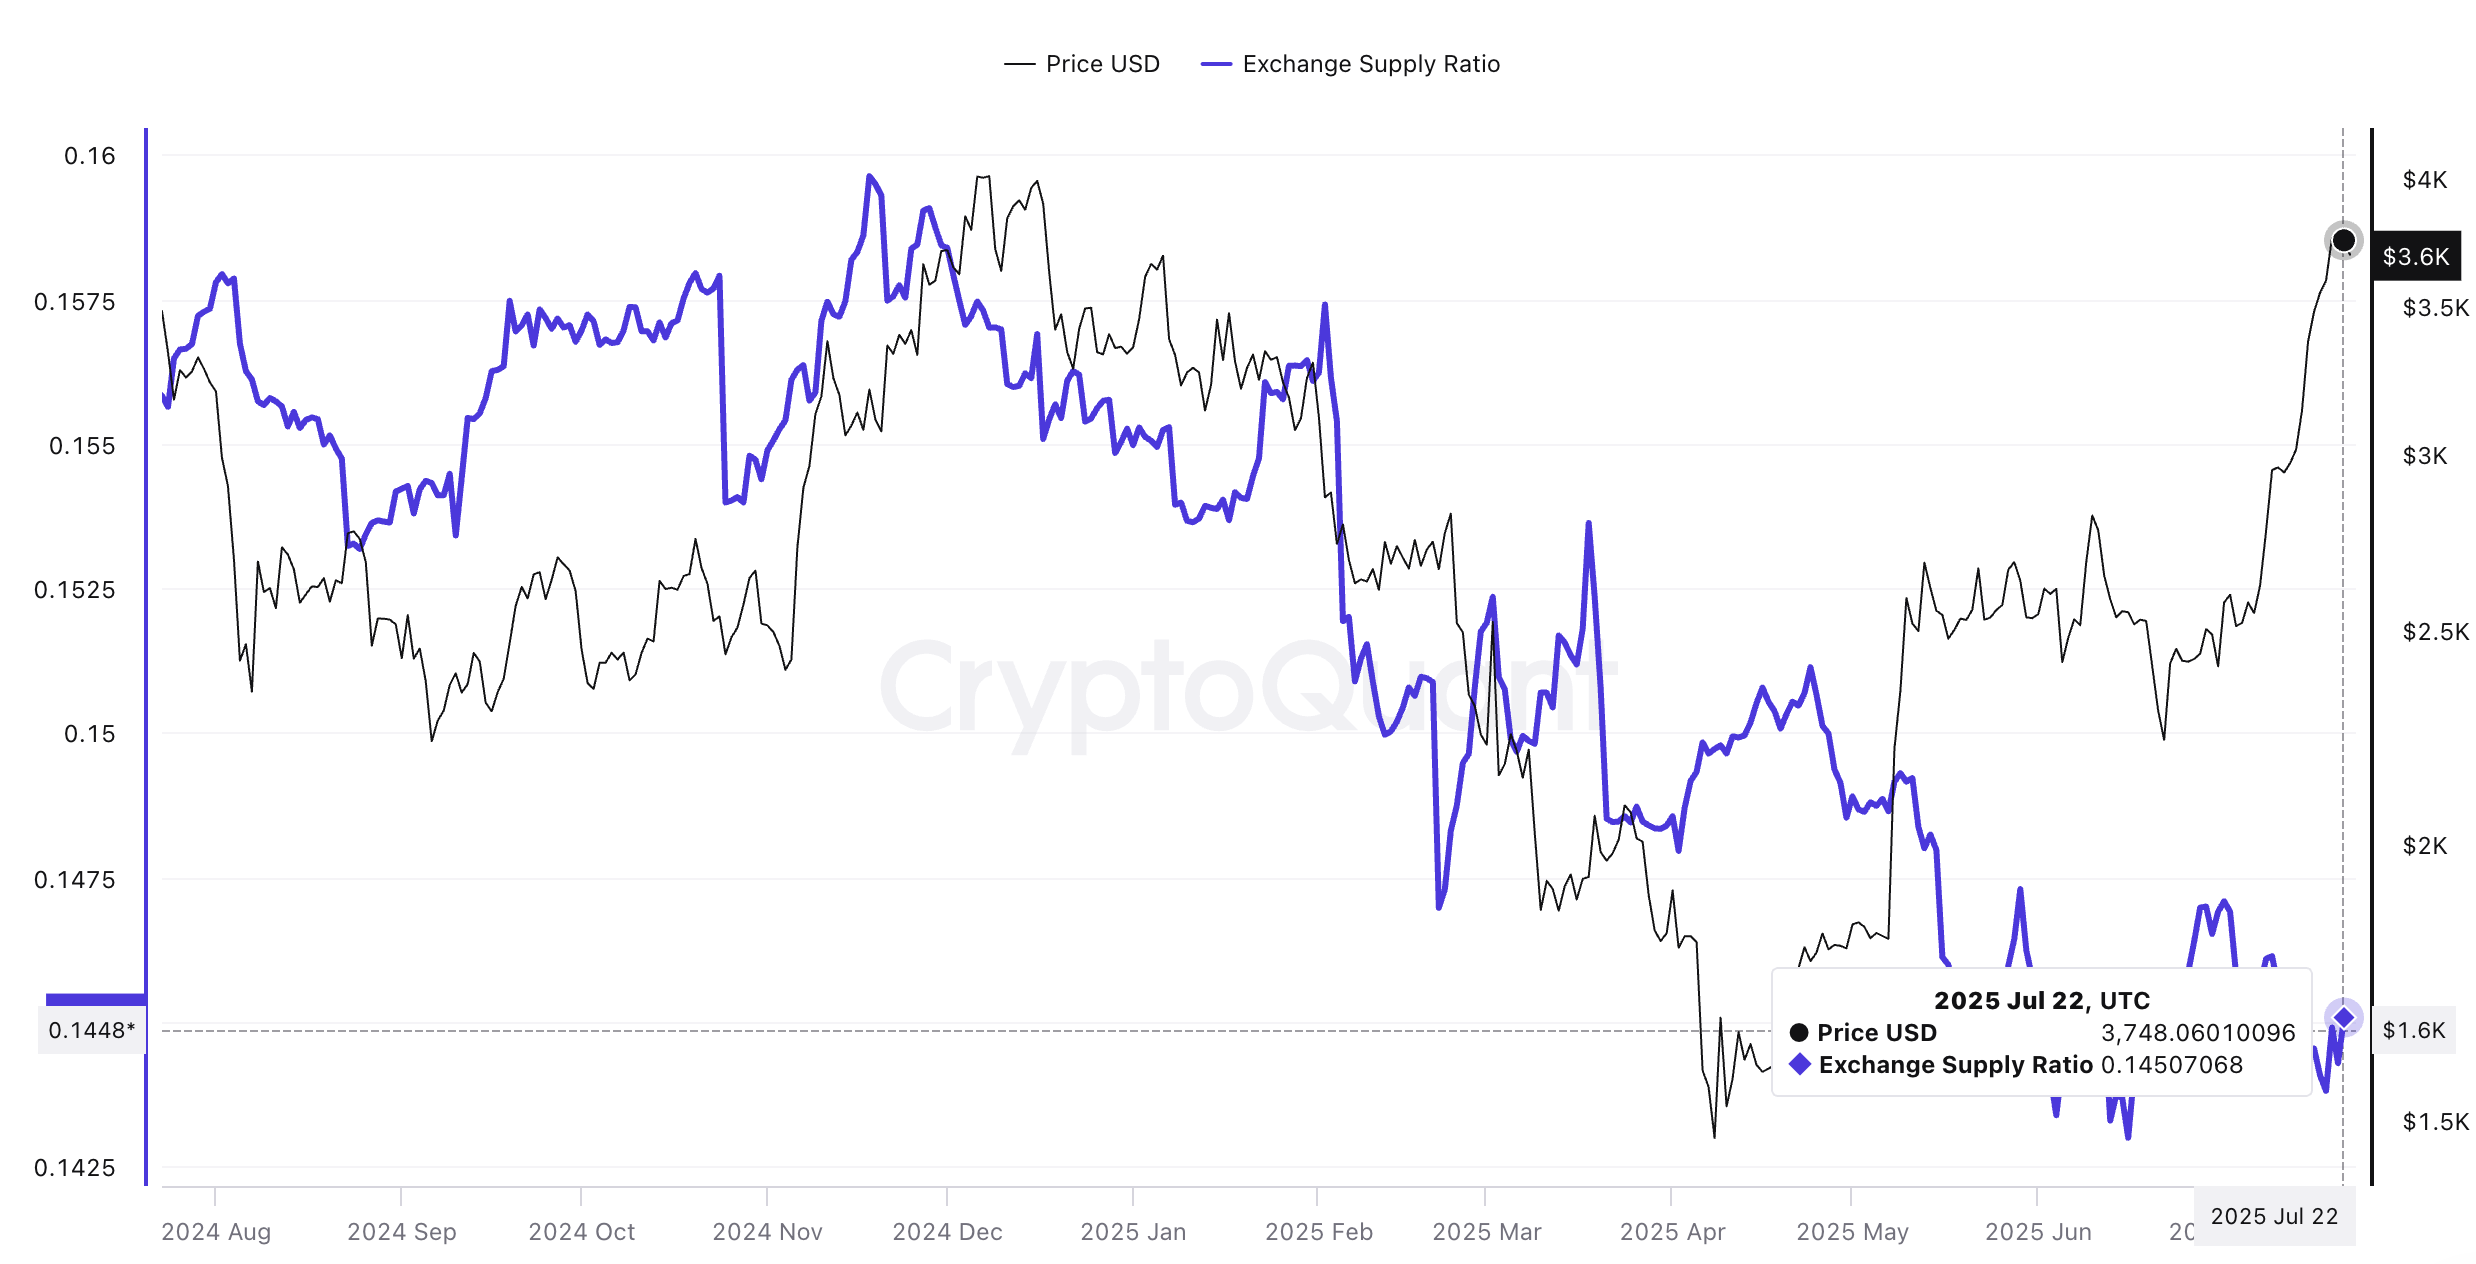
The Exchange Supply Ratio (ESR) is around 0.145, close to this year’s low of 0.142. A ratio is used instead of raw exchange balances because it measures exchange holdings against total circulating ETH, which changes with staking, burns, and unlocks.
For token TA and market updates: Want more token insights like this? Sign up for Editor Harsh Notariya’s Daily Crypto Newsletter here.
Ethereum price and exchange supply ratio: CryptoQuant
A low ESR means only a small chunk of supply sits on exchanges and is ready to sell. That is the setup right now.
According to the chart, local ESR highs often came before Ethereum price pullbacks. Therefore, low ESR levels exude confidence.
If ESR goes up while price slips, it usually means unstakers or large holders are moving coins to exchanges, and a dip can follow.
Funding and Open Interest
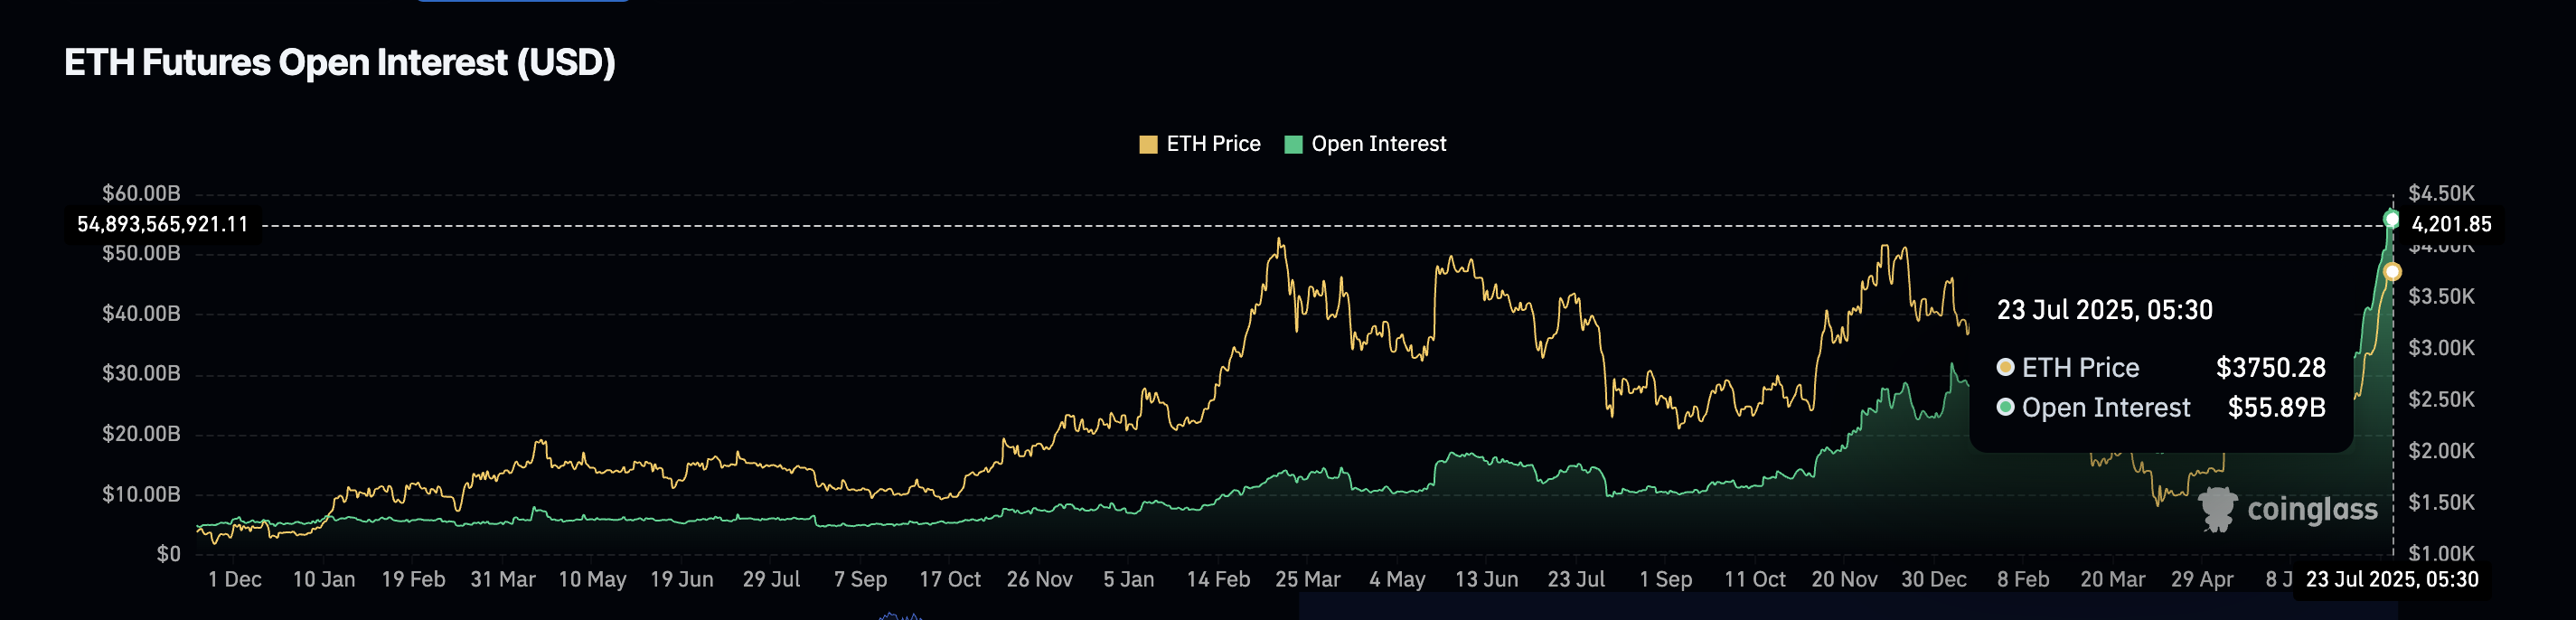
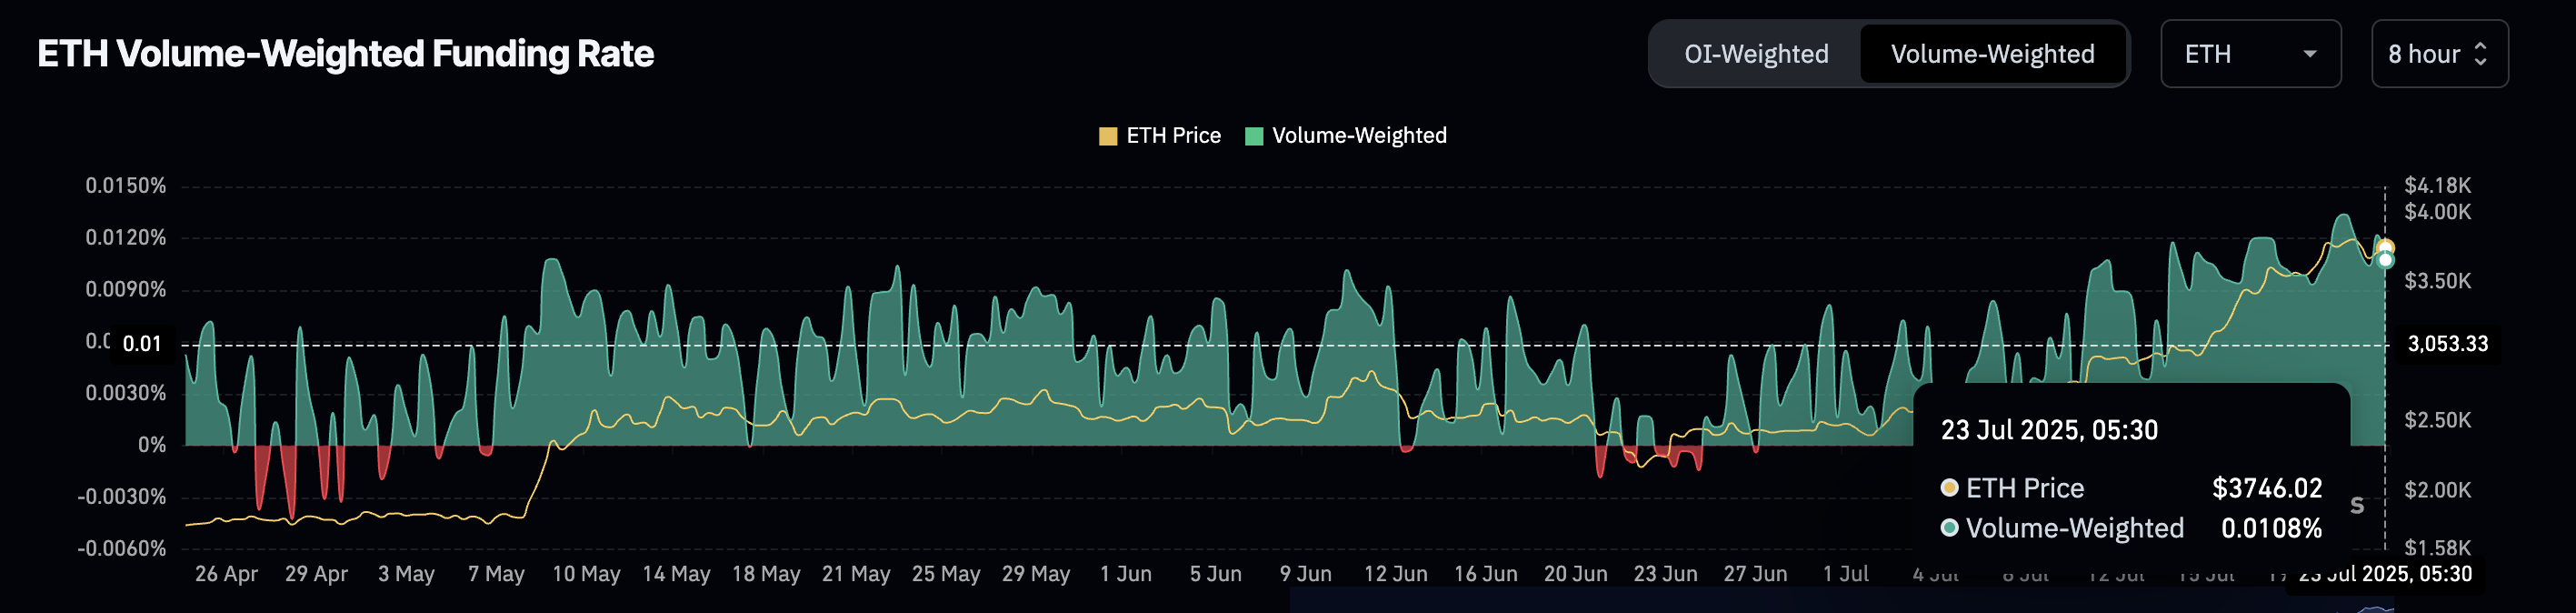
Open interest is about $55.9 billion, so a lot of futures positions are open. The funding rate is near 0.01%, still positive but lower than recent spikes (anything above 0.02% might be worrisome as that would mean high Long leverage).
The current market structure means that traders lean long (expect prices to go higher), yet they are not paying a heavy premium to stay there. That says leverage is present without being extreme. This is a healthy scenario, and the ETH price rally looks spot-driven.
Funding is the fee that longs and shorts pay each other to keep perpetual prices near spot. Open interest is the total value of all open contracts.
Ethereum (ETH) Price Needs To Beat Key Levels
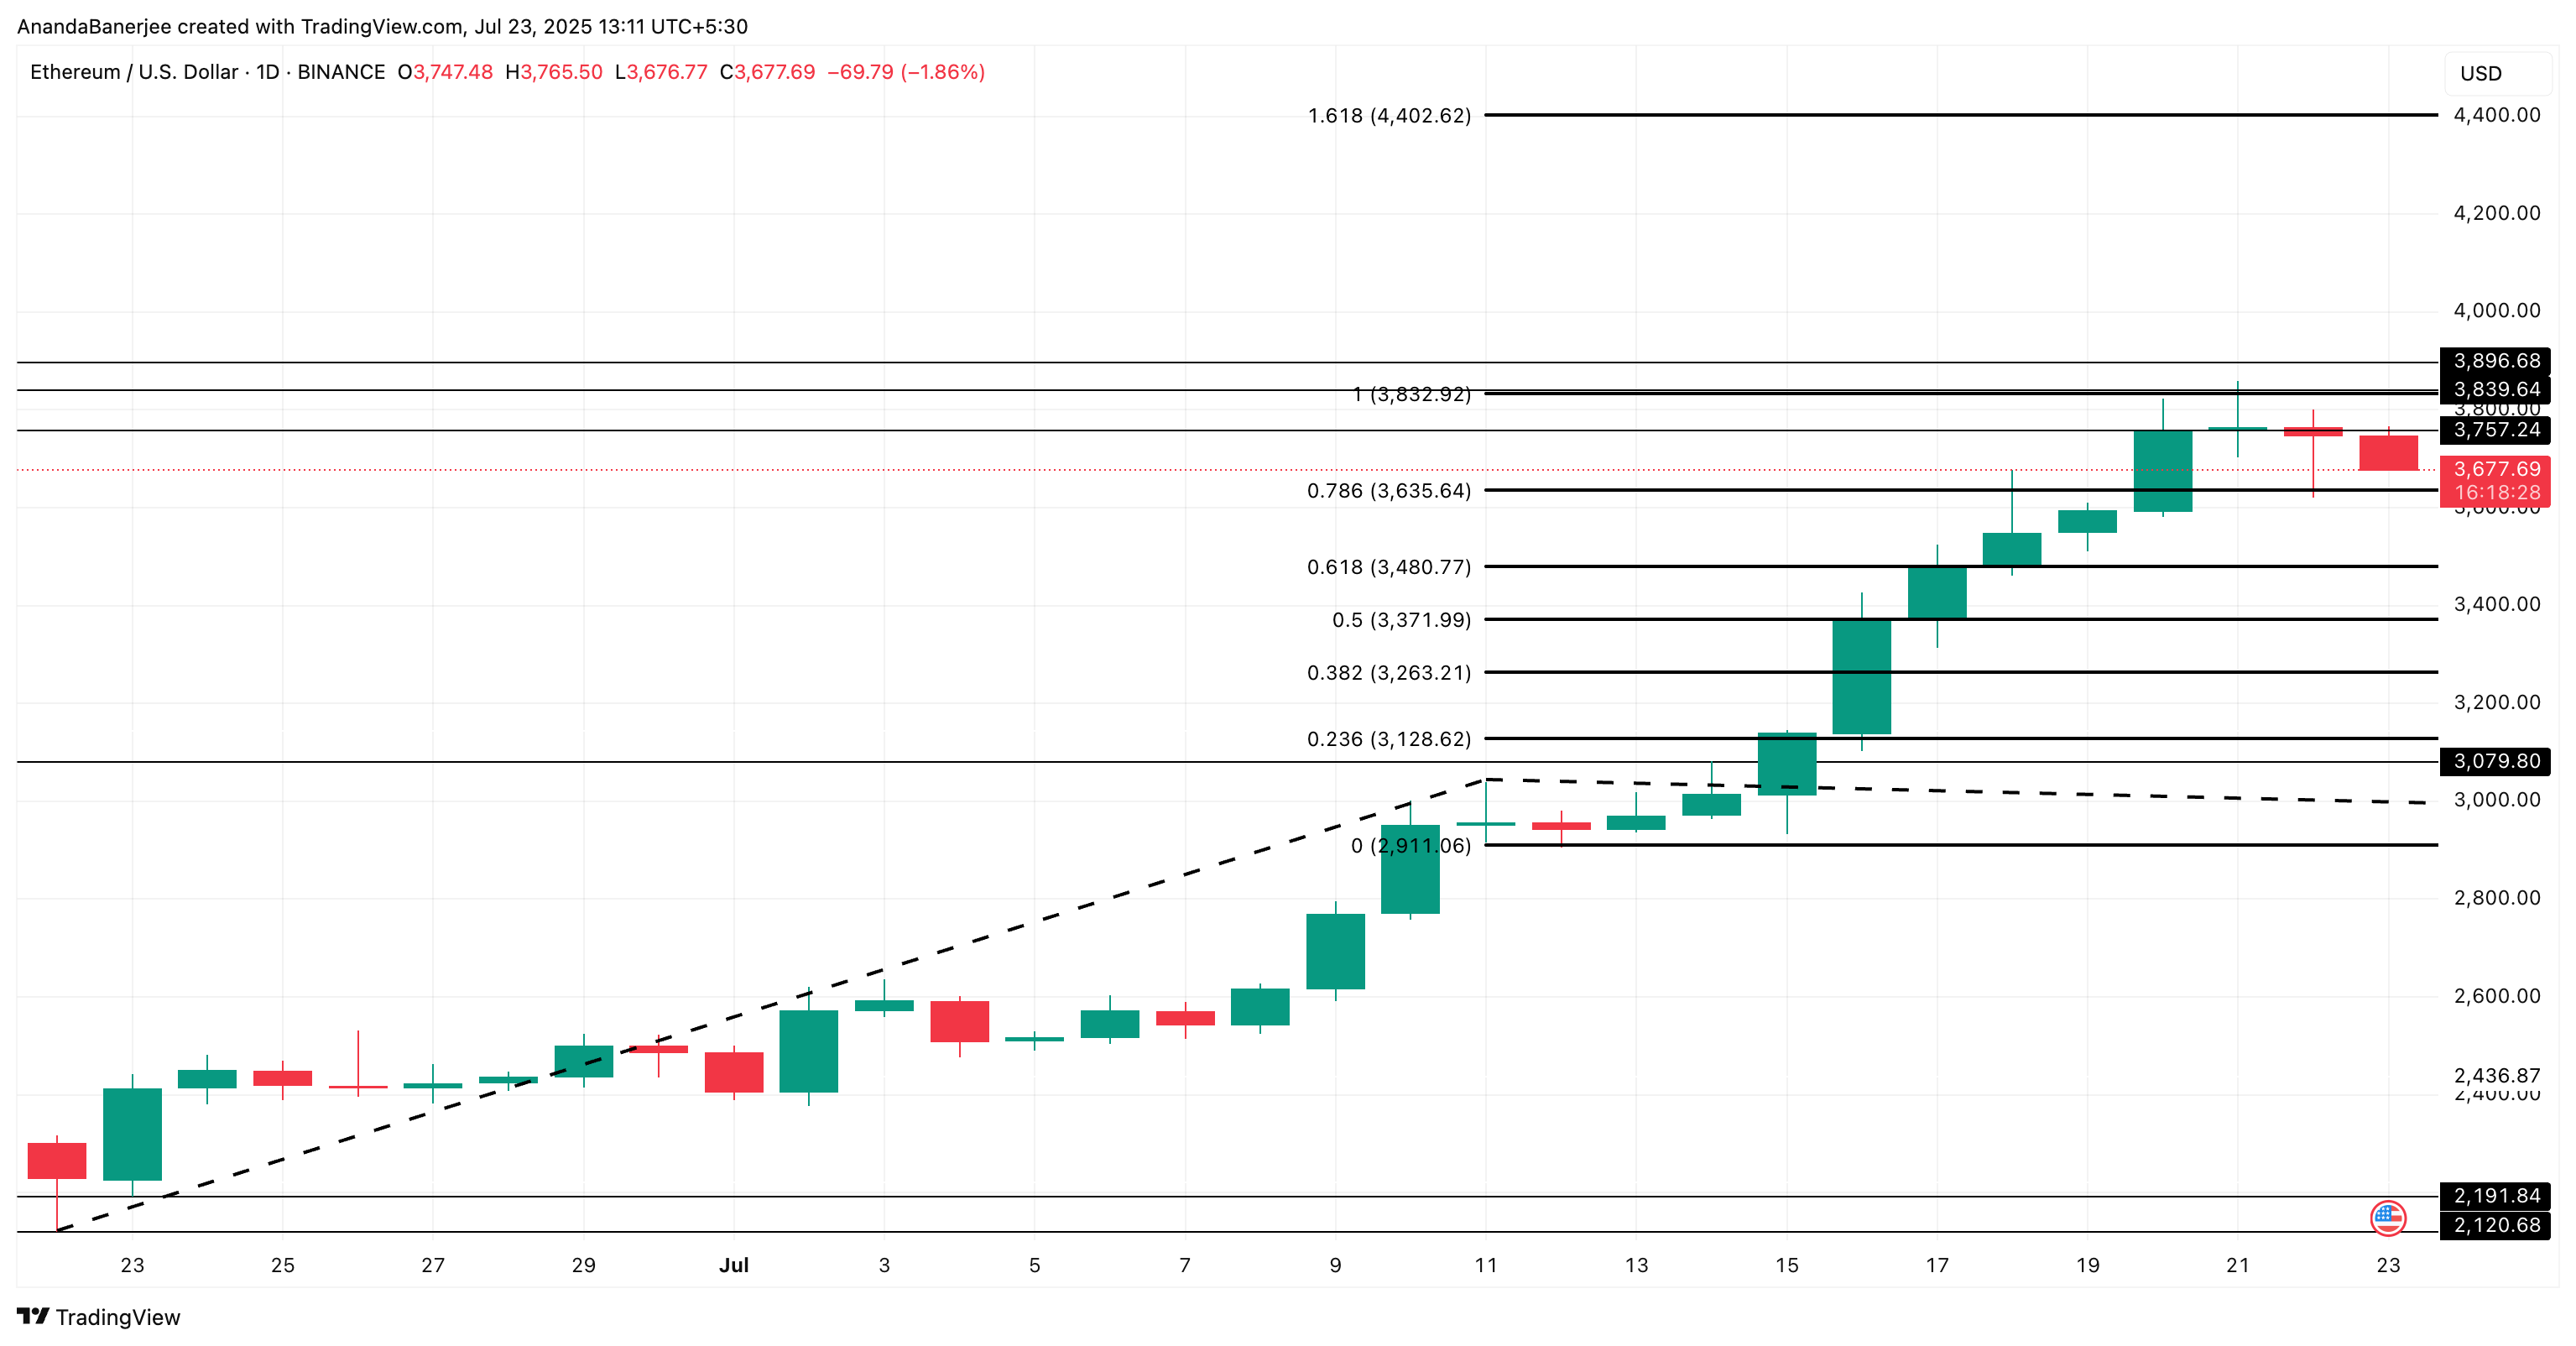
ETH is trading inside two key ranges of $3,832 and $3,635 (the 0.786 Fib level). As the upper level (resistance) would suggest, the real block sits just above the “$3,800 door.” Yet simply breaching the $3,832 resistance like earlier might not help.
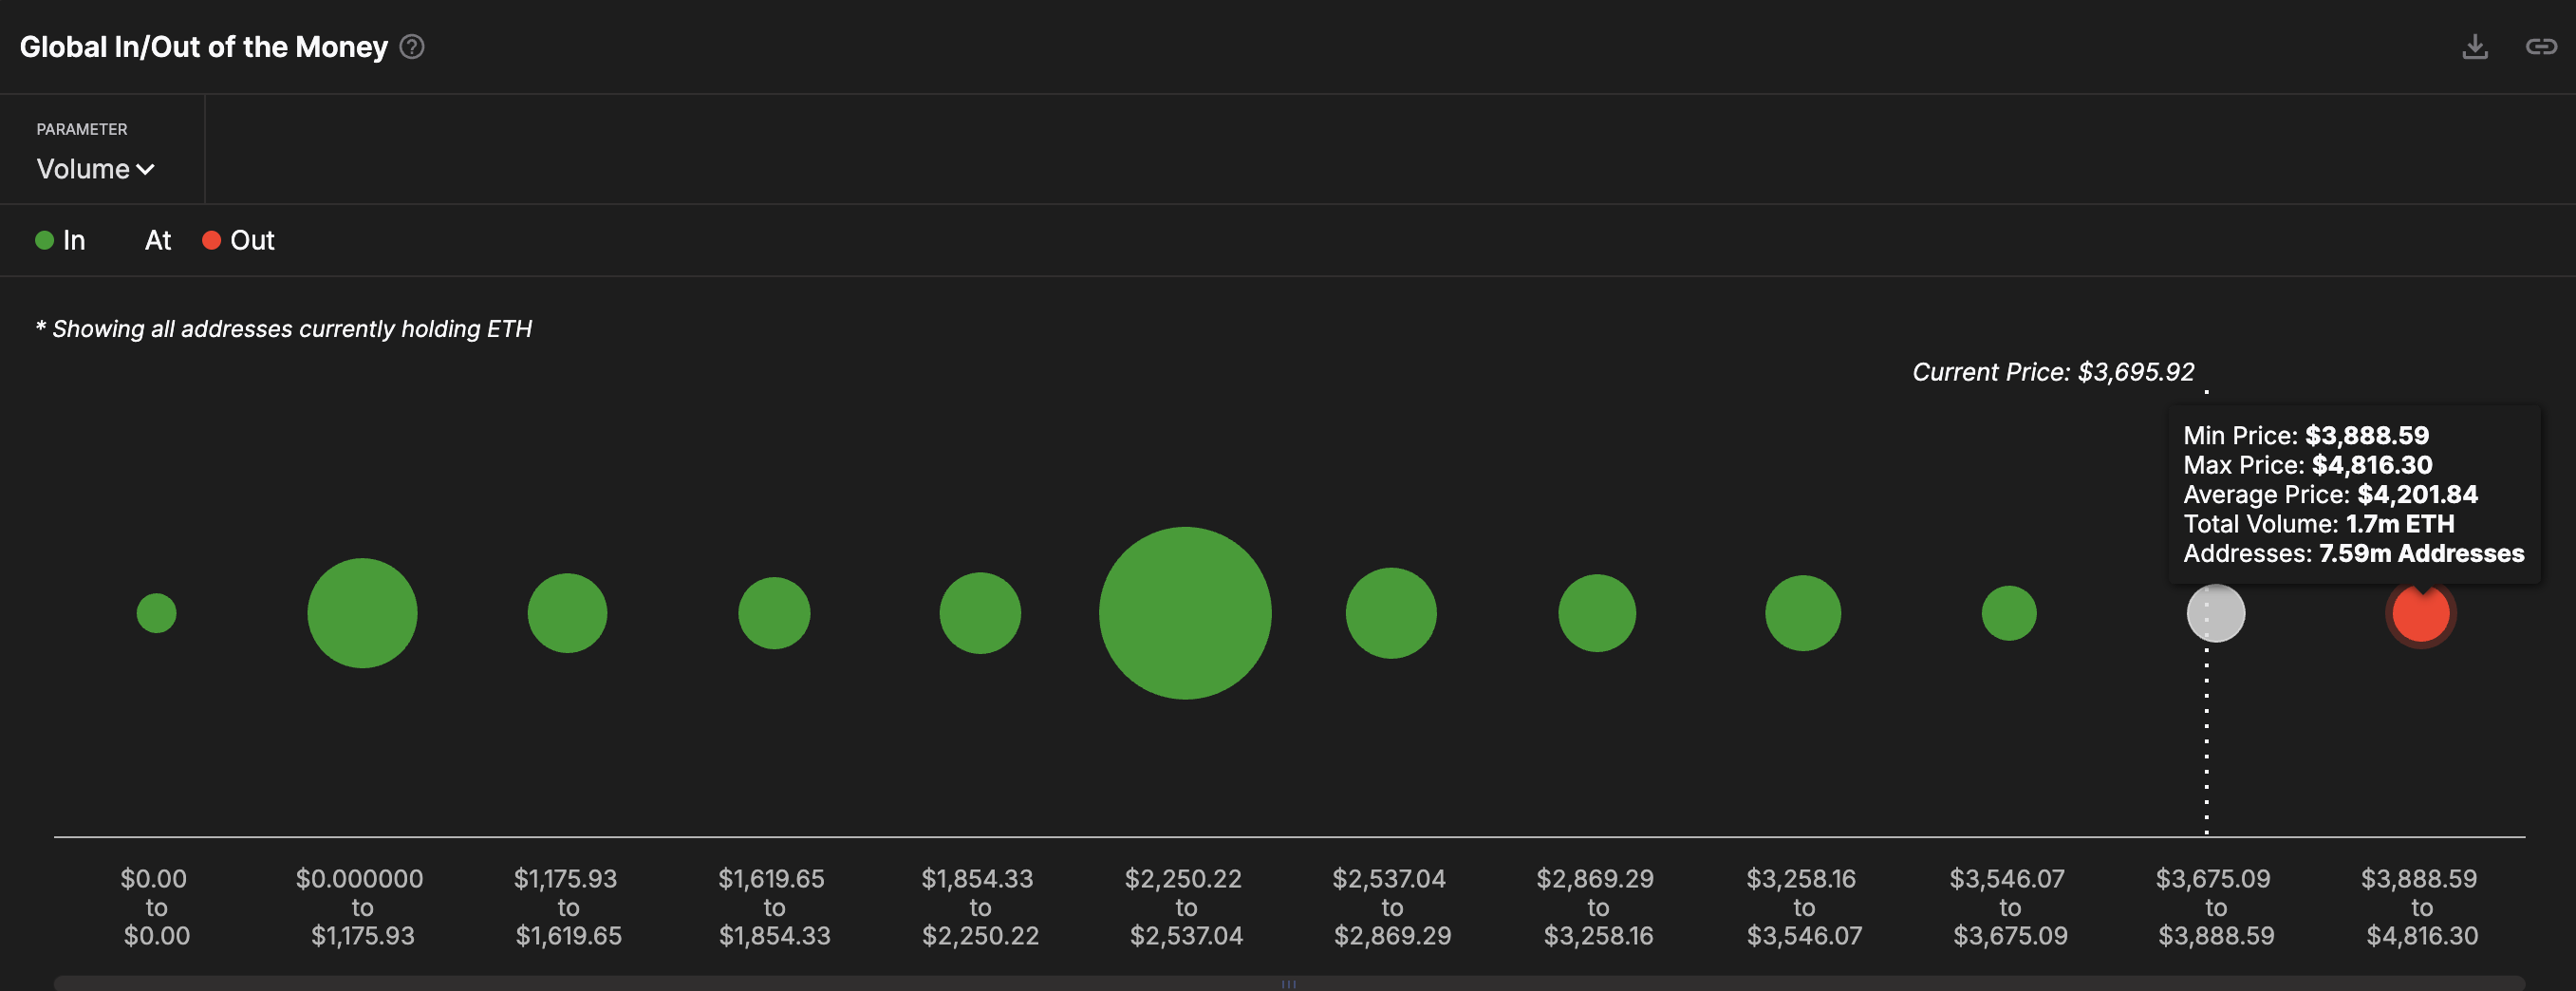
There is a holder cluster above $3,888, which also needs to be breached. That cluster likely explains why quick moves above $3,800 fade; many wallets are near break‑even there and sell into strength.
A daily close above $3,896 would open doors to $4,402 (the 1.618 extension). If ETH corrects again, $3,635 is first support, then $3,480. A drop under those levels, together with a rising ESR, would weaken the bullish setup fast.
Fibonacci levels flag common reaction zones. The in-and-out-of-money map shows where many wallets bought; those areas often act as real resistance or support, validating the Fib levels.
However, the entire short-term bullish hypothesis might get invalidated if the ETH price dips under $3,128 or the 0.238 Fib extension level.
Bitcoin price dropped sharply over the weekend, declining 7% to a 25-day low amid rising trade tensions and fading market liquidity.
Bitcoin trades $80,000 first time in 25-days as Trade Tensions worsen
Bitcoin price fell sharply over the weekend, declining 7% to hit a 25-day low of $79,000 on Sunday, April 6. This marks the first time BTC has traded below the $80,000 level in 25 days dating back March 11,
Bitcoin Price Action, April 6, 2025 | CoinMarketCap
After showing initial resilience last week, BTC has now surrendered gains made in late week
Amid escalating global trade tensions, bearish sentiment caught up with Bitcoin (BTC) markets over the weekend. TradingView data shows that BTC price traded as low as $78,964 according to CoinMarketCap, marking 7% losses from last week’s peak of $86,000 recorded when China’s reciprocal tariffs prompted investors to rotate capital into crypto markets on Thursday.
After China’s initially announced retaliatory 34% tariff on US imports, Bitcoin surged above $85,000 on Thursday, briefly lifting prominent altcoins like Ripple (XRP), Solana (SOL), and Ethereum (ETH) to gains exceeding 5% in 24 hours.
This spike hinted at a temporary decoupling of crypto from the broader U.S. stock market, as risk-averse investors rotated capital into cryptocurrencies to hedge against escalating trade tensions.
However, as U.S. markets closed on Friday, the momentum faded. Liquidity dried up across major exchanges, creating an opening for bearish traders to seize control.
Within 48 hours, Bitcoin shed more than 7%, triggering cascading losses across the crypto landscape. The sudden shift highlights how thin weekend trading volumes can leave markets vulnerable to aggressive short-side pressure.
Validating this stance, derivatives data at press time on April 6, shows that crypto traders have racked up considerable liquidation losses in the last 24 hours,
Crypto Market Liquidations, April 6 | Source: Coinglass
According to Coinglass data, over $597 million in leveraged positions were liquidated in the past 24 hours alone—affecting more than 205,000 traders. Bitcoin led the wipeout with $203.78 million in liquidations, followed by Ethereum at $164.72 million.
Notably, the majority of these losses—$514 million—came from long positions, suggesting that bullish traders were caught off guard by the sharp BTC price reversal.
Beyond that, the liquidation heatmap shows how altcoins such as Solana ($29.35M), XRP ($13.65M), and Dogecoin ($12.97M) were also heavily affected, as panic spilled over from Bitcoin’s price correction to 25-day lows.
This sweeping liquidation event has not only erased a large portion of the recent gains but has also shaken investor confidence ahead of the new trading week.
Bitcoin Price Forecast: BTC Eyes $76K as Bears Break Technical Support
Bitcoin price forecast remains tilted to the downside after BTC decisively broke below key support near $80,700, marked by the VWAP.
The daily candle posted a 6.33% drop, closing below the 50-day SMA ($84,068) and 200-day EMA ($82,828), both of which acted as prior support zones.
This signals a structural breakdown, with bearish momentum accelerating as weekend volatility triggered liquidations across $597 million in positions.
Bitcoin Price Forecast
Volume spiked to 26.04K on April 6, confirming strong sell-side conviction. Meanwhile, the MACD histogram has turned deeply negative, with the signal line sharply diverging from the MACD line—both indicating an intensifying bearish crossover. This pattern has historically preceded deeper retracements, especially when volume confirms directional bias, as it does here.
Despite this, bulls may argue that BTC remains in a long-term uptrend and sits just above March’s intraday low of $78,694.
A sustained defence of this zone could invite dip-buying, especially if macro sentiment improves post-Monday’s market open. However, should BTC fail to reclaim $80,700 swiftly, downside risk toward $76,000 and potentially $72,500 remains firmly in play.
Bitcoin price forecast now hinges on whether bulls can reclaim broken trend lines or risk deeper correction into lower liquidity zones.
Ethereum has seen a period of sideways movement over the last ten days, despite the broader cryptocurrency market experiencing significant price drops.
It has managed to hold steady, a sign of resilience, but ETH still hasn’t reached its absolute reversal point. This point is critical for triggering a broader price shift.
Ethereum Has A Long Way To Go
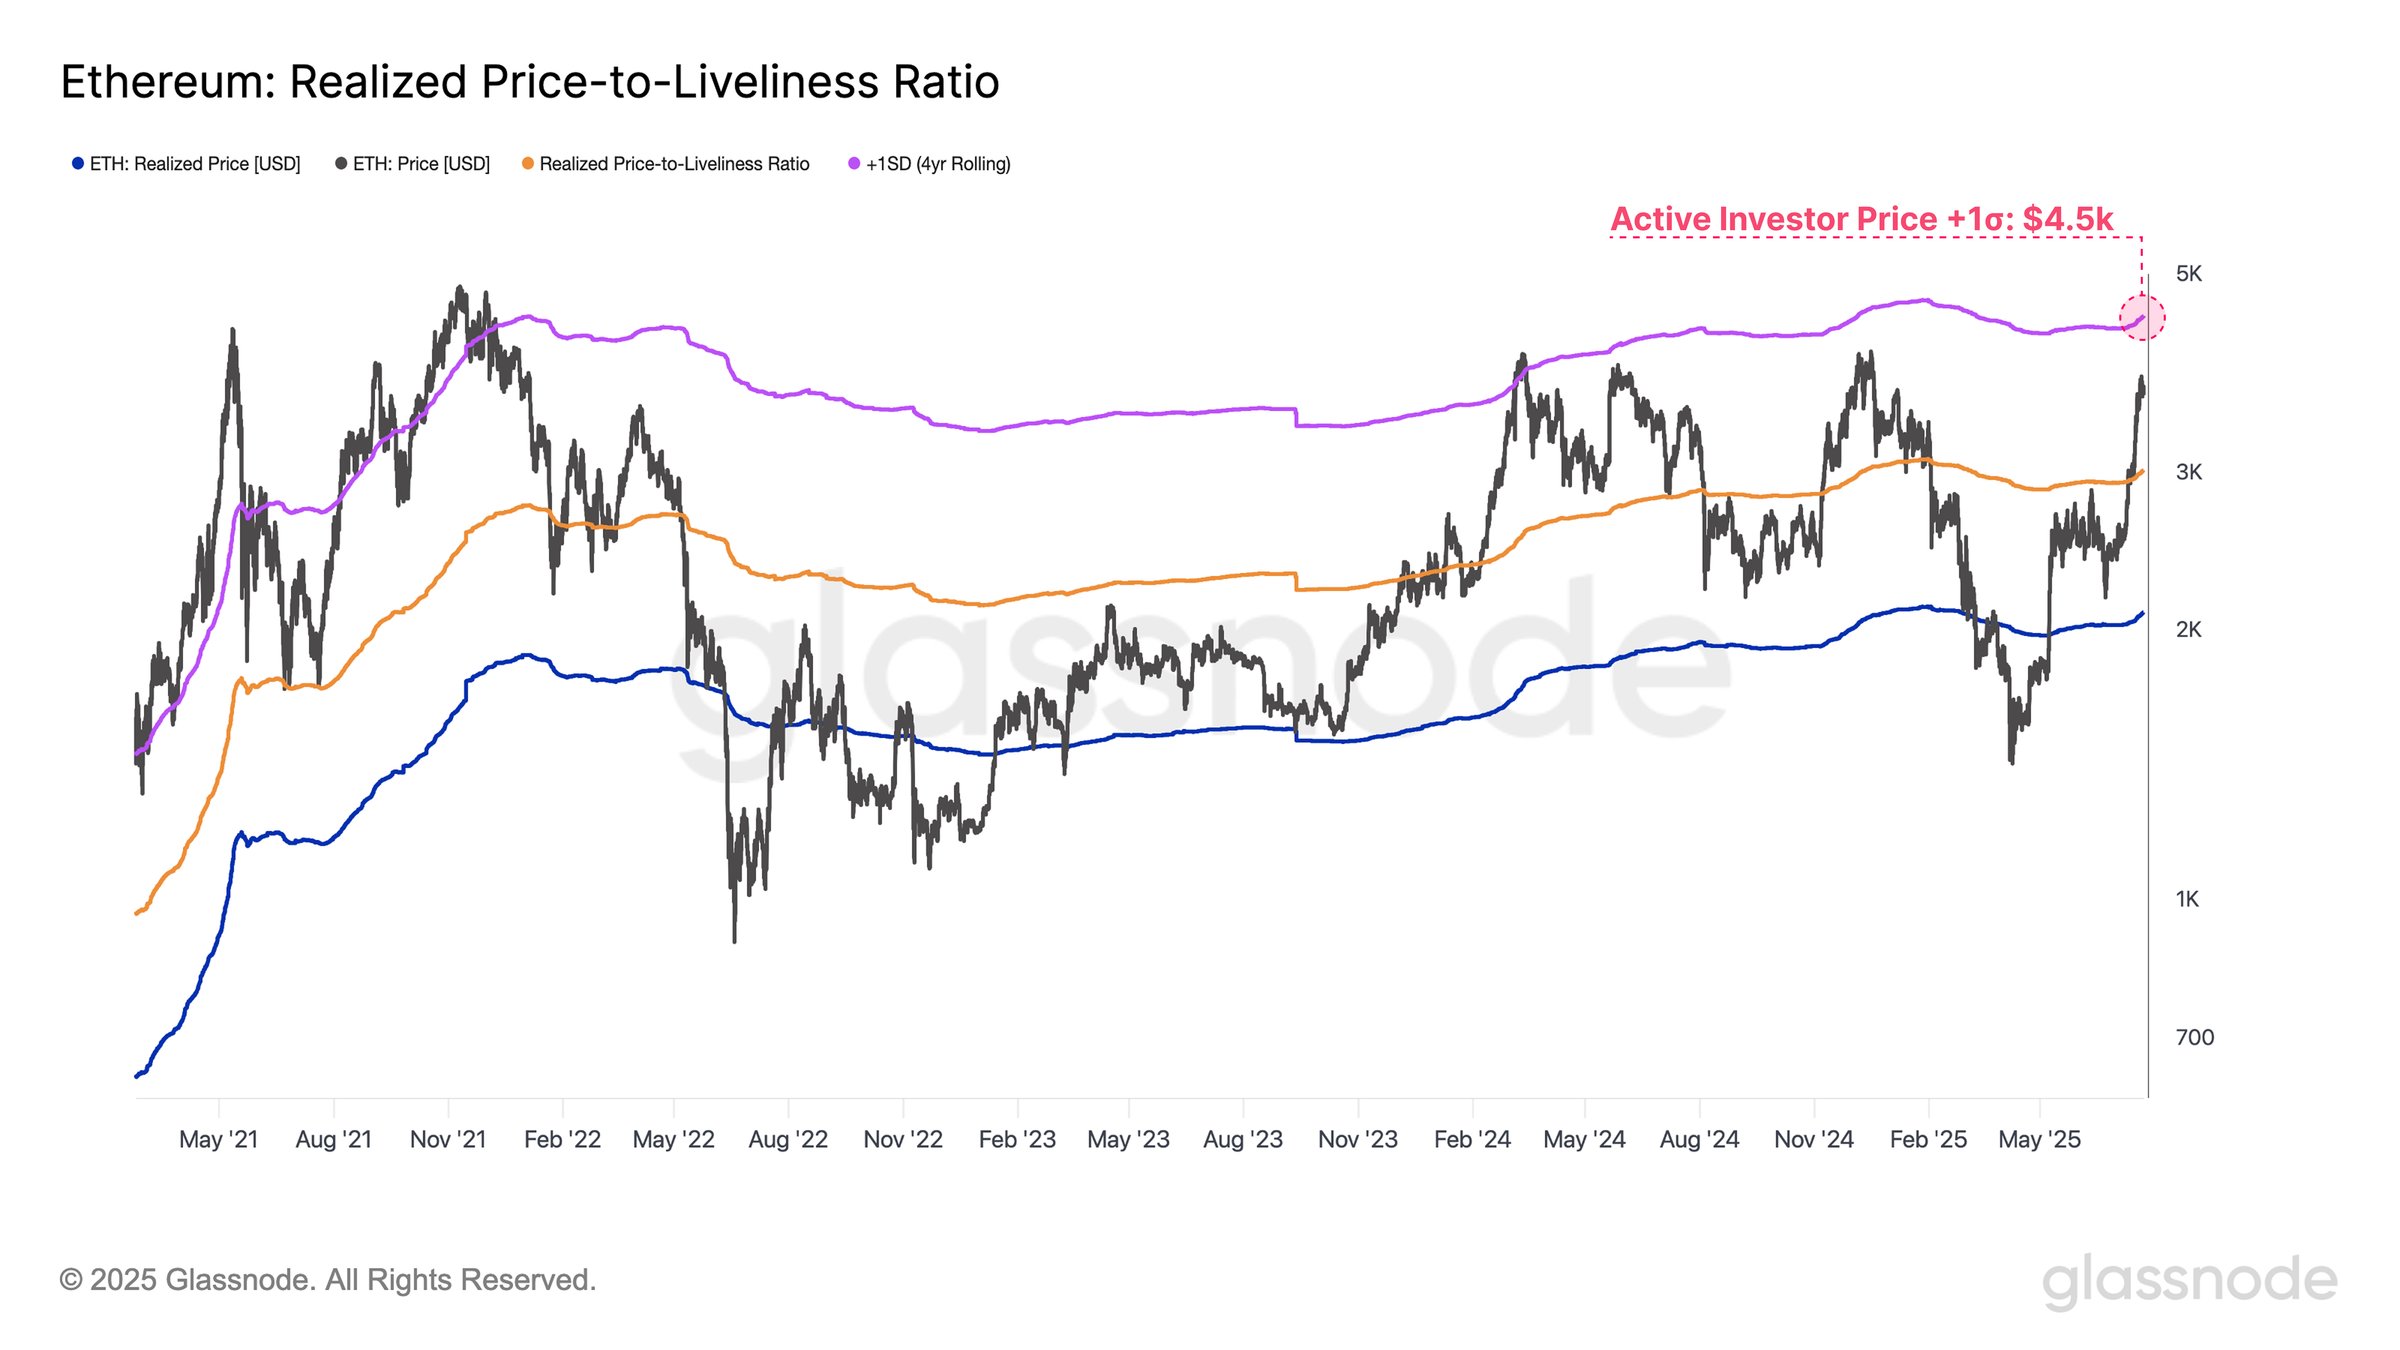
Ethereum’s Realized Price to Liveliness ratio is showing signs of an important threshold for the current rally. The ratio indicates that the current upside resistance for Ethereum is at $4,500, a level that has acted as a significant barrier in past market cycles. Notably, this price point acted as resistance in March 2024 and during the 2020–2021 market cycle.
Historically, breakouts above $4,500 signal market euphoria and an increased risk of structural instability, making it a critical structural pivot for Ethereum. As a result, this price level is not just a resistance but also the potential absolute reversal point for Ethereum.
Ethereum Realized Price to Liveliness. Source: Glassnode
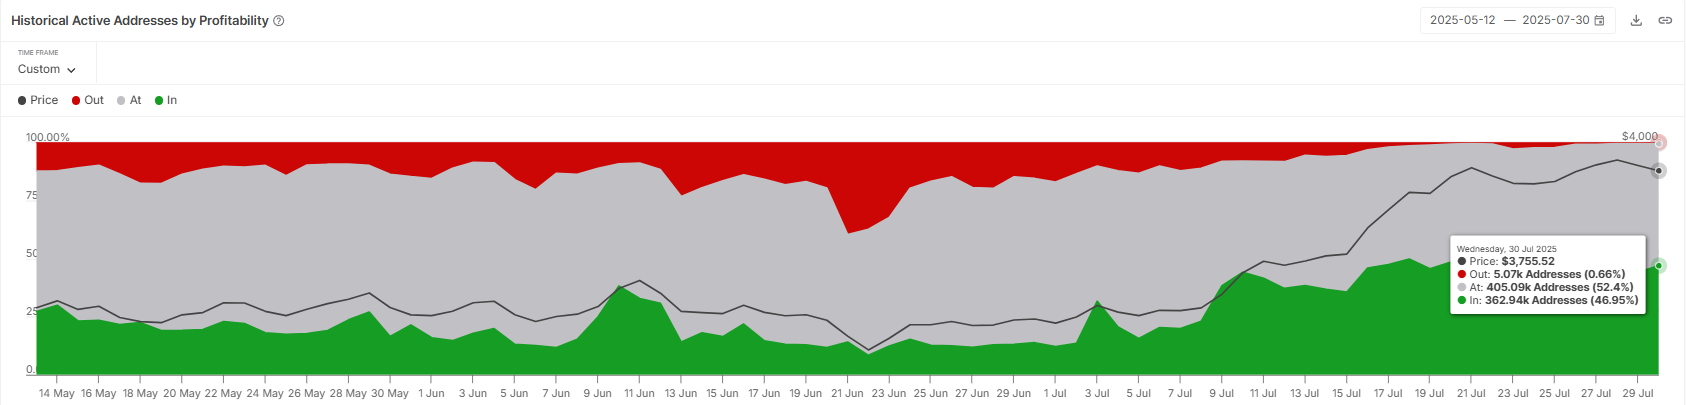
Ethereum’s macro momentum is influenced by the concentration of active addresses. Nearly 47% of these addresses belong to investors who are currently sitting in profit. While this may seem like a positive sign, it raises concerns in the short term.
Investors in profit are more likely to book their gains, which could lead to increased selling pressure on Ethereum. This could slow down Ethereum’s potential rise, preventing the altcoin from experiencing significant gains in the near future.
Ethereum Active Addresses By Profitability. Source: IntoTheBlock
ETH Price Is Holding Above Support
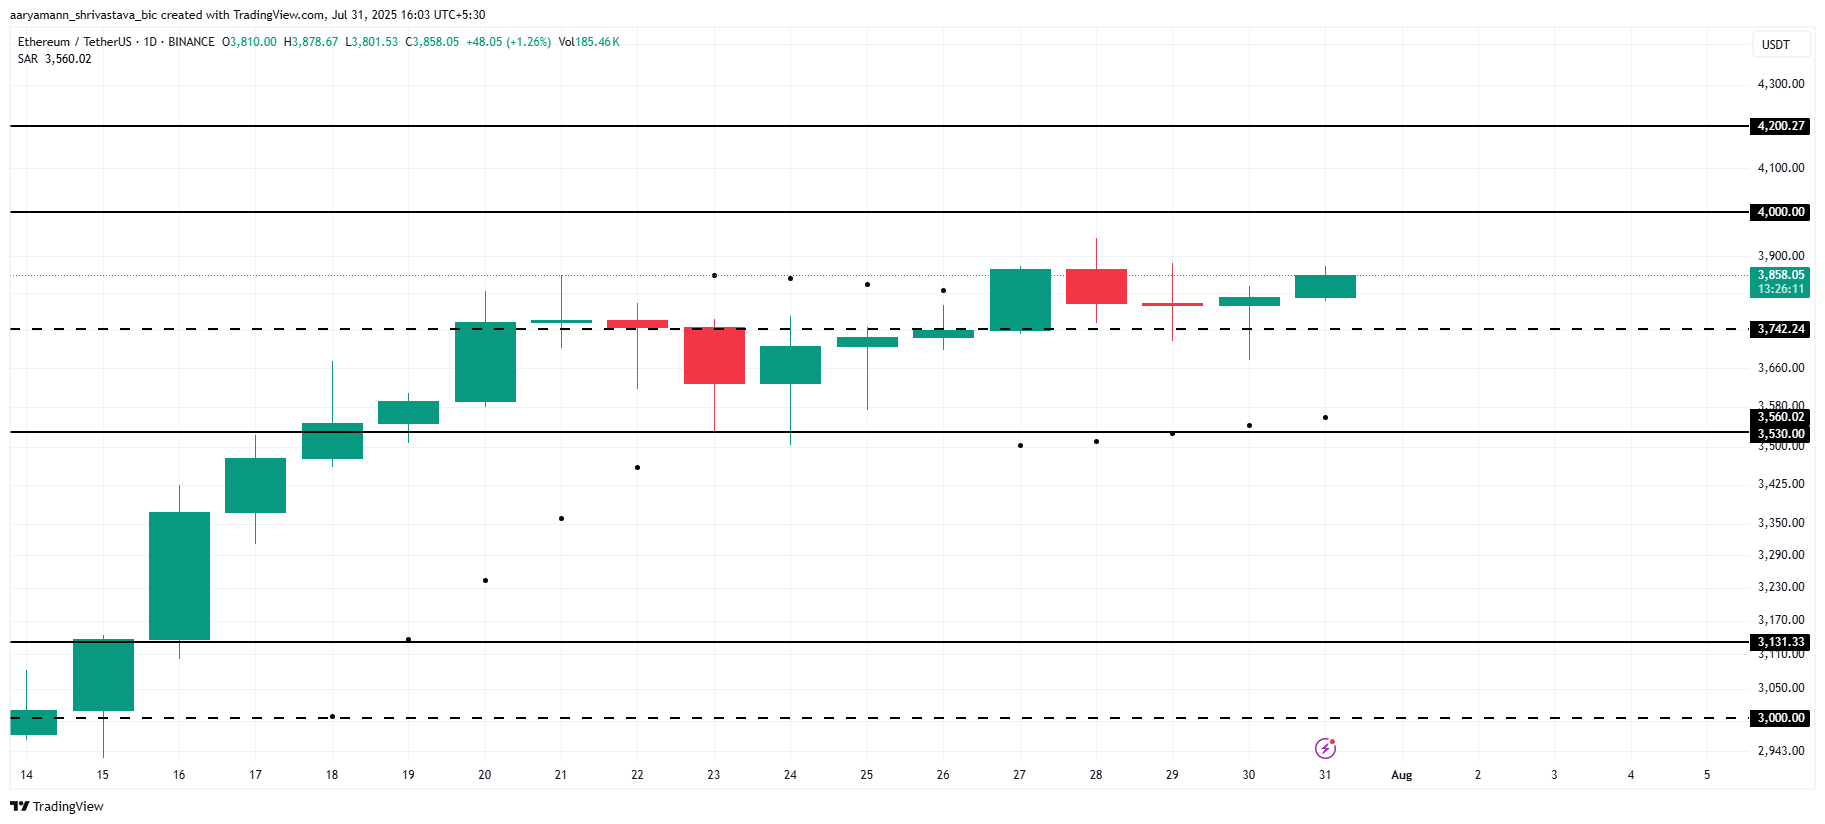
Ethereum is currently trading at $3,858, sitting comfortably above the local support level of $3,742. The Parabolic SAR indicator is positioned below the candlesticks, signaling an active uptrend.
This suggests that Ethereum is showing a moderately bullish trend at the moment, with the potential to rise further. Given the current market sentiment and price action, Ethereum could move towards the $4,000 level, with the potential to flip it into support and push higher to $4,200 in the near future.
However, there’s a caveat. Should Ethereum experience intensified selling pressure, driven by investor profit-taking or broader market conditions, the price could slip down to the $3,530 support level. If Ethereum falls below this crucial support, it would invalidate the bullish thesis and indicate a reversal in market sentiment.