US President Donald Trump has continued to pressure Fed Chair Jerome Powell and the committee to lower rates from the benchmark 4.25% to 4.5%. This time around, the president has gone as far as sending a handwritten note to Powell, which contained a breakdown of how other countries have lower rates, in a bid to
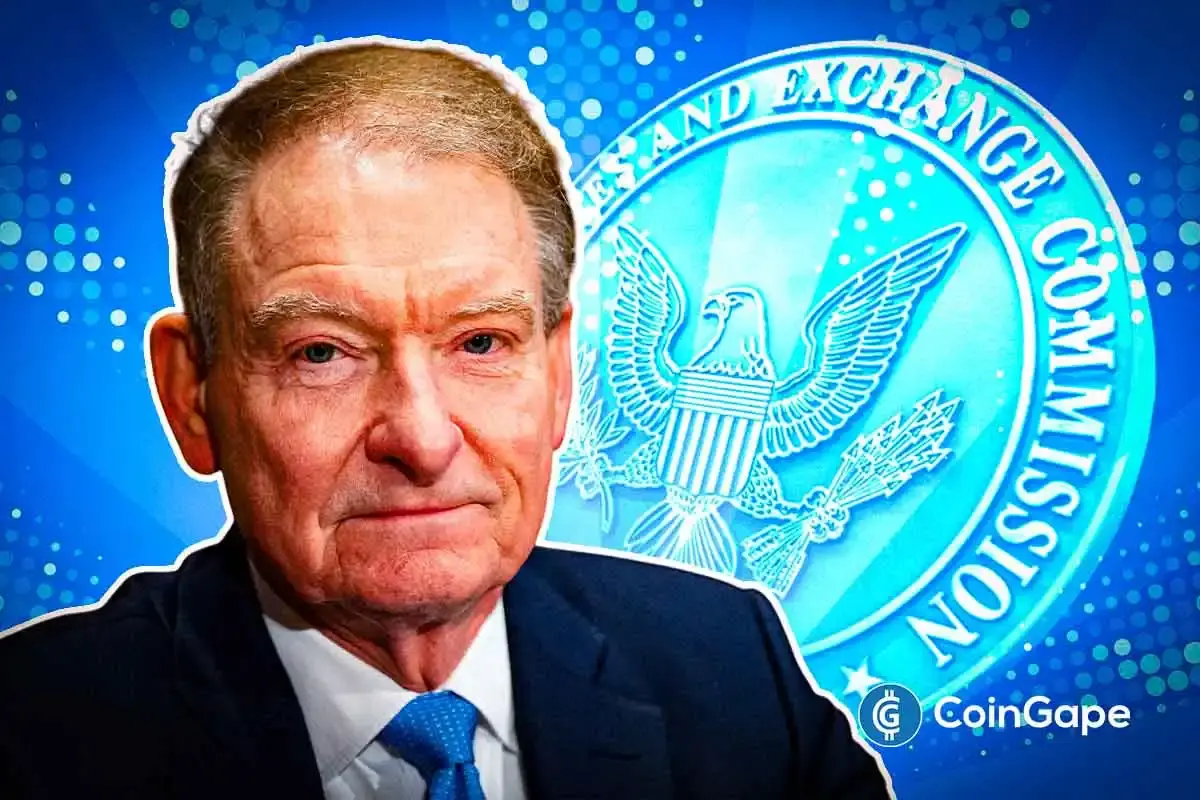
After much wait, Paul Atkins has finally been sworn in as the new US SEC Chairman and is believed to bring better regulatory and supportive decisions related to the cryptocurrency ecosystem. Although his responsibilities are not limited to this industry, the focus is definitely on it, aligning with Donald Trump’s vision to make America the crypto capital. Before that takes shape, let’s discuss the top five facts to know about the new SEC Chair.
5 Not-to-Miss Facts About Paul Atkins
Paul Atkins, a 67-year-old American businessman and father of two, is the 34th SEC Chairman after having sworn on April 22, 2025. The current U.S. President, Donald Trump, nominated him for the SEC Chairman role. And after the Senate’s approval, he is replacing the acting chairman, Mark Udeya, since Gary Gensler resigned.
Interestingly, he has worked with the SEC before, as the commissioner of the U.S. Securities and Exchange Commission from July 9, 2002, to August 2008, where he served with Christopher Cox, William H. Donaldson, and Chairman Harvey Pitt.
He is a pro-crypto supporter and has a history of working with various Fintech companies. His support for the industry was also made clear during the ceremony, as Atkins proclaimed Bitcoin and crypto as top priorities.
Interestingly, he began his career as a Lawyer after studying at Vanderbilt University School of Law in 1983. Here, he worked on a vast array of corporate transactions, public and private offerings, mergers, and much more.
His experience in government and the fintech industries is seen as a positive catalyst for introducing and maintaining regulations.
Paul Atkins News: What to Expect From The New SEC Chairman?
Even before joining the SEC, Paul Atkins has been quite vocal about his focus once he gains the position. Atkins has pledged to maintain a fair, orderly, and efficient market while ensuring investor protection.
As I return to the SEC, I am pleased to join with my fellow Commissioners and the agency’s dedicated professionals to advance its mission to facilitate capital formation; maintain fair, orderly, and efficient markets; and protect investors.
He is expected to strengthen and simulate the regulatory developments of the industry, beginning with joining the upcoming crypto roundtable meetings. More importantly, better conclusions on the Ripple vs SEC could come out due to his influence.
Additionally, more than 17 crypto ETFs are awaiting the SEC’s attention and potential approval that Atkins needs to address immediately. Overall, there are many legal battles and regulatory developments in process, which will be under his care now.
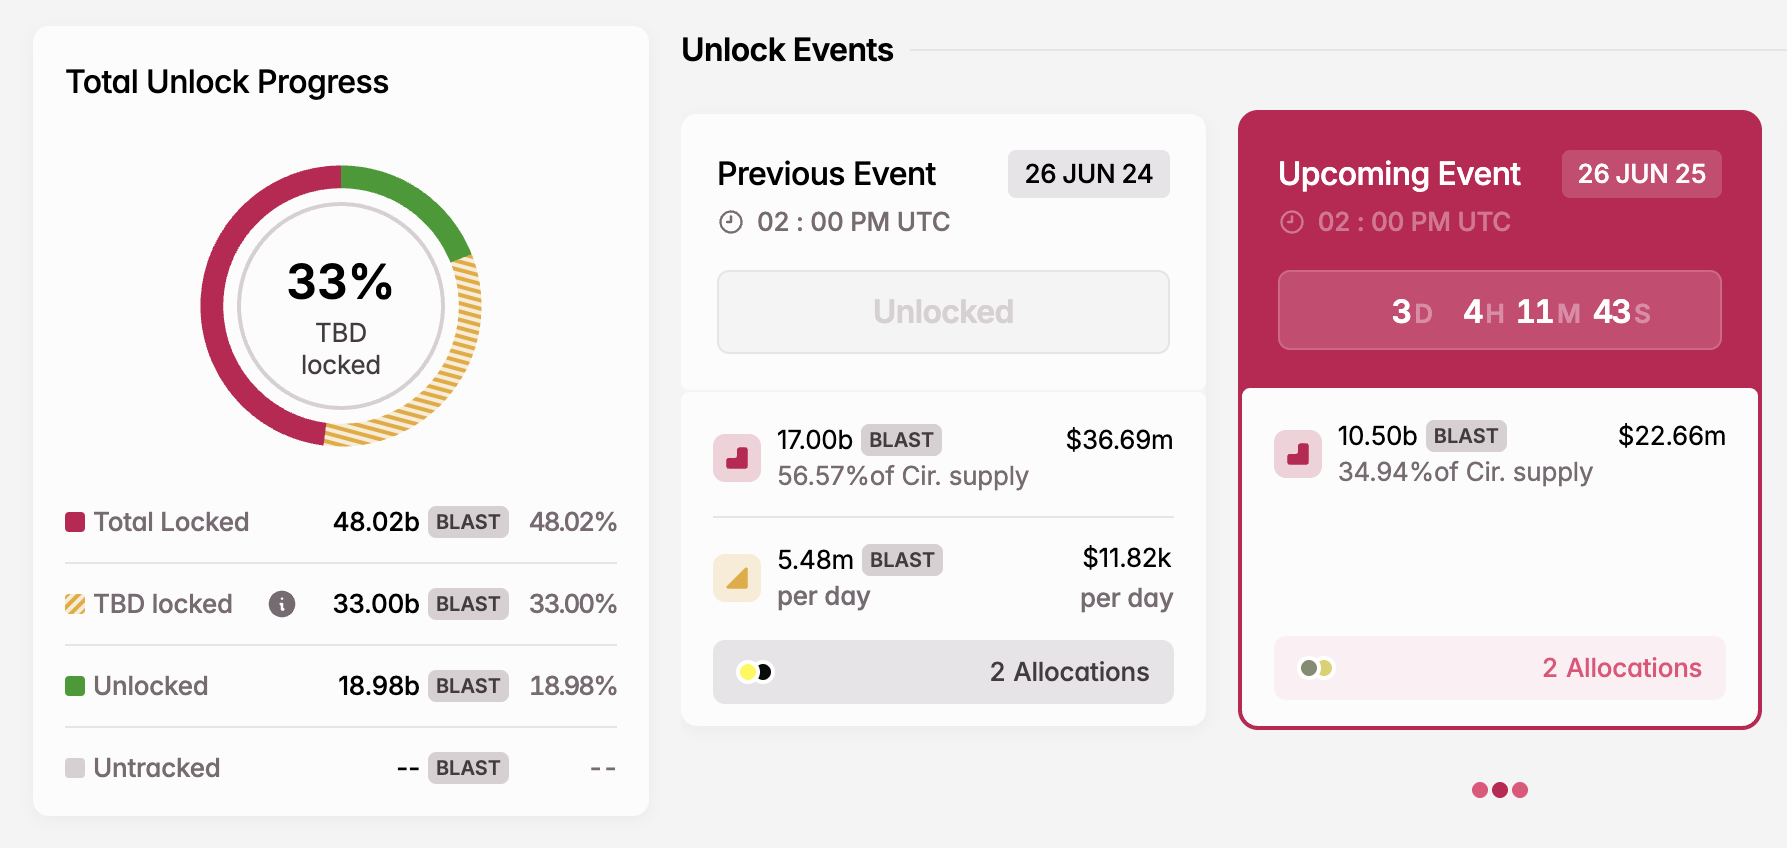
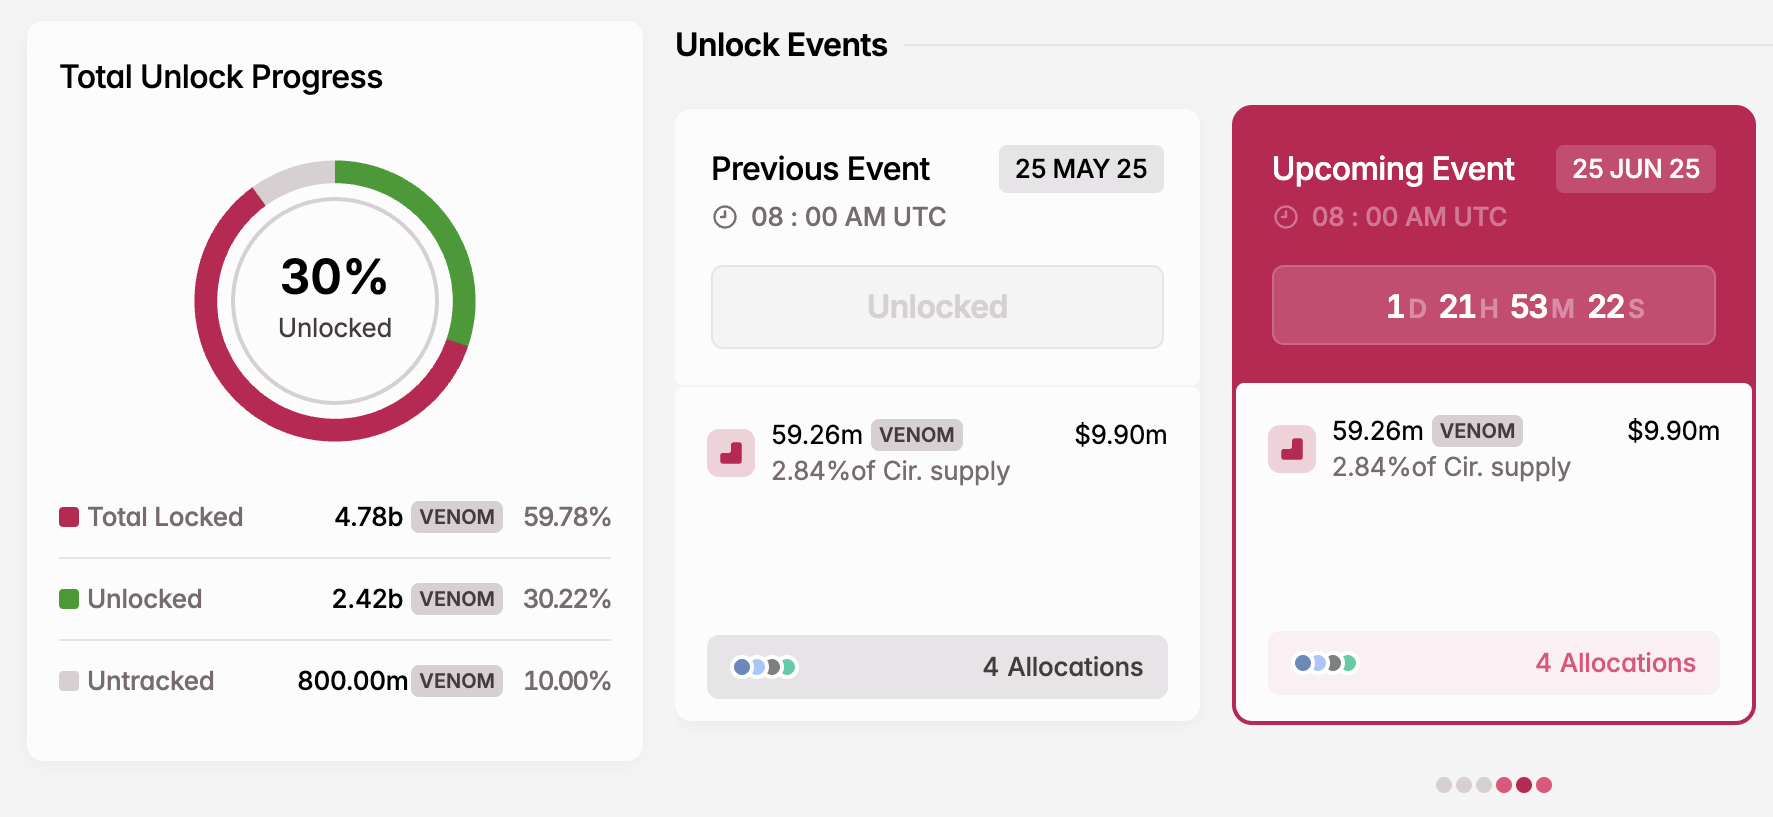
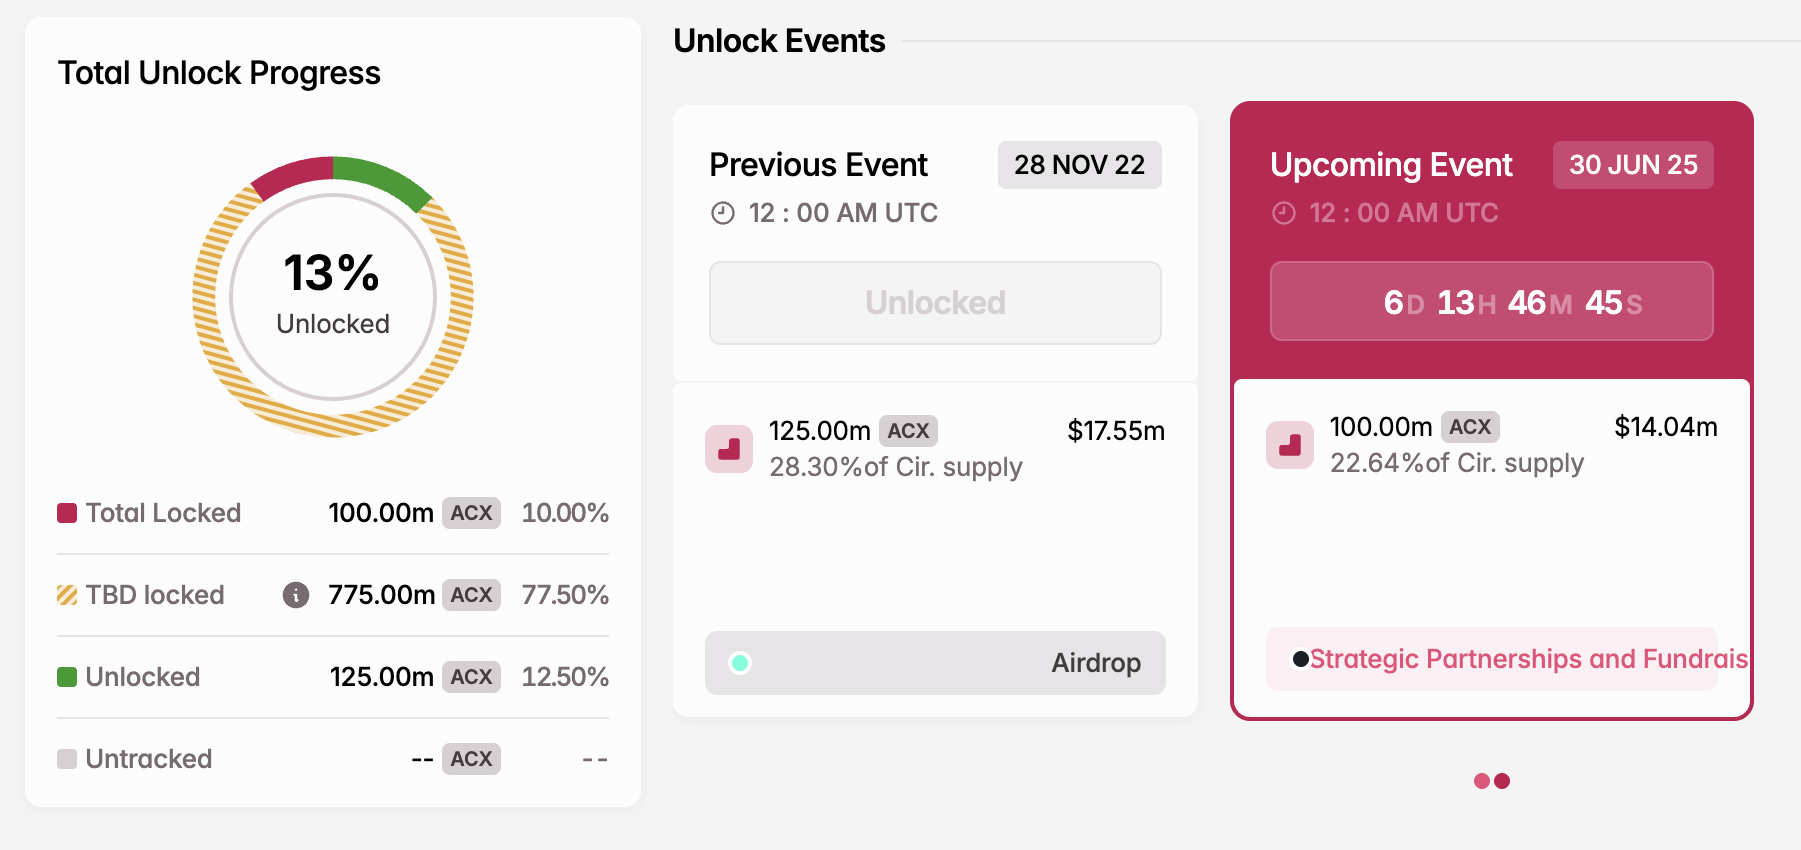
The final week of June will bring a wave of new tokens to the market. Overall, assets worth$84.64 million willbe unlocked. Three major projects, Blast (BLAST), Venom (VENOM), and Across Protocol (ACX), will release a large portion of previously locked tokens into circulation.
Token unlocks are known to fuel market volatility. Thus, the influx of new supply could lead to significant price fluctuations.
1. Blast (BLAST)
Unlock Date: June 26 Number of Tokens to be Unlocked: 10.5 billion BLAST (10.5% of Total Supply) Current Circulating Supply: 30 billion BLAST Total supply: 100 billion BLAST
On June 26, the network will unlock 10.5 billion tokens, valued at $22.6 million. This massive release represents 34.94% of BLAST’s current circulating supply.
The unlocked tokens will be distributed among core contributors and investors. Core contributors will receive 6.37 billion BLAST tokens, representing 21.2% of the market capitalization. Moreover, 4.13 billion tokens will go to investors, equivalent to 13.7% of the current market cap.
As the unlock nears, BLAST’s market performance has been underwhelming. Over the past week, its value has declined by 15.3%.
2. Venom (VENOM)
Unlock Date: June 25 Number of Tokens to be Unlocked: 59.26 million VENOM (0.74% of Total Supply) Current Circulating Supply: 2 billion VENOM Total supply: 8 billion VENOM
Venom is a blockchain built on the Threaded Virtual Machine (TVM). It aims to enable the development of Web3 applications and next-gen digital infrastructure.
Furthermore, the blockchain utilizes dynamic sharding and Mesh network technology for enhanced efficiency and scalability. On June 25, the project will release 59.26 million VENOM tokens worth $9.9 million.
The project will allocate the majority of the unlocked tokens (17.92 million) for ecosystem development. Early backers will receive 15 million tokens, while the community will get 15.8 million tokens. Additionally, the team will receive 10.5 million tokens.
Meanwhile, VENOM has been up 0.1% over the past week. However, the token unlock could test these small gains.
3. Across Protocol (ACX)
Unlock Date: June 30 Number of Tokens to be Unlocked: 100 million ACX (10% of Total Supply) Current Circulating Supply: 441.7 million ACX Total supply: 1 billion ACX
Across is an interoperability protocol that uses intents to offer fast, low-cost cross-chain transfers without security trade-offs. It aims to solve fragmentation in rollups and L2s through an intent-based architecture.
On the last day of this month, the network will release 100 million ACX tokens. Strategic Partnerships and Fundraising will receive the entire unlocked supply worth $14 million. The tokens represent 22.6% of the current market capitalization.
Meanwhile, the ACX token is down 19.4% over the past week, reflecting a bearish market sentiment surrounding it.
Other prominent token unlocks that investors can look out for this week include Soon (SOON), AltLayer (ALT), and Undeads Games (UDS). These unlocks could test market resilience, especially with shaky macro conditions. Potential short-term headwinds may emerge, particularly for tokens with high unlock percentages like BLAST and ACX.
As of March 7, the crypto market is in recovery following weeks of corrections. However, bearish momentum remains strong, keeping most cryptocurrencies near their support levels. The broader market saw significant liquidations as uncertainty persisted. With fears of prolonged declines, analysts warn of potential risks, making it crucial to identify an altcoin to sell before further downturns.
4 Altcoins to Sell Ahead of Trump’s March 7 Crypto Event
Two days to Donald Trump’s first Crypto Summit on March 7 2025, industry leaders, CEOs, and government officials prepare for key discussions.
Market analysts anticipate volatility, with potential price drops for certain altcoins, if regulatory policies or economic outlooks appear unfavorable during the event. Let’s uncover these four altcoins to offload, including TON, SOL, LEO, and TIA.
Toncoin (TON)
Toncoin (TON) struggles as market conditions weaken, facing strong resistance and limited support. The price hovers at $3.00, marking a 1.53% daily increase. However, a 15% weekly decline signals a bearish sentiment.
TON’s market cap has dropped significantly, slipping from the 11th to the 21st position. Traders consider it an altcoin to offload ahead of Trump’s Crypto Summit on March 7, fearing further declines.
BitMart has confirmed the listing of UNUS SED LEO (LEO), set to launch at 20:00 (ET) on March 5. The exchange will open trading for the LEO/USDT pair. LEO serves as the utility token for Bitfinex, the cryptocurrency exchange managed by iFinex.
A unique token burn mechanism ensures that iFinex repurchases LEO monthly. This strategy aims to reduce supply over time. At present, LEO is priced at $9.80, reflecting a 0.36% decline in the past 24 hours.
Solana (SOL)
Solana (SOL) price has been trading with strong volatility, making it an altcoin to sell ahead of Trump’s crypto summit on March 7. The price has dropped 52.08% from its $294 high, now hovering below $150.
An analyst noted that despite rejection, SOL defended the $125 support and is squeezing against the main downtrend resistance. This movement signals potential liquidation as uncertainty builds in the market.
Celestia (TIA)
Celestia (TIA) is trading at $3.30, reflecting a 15% decline over the past week. The token has been on a consistent downtrend in recent months, with its value significantly lower than its all-time high of $20.91 in February 2024.
This decline has placed TIA among the cryptocurrencies facing strong selling pressure. Ahead of the upcoming crypto summit on March 7, analysts highlight TIA as one of the altcoins to offload, citing concerns over potential long-term losses in a weakening market.
Conclusion
With market conditions still uncertain, traders should assess risks and monitor price movements. Selling weak assets before further losses can be a strategic move. Identifying an altcoin to sell before major events like Trump’s crypto summit may help mitigate potential long-term risks in this volatile market.