Most of the altcoins are trying hard to make a strong comeback after the latest pullback from their respective local highs. Meanwhile, the Dogecoin price continues to maintain a strong descending trend after the rejection from the local resistance zone close to $0.2. While Bitcoin & Ethereum prices are closely consolidating within a narrow range, aiming to trigger a rebound above the bearish range, DOGE price seems to be losing its grip over the rally. The token is about to erase the gains incurred in the past 30 days, which hints towards the resurgence of a fresh bearish trend.
This raises concerns about whether Dogecoin has a future. Will the cost of 1 Dogecoin reach $0.5 in 2025?
The DOGE price is maintaining a horizontal trade without displaying any strong possibility of a trend reversal. As a result, enough liquidity is accumulated on either side, which suggests the token has entered a decisive phase.
The DOGE price has triggered a rebound before reaching the liquidating zone around $0.164, where the liquidation leverage has surpassed $500 million. Therefore, to reclaim the higher levels, the price is required to liquidate the leverage within this range by plunging below the range. This could squeeze out all the shorts, enabling a significant rebound and a continued upswing. Still, the question remains: Will this help the DOGE price reach $0.2?
The short-term price action of DOGE suggests the price is experiencing tremendous upward pressure after failing to hold above the ascending trend line. The conversion line of the Ichimoku cloud is acting as a strong resistance, without displaying any chance of a bullish crossover. On the other hand, the Stochastic RSI faced a pullback after testing the average range, hinting at the growing dominance of the bears.
Therefore, the Dogecoin (DOGE) price is expected to test the local support at $0.162, which is below the liquidation level at $0.164. This move is expected to cause a short liquidation and trigger a strong upswing towards higher targets, probably at $0.18 initially and later at $0.2.
Welcome to the US Morning Crypto News Briefing—your essential rundown of the most important developments in crypto for the day ahead.
Grab a coffee to see what experts say about Bitcoin’s (BTC) price amid recovery efforts. The status of Bitcoin as a hedge against inflation and economic uncertainty is progressively becoming questionable, with institutional influence adding to the concerns.
Can Strategy’s $555 Million BTC Purchase Send Bitcoin Past $90,000?
Michael Saylor, the chairman of Strategy (formerly MicroStrategy), revealed the firm’s latest Bitcoin purchase, comprising 6,556 BTC tokens worth approximately $555.8 million. With this, the firm has attained a Bitcoin yield of 12.1% year-to-date (YTD) in 2025.
“MSTR has acquired 6,556 BTC for ~$555.8 million at ~$84,785 per bitcoin and has achieved BTC Yield of 12.1% YTD 2025. As of 4/20/2025, Strategy holds 538,200 BTC acquired for ~$36.47 billion at ~$67,766 per bitcoin,” Saylor shared.
Strategy uses the Bitcoin Yield YTD to measure the BTC holdings per share increase. This model has been a key part of their financial strategy firm since their first Bitcoin purchase in August 2020.
This acquisition aligns with a bullish market sentiment for Bitcoin, which is steadily nearing the $90,000 milestone, as the recent US Crypto News indicated.
Despite a mild recovery in Bitcoin prices this week, up by over 3% in the last 24 hours, it is worth noting that Bitcoin is highly sensitive to economic indicators.
Similarly, the global market is highly sensitive to monetary policies set by major economies, particularly the US. BeInCrypto contacted Paybis founder and CEO Innokenty Isers for insights on the current market outlook, particularly for Bitcoin.
“Given the strong concentration of investors in technology stocks, shifts in trade policies and government interventions that influence key indices like the Nasdaq Composite create ripple effects across financial markets,” Isers told BeInCrypto.
“With its relatively higher volatility, risk-averse investors may favor alternative inflation hedges instead of Bitcoin,” he added.
Iners expressed cognizance of the longer stretch of the trade war and the potential inflation that will emerge. Based on this, he noted that capital allocation to Bitcoin as a hedge against economic instability might be reduced.
Strategy’s Stock Premium Narrows as Bitcoin Hype Cools
Meanwhile, Strategy has seen a significant shift in its stock valuation dynamics over the past year. Saylor recently revealed that as of Q1 2025, over 13,000 institutions and 814,000 retail accounts held MSTR directly.
“An estimated 55 million beneficiaries have indirect exposure through ETFs, mutual funds, pensions, and insurance portfolios,” Saylor added.
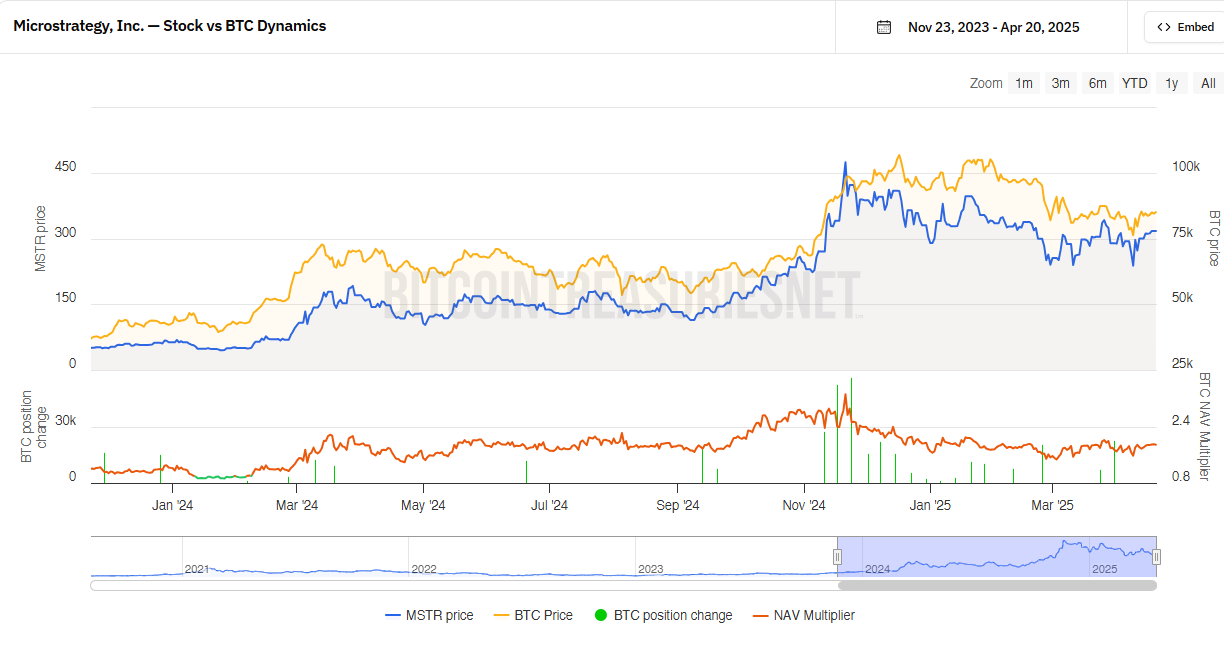
According to data on Bitcointreasuries.net, the premium investors once paid for exposure to its Bitcoin holdings has notably narrowed.
Specifically, the NAV multiplier, a measure of how much the stock trades above the value of Strategy’s Bitcoin assets, has decreased compared to last year. This indicates that MSTR is now trading closer to the actual value of its Bitcoin reserves.
In 2024, investors were willing to pay a substantial premium for MSTR shares, driven by Bitcoin’s hype and MicroStrategy’s aggressive accumulation strategy.
“I don’t know if buying strategy equity is a good idea for the government. The stock would just pump, and it’s likely trading at a premium over NAV with a higher risk profile. Also, I believe the gov will find it difficult to find institutions that would be willing to sell their BTC in large quantities,” an analyst said recently.
The shrinking NAV multiplier suggests a more cautious market sentiment. Analysts believe this reflects a shift toward valuing MicroStrategy based on its fundamentals rather than speculative Bitcoin enthusiasm.
This suggests a maturing market approach to the company’s unique investment strategy.
This chart shows how Strategy’s stock price (blue) moves with Bitcoin price (orange). When Bitcoin goes up, MicroStrategy usually follows, but it swings even more.
However, the NAV multiplier has narrowed compared to last year, meaning MicroStrategy’s stock is now trading closer to the actual value of its Bitcoin holdings.
Last year, investors paid a bigger premium for exposure to MSTR, but that gap has shrunk. This suggests a more cautious sentiment or a shift toward valuing the company based on fundamentals rather than just Bitcoin hype.
Accumulation signals from whale activity and consolidation at $0.60 indicate a possible rally for Pi Network, despite concerns about the lack of exchange listings and use cases.
Galaxy Digital has recently moved 12,500 ETH to Binance, which marks its second-largest transfer in the last three days. A similar deposit of 12,500 ETH was made on April 12. The firm has sent a total of 25,000 ETH worth over $40 million in the last three days.
Galaxy Digital moved the tokens in two separate transactions. First, 2,500 ETH worth $4.05 million, followed by 10,000 ETH valued at $16.32 million, both sent to Binance.
Galaxy Digital deposited another 12,500 $ETH($20.36M) to #Binance 5 hours ago.
On April 12th, 4,500 ETH worth $7.11 million and 8,000 ETH worth $12.63 million were sent to Binance in two separate transactions. Ether’s price dropped from $1,677 on April 14 to $1,641 after the latest deposit. This dip in price highlights how large institutional transfers could affect market prices.
Galaxy Digital Moves Millions in Crypto; Holds 8 million in stablecoins
Besides, Galaxy Digital also moved 5 million USDT to Binance, along with 100,000 USDC and $1,000 work of AVAX. According to data from Arkham Intelligence, the firm now holds about 200 ETH worth $328,000 and 18,150 AVAX worth $363K after the recent transfers. The firm still holds $7.97 million in stablecoins: 4.2 million in DAI and 3.75 Million in USDC.
Yesterday, lookonchain reported Ether whale movements as a mysterious whale purchased 4,208 ETH worth $6.87 million from OKX using 4 different wallets. Besides, the whale also borrowed 4.85 million USDT from Aave and deposited into OKX, likely to buy more Ethereum.
In a latest update from Lookonchain, a new wallet recently withdrew 3,000 ETH ($4.92M) from Kraken, then moved it to Aave and Compound. The wallet borrowed 3M USDC and deposited it back into Kraken, likely to purchase more ETH.
A newly created wallet withdrew 3,000 $ETH($4.92M) from #Kraken 5 hours ago and deposited it into #Aave and #Compound.
The crypto movements come after a $200 million settlement in the LUNA market manipulation case. Notably, the New York Attorney General had accused the firm of selling its LUNA holdings without proper disclosure.
In 2020, Galaxy Digital promoted LUNA and secured a deal to buy it at a discount. When the price of LUNA rose, the firm sold its holdings for huge profits but the transactions were not disclosed properly.
On April 15, the Ethereum spot ETF experienced a net outflow of about $6 million. Fidelity’s FETH led the outflow with $7.8 million, while 21Shares’ CETH saw a net inflow of $1.8 million as per data from Sosovalue.
Notably, Ether has struggled to keep up this market cycle. Although Bitcoin reached a new all-time high, Ether did not show similar gains. Infact, the ETH/BTC trading pair has dropped by 80% since 2022, which highlights its underperformance relative to Bitcoin.
Analyst Signals Potential Rebound for Ether
It had its worst quarter in five years in Q1 2025, dropping to $1,400 due to market downturns. However, analyst Ali Martinez has highlighted a positive sign on the price chart, which could suggest a potential rebound. He shared that Ether might be preparing for a big rebound as the TD Sequential Indicator on the weekly chart is showing a buy signal.
He has also identified $1,546.55 as a key support level for Ethereum, where 822,440 ETH were previously accumulated, noting it as a crucial level to watch closely.
Never Miss a Beat in the Crypto World!
Stay ahead with breaking news, expert analysis, and real-time updates on the latest trends in Bitcoin, altcoins, DeFi, NFTs, and more.
The post Galaxy Digital Moves $40M in ETH — Whale Activity Spikes as Ethereum Eyes Rebound appeared first on Coinpedia Fintech News
Galaxy Digital has recently moved 12,500 ETH to Binance, which marks its second-largest transfer in the last three days. A similar deposit of 12,500 ETH was made on April 12. The firm has sent a total of 25,000 ETH worth over $40 million in the last three days. Galaxy Digital moved the tokens in two …
Pi Network (PI) is down nearly 10% in the last 24 hours, as multiple indicators point to growing bearish momentum. The DMI shows a clear shift from an uptrend to a downtrend, while CMF data confirms increasing outflows.
EMA lines are also warning of a potential death cross, which could trigger further losses. Here’s a breakdown of what the charts are signaling for PI in the near term.
Bearish Momentum Builds as PI Network’s DMI Flips to Downtrend
Pi Network’s (PI) DMI chart reveals a clear shift in momentum, with the ADX dropping from 43.68 to 39.17 over the past two days.
The ADX, or Average Directional Index, measures the strength of a trend, with values above 25 generally indicating a strong trend.
Although the current reading still suggests solid momentum, the recent decline in ADX combined with the trend reversal from uptrend to downtrend signals that bullish strength is fading and bearish pressure is taking control.
Supporting this shift, the +DI (Directional Indicator) has dropped sharply from 22.11 to 13.29, while the -DI has surged from 11.32 to 30.95.
The +DI represents bullish strength, and the -DI represents bearish strength—so this crossover and widening gap confirm that sellers are now in control. This setup typically points to continued downside, especially if the -DI remains dominant and the ADX stabilizes or rises again, signaling a strengthening bearish trend.
Selling Pressure Intensifies as Outflows Accelerate on PI Network
Pi Network’s Chaikin Money Flow (CMF) has dropped sharply to -0.13, down from 0.07 just a day ago. The CMF is a volume-based indicator that measures the flow of money in and out of an asset over a set period.
It ranges from -1 to +1, with positive values indicating buying pressure and negative values suggesting selling pressure.
A sudden shift from positive to negative typically signals a change in sentiment and potential weakness ahead.
With the CMF now at -0.13, it suggests that outflows are picking up and sellers are becoming more active.
This kind of drop often reflects reduced demand and a lack of confidence from buyers, especially if it comes alongside declining prices or weakening momentum indicators.
If the CMF remains in negative territory, it could point to sustained bearish pressure and a risk of further downside for PI unless strong inflows return soon.
Will PI Fall Below $0.50?
Pi Network’s EMA lines are signaling a potential death cross, where the short-term moving average crosses below the long-term moving average.
This is typically seen as a bearish sign, often preceding further downside. If confirmed, it could lead PI to retest the support level at $0.54.