Dogecoin price might be getting ready for its next leg up after it pushed past a multi-week resistance. Because of this, an analyst now says that DOGE might get to $2. Meanwhile, the odds that the SEC is going to greenlight a spot ETF are rising, and this is attracting whale activity. DOGE trades at
The European Stability Mechanism (ESM) has raised concerns that the United States’ growing support for dollar-backed stablecoins could threaten Europe’s financial stability and monetary sovereignty.
These concerns come as stablecoin regulation gains traction in the US. US national banks and federal savings associations can offer services without prior regulatory approval.
EU Warns US Stablecoins Could Threaten Euro Stability
Pierre Gramegna emphasized the urgency of the European Central Bank’s (ECB) digital euro initiative as a countermeasure. As the Managing Director of the ESM, Gramegna urged expedition to preserve the country’s monetary sovereignty and financial stability.
“It could eventually reignite foreign and US tech giant’s plans to launch mass payment solutions based on dollar-denominated stablecoins. And, if this were to be successful, it could affect the euro area’s monetary sovereignty and financial stability,” Gramegna stated at a Eurogroup meeting.
The EU is advancing its digital euro project to safeguard its financial independence. The ECB has long warned that reliance on US-backed stablecoins could weaken the euro.
He echoes recent remarks by ECB official Piero Cipollone during an early February interview. Then, Cipollone indicated that the Trump administration’s support for stablecoins would likely accelerate legislation surrounding the digital euro. Such an outcome, he said, would position it as a necessary alternative.
“The US and Europe have differing views on stablecoins. The Trump administration sees them as a tool to strengthen the US dollar’s global presence, whereas the ECB fears they could destabilize Europe’s financial system,” Cipollone explained.
The ESM supports the ECB’s digital euro project and the European Commission’s efforts to revise the MiCA (Markets in Crypto-Assets) directive. Gramegna emphasized that these measures are critical in preventing a scenario in which European consumers and businesses become overly reliant on US-backed stablecoins.
Federal Reserve Chair Jerome Powell has also advocated for stablecoin regulation to solidify their role in financial markets. Meanwhile, new rules now permit US banks to offer stablecoin services, signaling further integration of stablecoins into traditional finance (TradFi).
These developments could accelerate the dominance of US-backed stablecoins in global transactions. Reports suggest that even Bank of America (BoA) is exploring launching its own stablecoin, while Circle CEO Jeremy Allaire is pushing for mandatory US registration of stablecoin issuers.
The debate over stablecoins mirrors broader geopolitical concerns. The dollar’s dominance in digital payments could grow as US financial institutions integrate stablecoins into their services. This could limit the euro’s influence.
European policymakers advocate for a strong regulatory framework and an accelerated timeline for the digital euro’s rollout to counter this.
Hedera (HBAR) is on the move, climbing more than 8% on Friday and extending its seven-day gains to an impressive 21.7%. This rally comes alongside rising momentum signals, including a surging BBTrend and an RSI that has pushed into overbought territory.
Price is also nearing a key resistance zone, backed by bullish EMA alignment that suggests the uptrend may still have room to run.
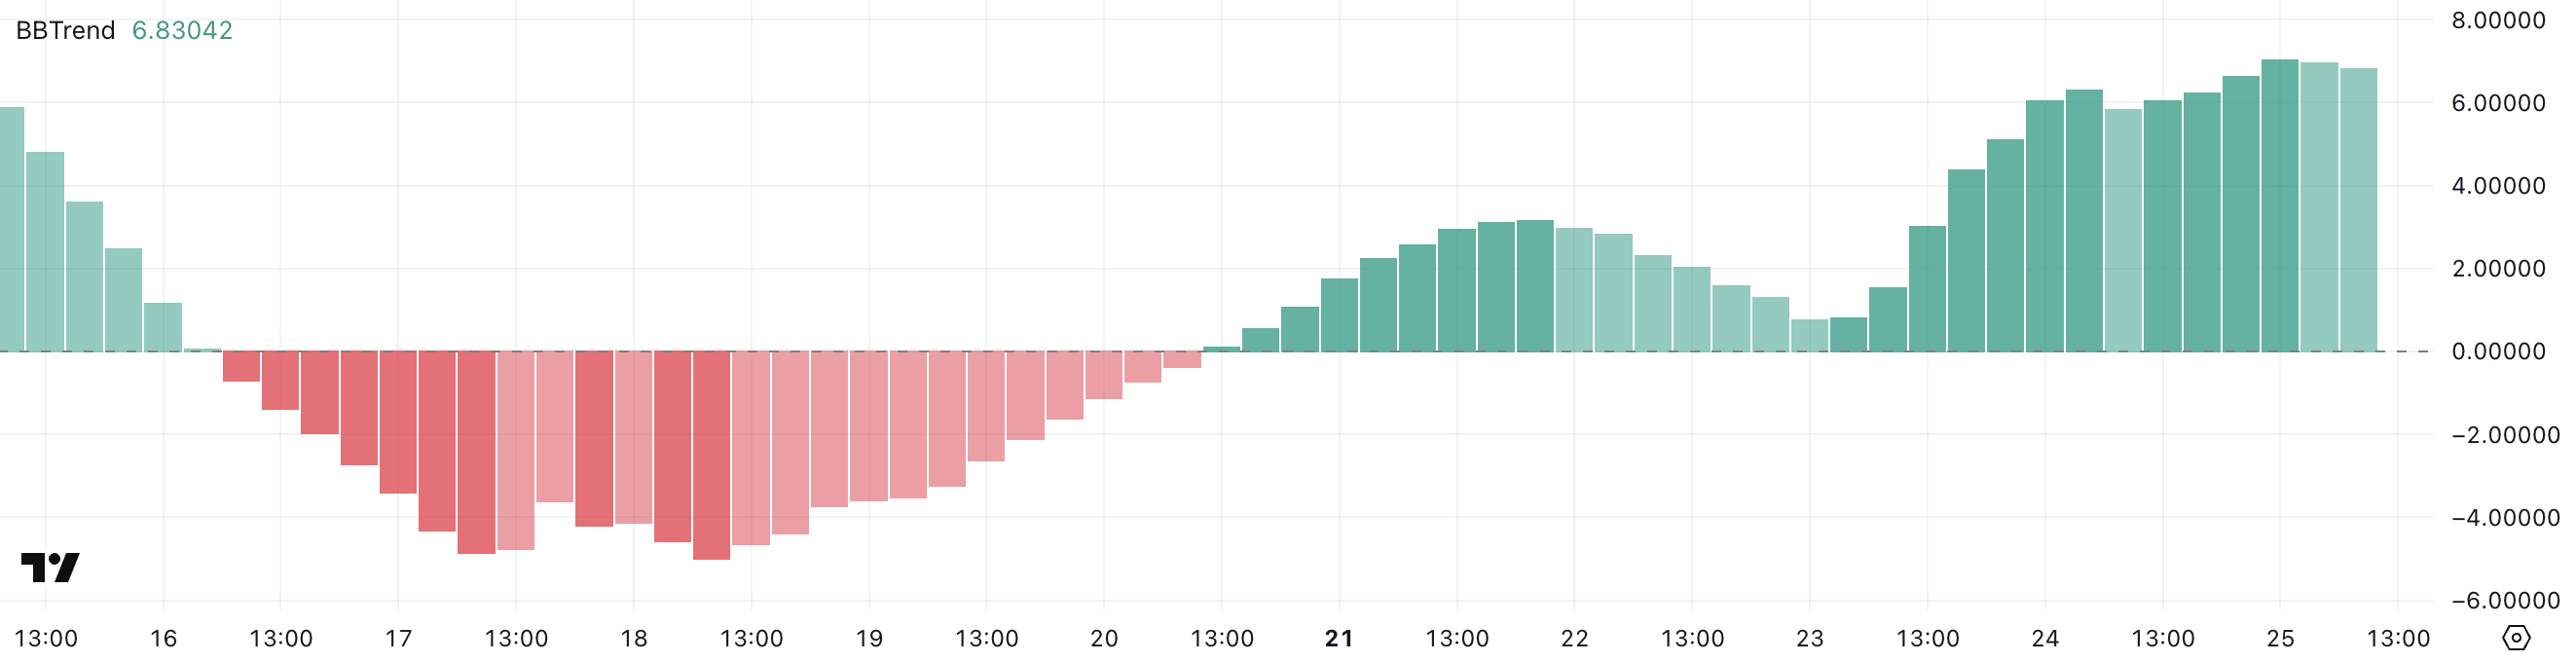
Hedera’s BBTrend Is Soaring – What Does it Mean?
Hedera’s BBTrend indicator has surged to 6.83, up sharply from just 1.5 two days ago. This jump signals a significant increase in volatility and momentum in the price action.
BBTrend, short for Bollinger Band Trend, is a metric derived from Bollinger Bands that measures the strength and direction of a trend. Values below one typically reflect a weak or flat market, while values above 3 indicate the emergence of a strong trend.
A sudden rise in BBTrend often suggests that the asset is transitioning out of a low-volatility phase and entering a more directional move.
With BBTrend now at 6.83, Hedera may be in the early stages of a strong bullish or bearish breakout. Such elevated levels suggest that volatility is expanding quickly, and price is starting to move decisively away from its recent range.
While BBTrend doesn’t indicate direction on its own, when combined with other bullish signals, like rising price or volume, it can confirm the start of a sustained uptrend.
Traders will watch closely to see if this momentum continues or fades, as a reversal from such elevated levels could also lead to sharp pullbacks.
Hedera RSI Enters Overbought Zone—What Comes Next?
With RSI now well into overbought territory, Hedera may be nearing a local top—at least temporarily. While a high RSI confirms strong bullish momentum, it can also signal that buyers are becoming exhausted.
On the other hand, sustained overbought conditions can also occur during strong uptrends, so that traders will watch closely for either continued breakout strength or signs of reversal.
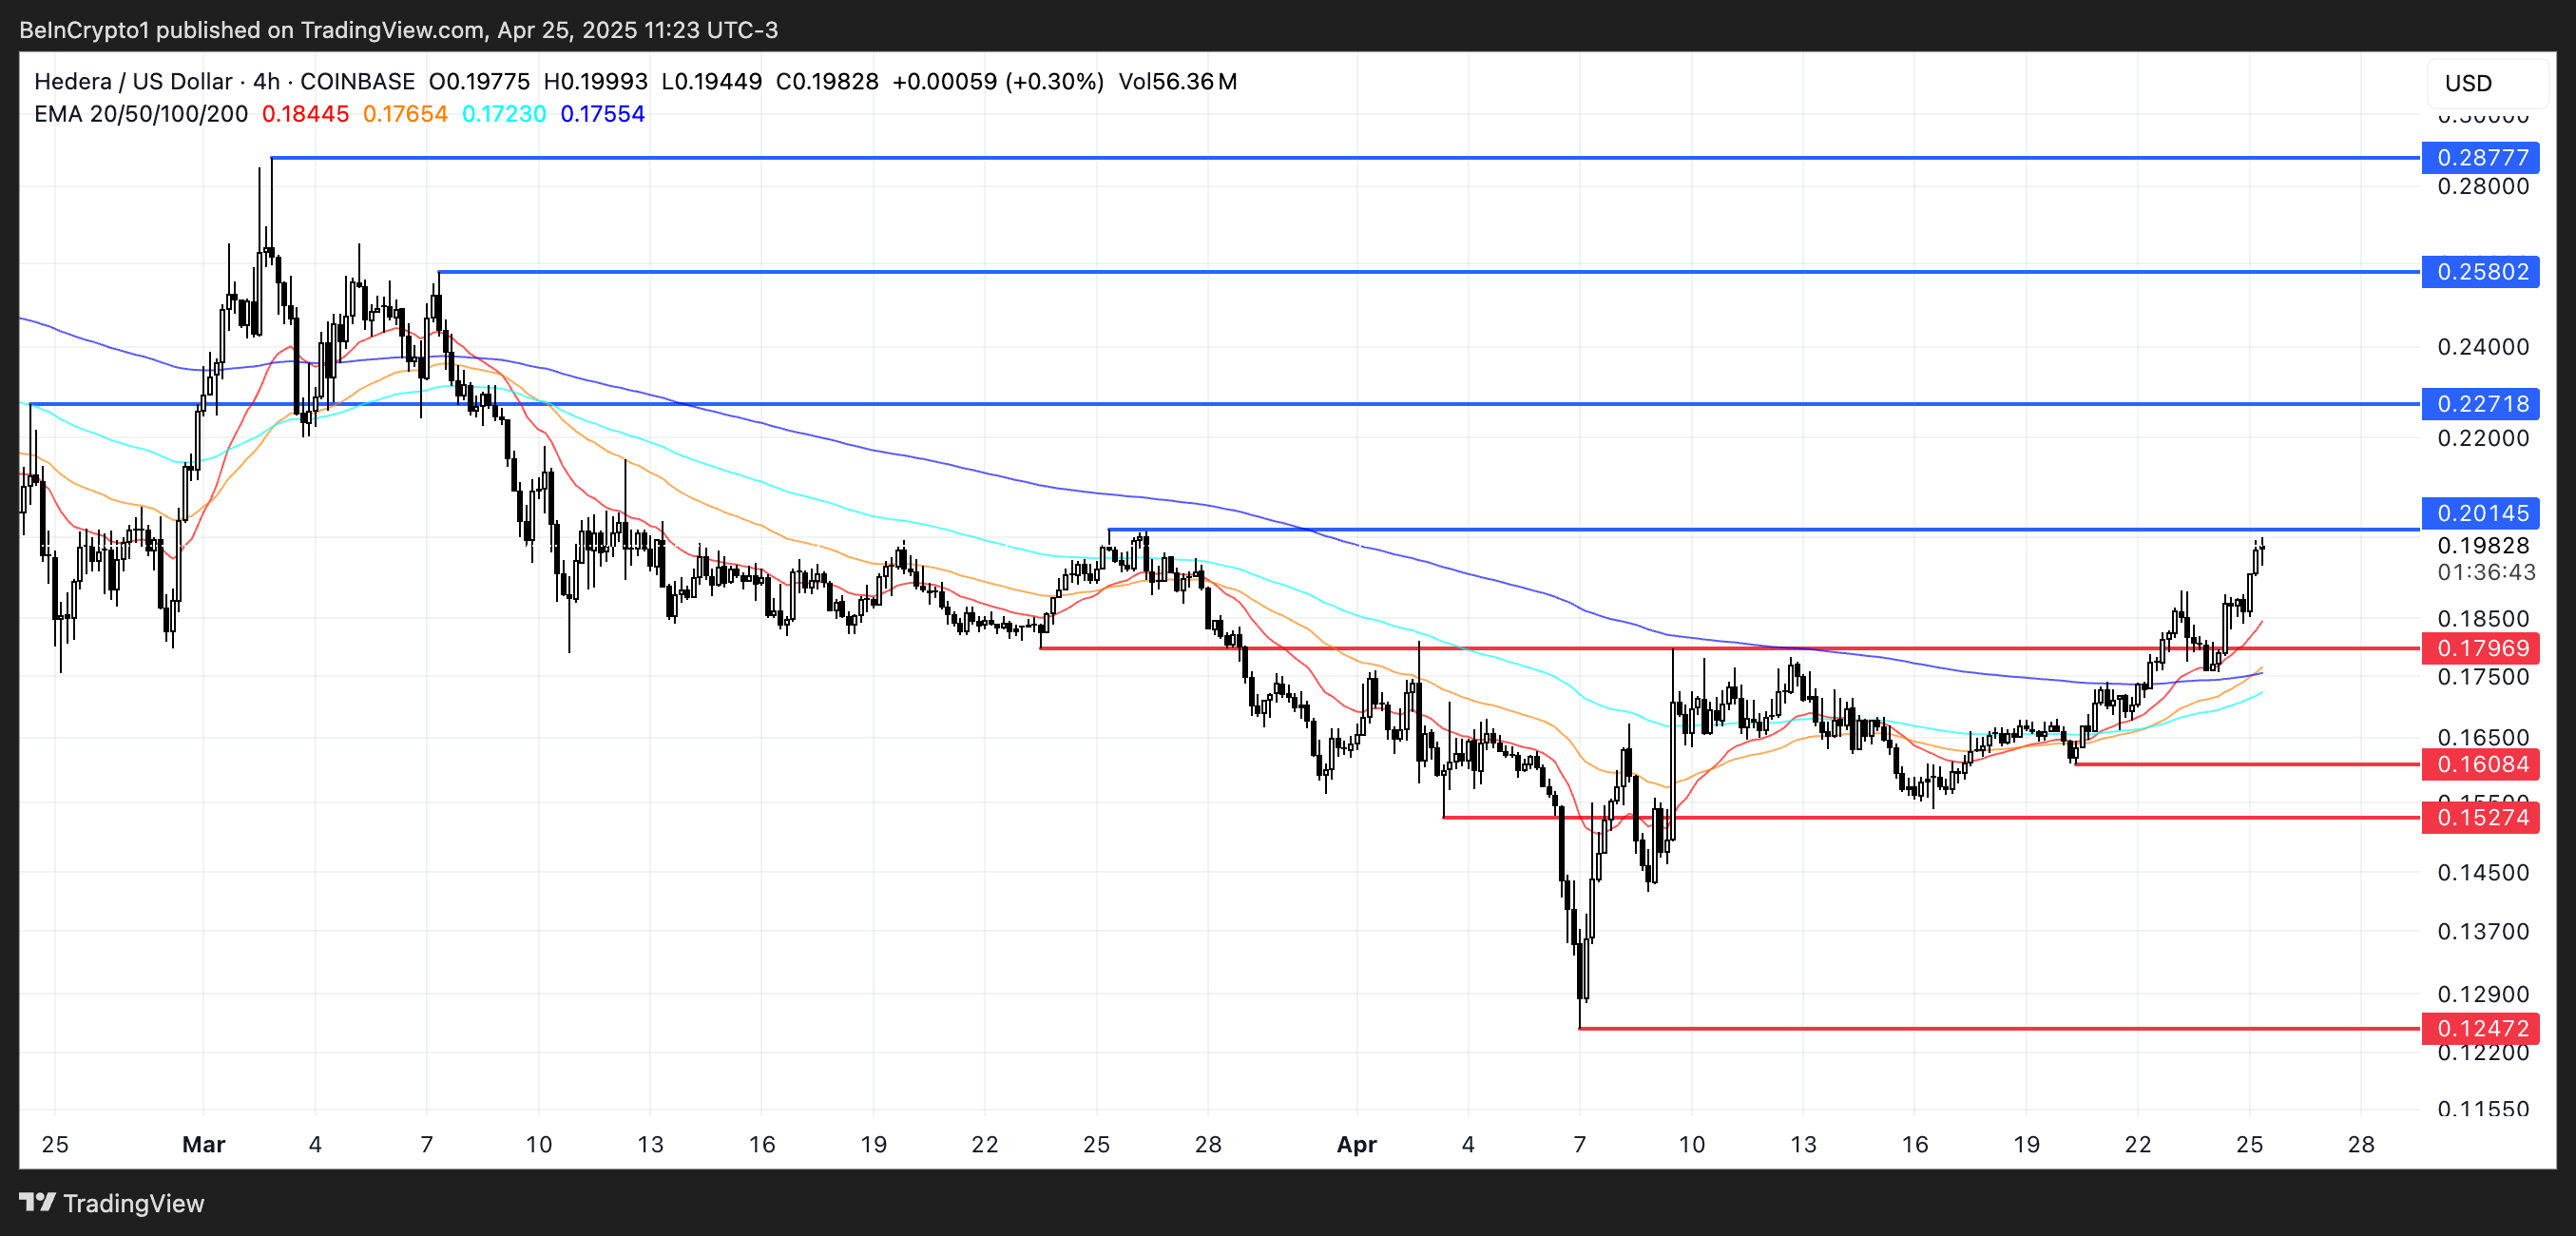
Hedera Nears Breakout—But Support Levels Are Key
Hedera’s EMA lines show a bullish alignment, with short-term moving averages positioned above the long-term ones—a classic signal of upward momentum.
HBAR price is also trading near a key resistance level at $0.20, which has acted as a ceiling in recent sessions. If buyers can push the price through this zone, the next resistance levels to watch are $0.227 and $0.258.
A strong uptrend continuation could even send HBAR to $0.287, marking its first break above $0.28 since February 1.
However, traders should also monitor the downside risk. If the support at $0.179 is tested and fails, it could trigger a deeper pullback.
In that case, HBAR may slide to $0.16 and possibly $0.152, both of which have served as prior support zones.
If bearish momentum accelerates, a drop toward $0.124 isn’t out of the question, making the current levels a critical battleground for short-term direction.
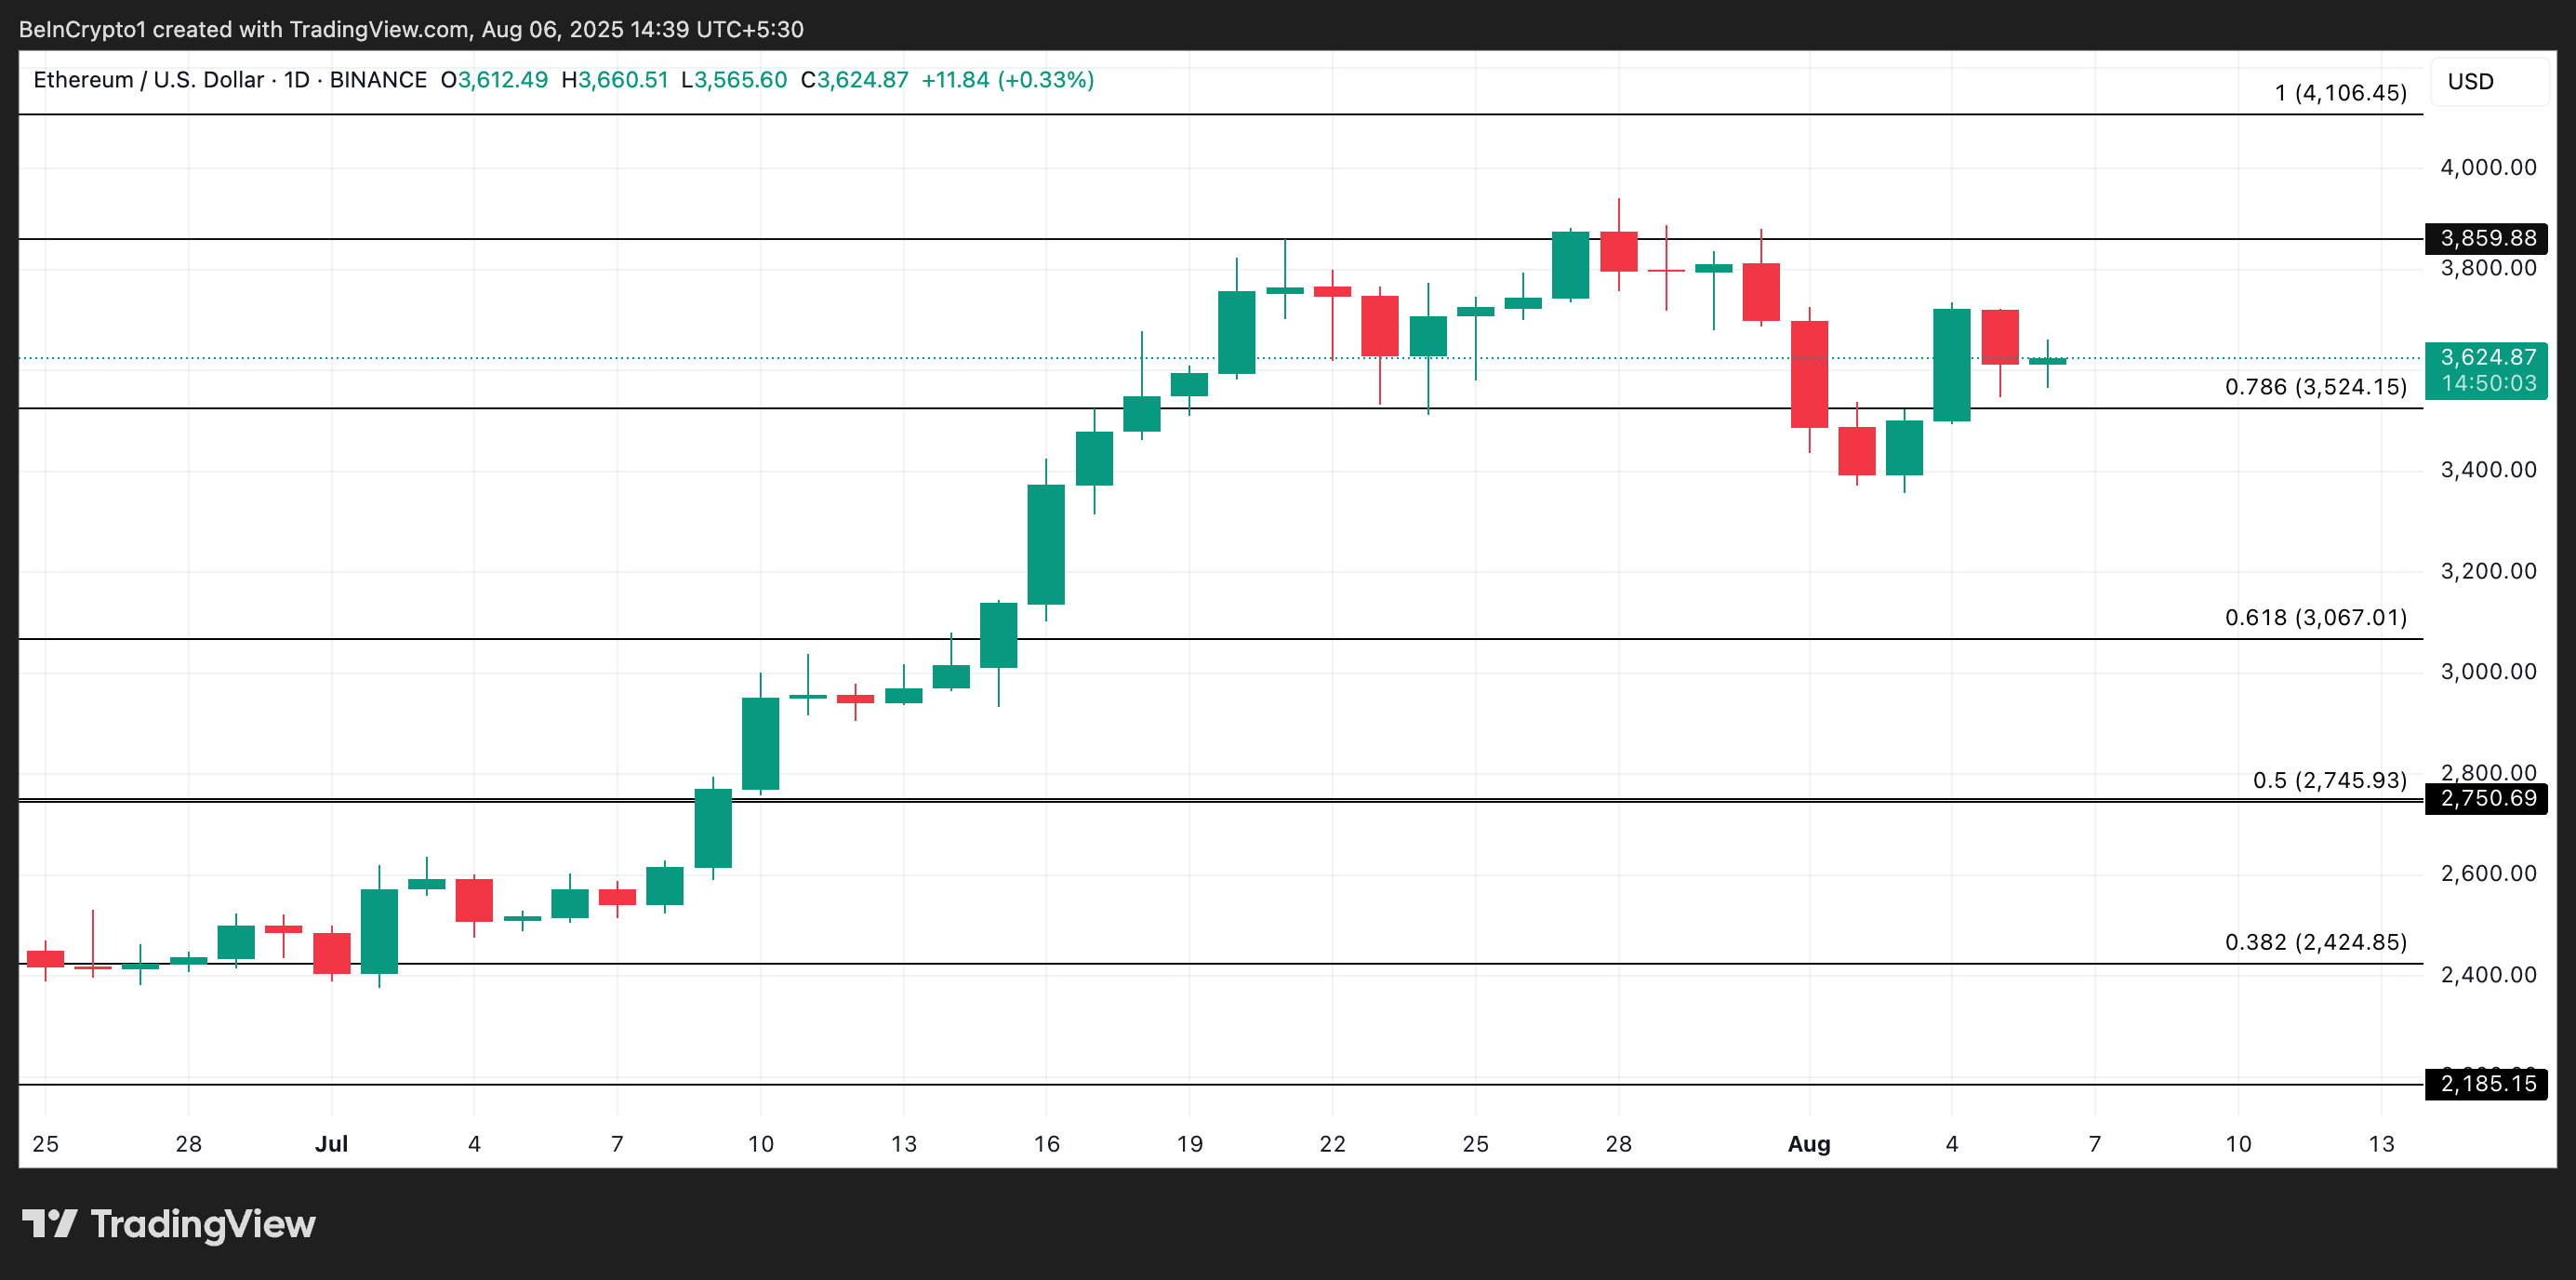
Over the past two weeks, the broader crypto market has shown lackluster performance, keeping Ethereum within a tight trading range.
Since July 21, the altcoin has repeatedly tested resistance near $3,859 while finding support at $3,524, struggling to break clear of this zone. With momentum fading, key on-chain metrics now suggest that ETH may face an extended period of sideways consolidation or a potential price breakdown.
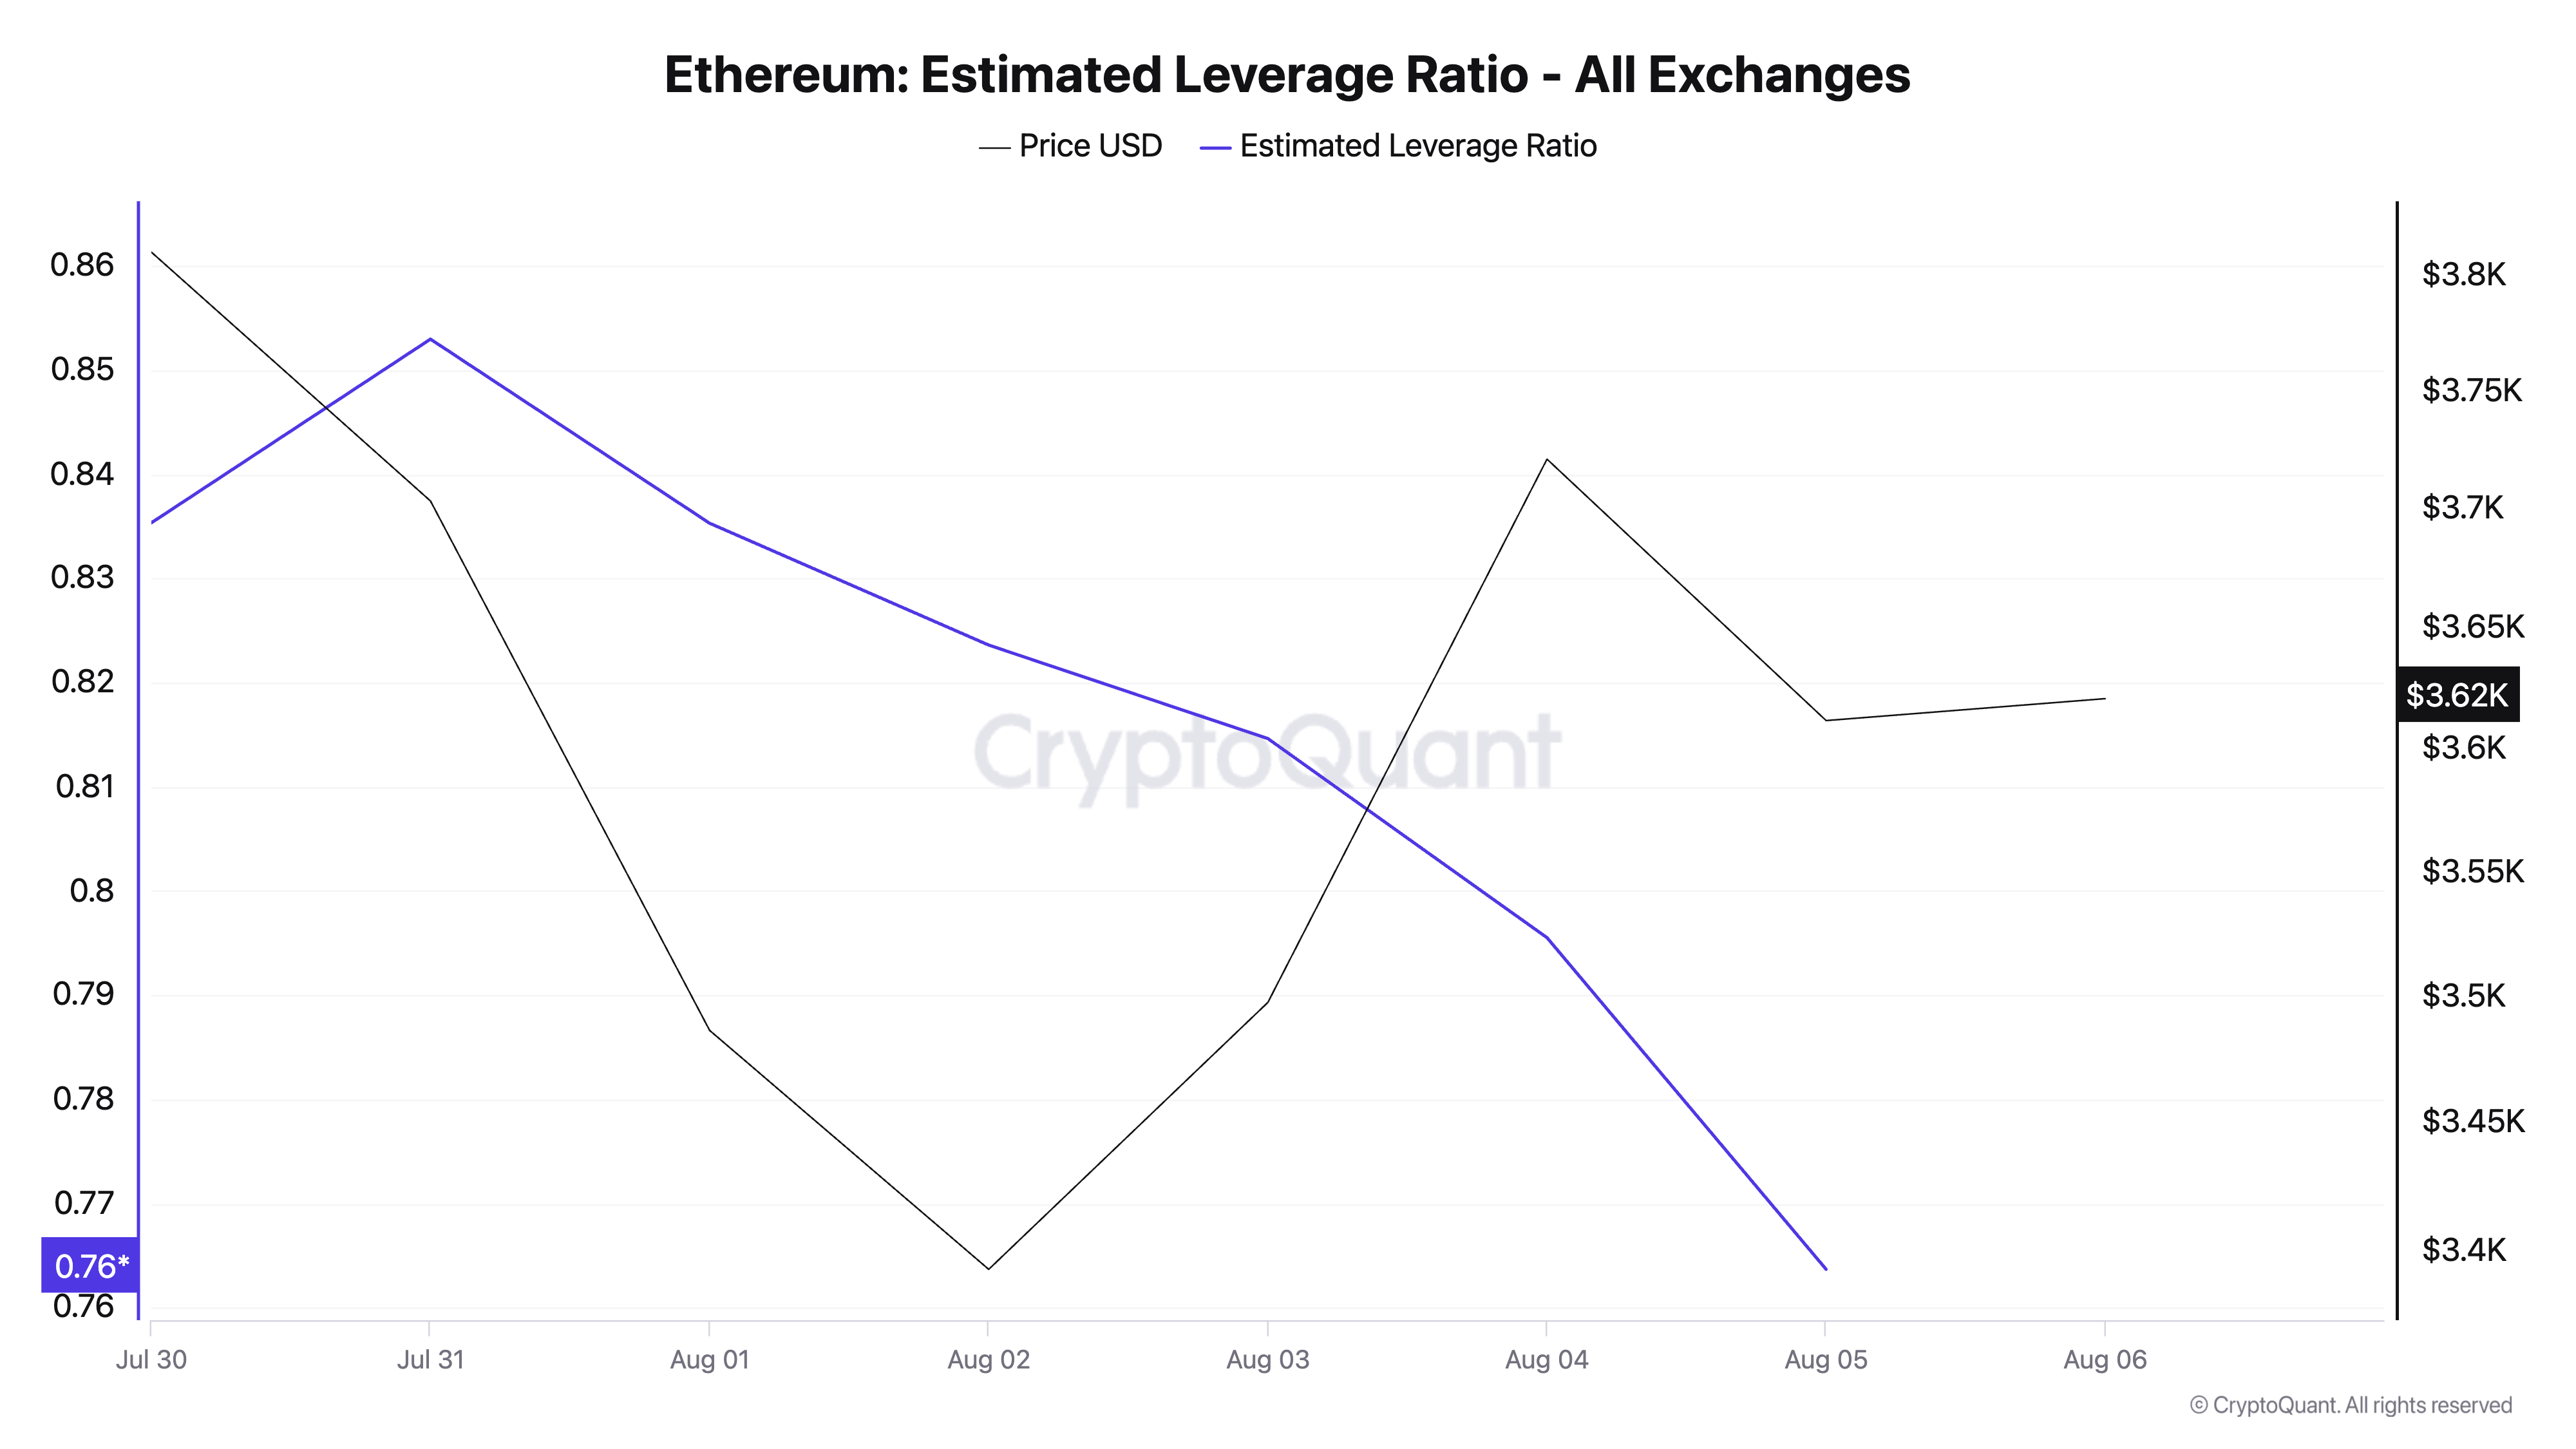
Ethereum’s Big Players Step Back
According to CryptoQuant’s data, ETH’s falling estimated leverage ratio (ELR) across all cryptocurrency exchanges reflects waning investor confidence and a declining appetite for risk among its futures traders. Per the data provider, ETH’s ELR now sits at a weekly low of 0.76.
For token TA and market updates: Want more token insights like this? Sign up for Editor Harsh Notariya’s Daily Crypto Newsletter here.
The ELR metric measures the average amount of leverage traders use to execute trades on an asset on a cryptocurrency exchange. It is calculated by dividing the asset’s open interest by the exchange’s reserve for that currency.
ETH’s declining ELR signals a market environment where traders avoid high-leverage bets. Its investors are growing cautious about the coin’s short-term prospects and are not taking high-leverage positions that could amplify potential losses.
If this pullback in speculative activity continues, it will reduce the likelihood of a near-term breakout and increase the chances of ETH remaining range-bound.
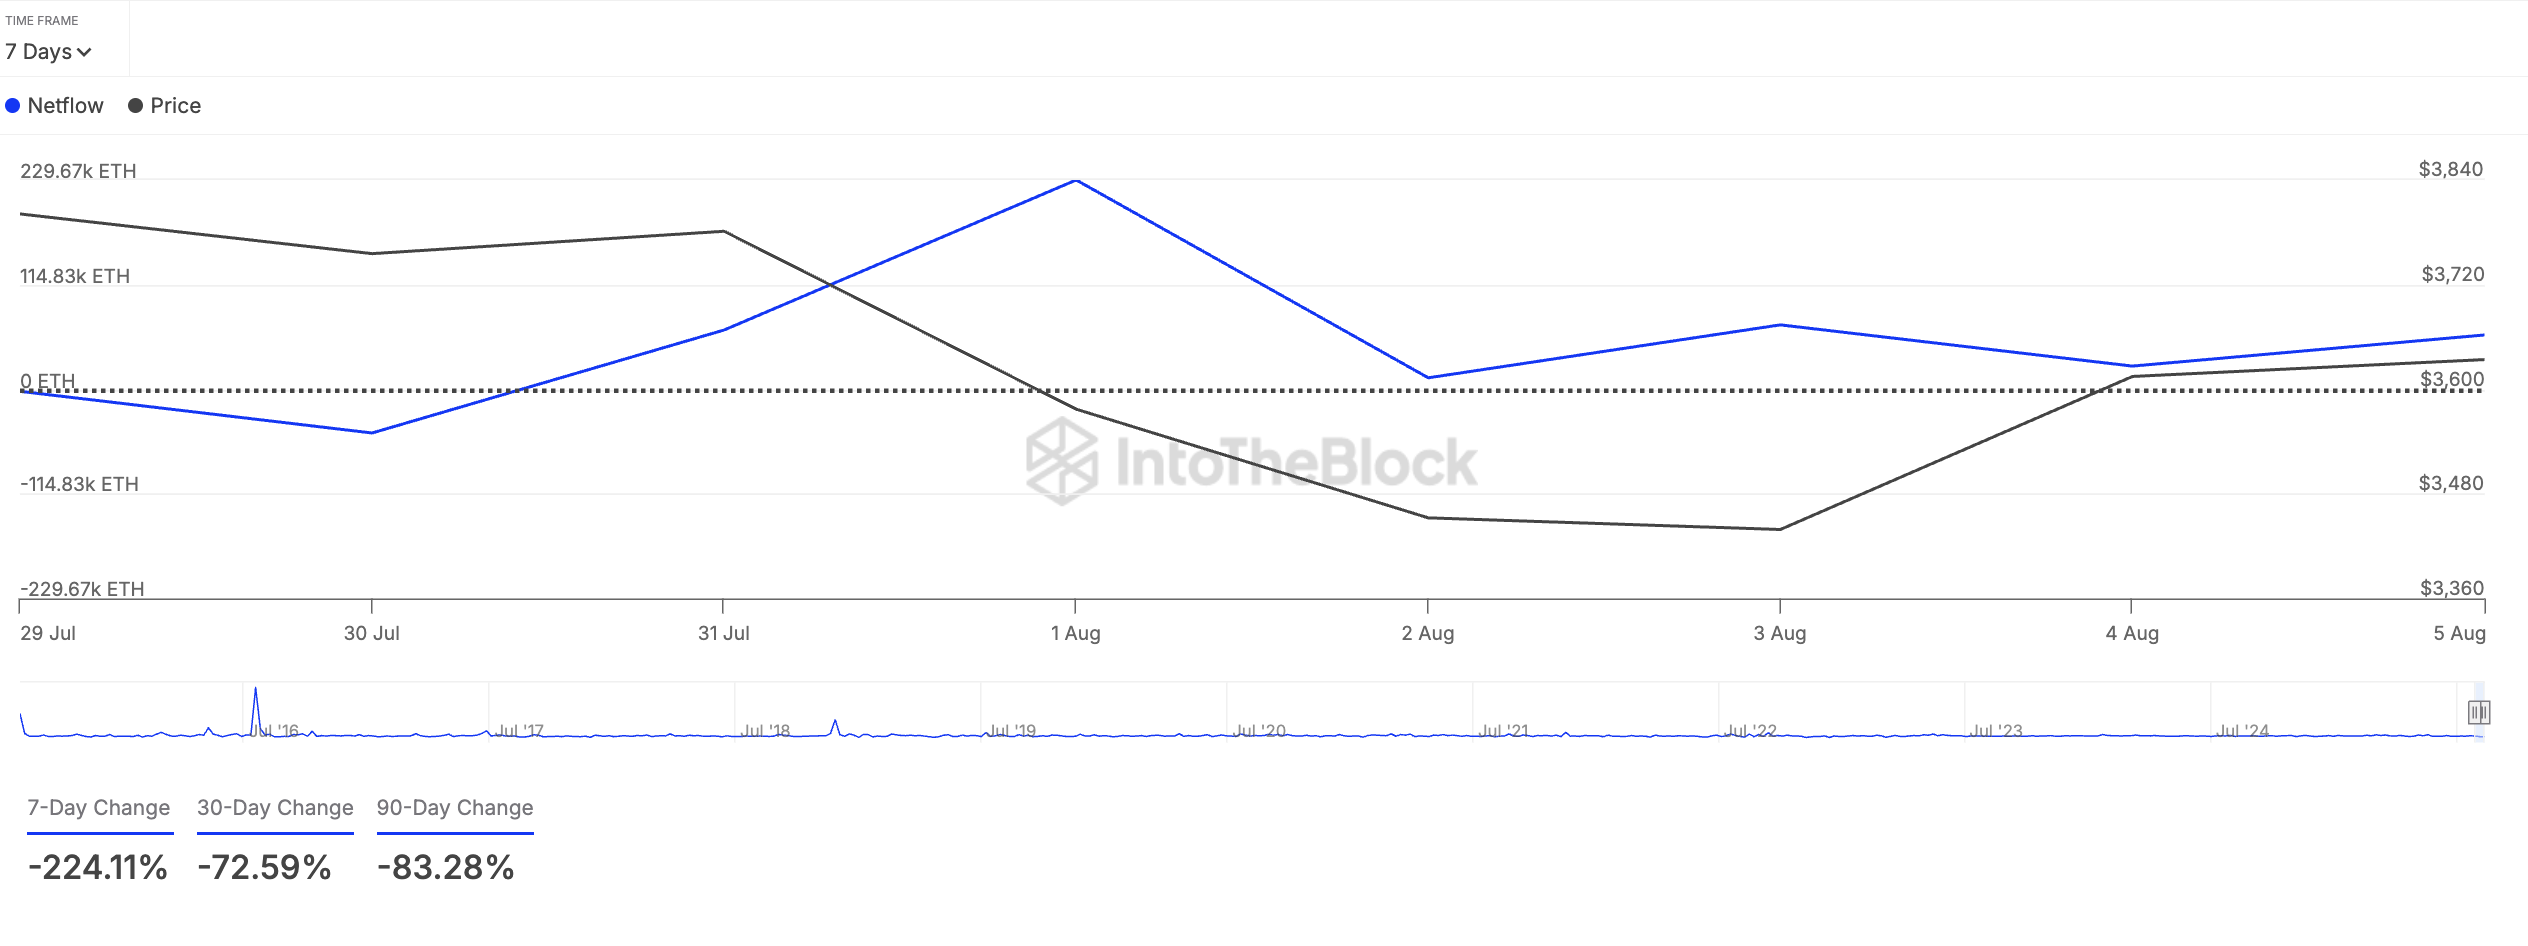
Furthermore, ETH whales have also reduced their accumulation over the past week, possibly to lock in profit. According to IntoTheBlock’s data, the coin’s large holders’ netflow is down 224% in the last seven days, showing the retreat from ETH’s key holders.
Large holders are whale addresses controlling over 0.1% of an asset’s circulating supply. Their netflow tracks the difference between the coins they buy and the amount they sell over a specific period.
When an asset’s large holders’ netflow increases, whales are buying more of its coins/tokens on exchanges, potentially in anticipation of a price rally.
On the other hand, as with ETH, when it declines, it signals reduced activity and profit-taking among these key investors.
ETH Bulls and Bears Face Off: Will $3,524 Hold or Break?
The metrics above highlight waning confidence in ETH’s near-term price gains and a reluctance among its key holders to commit significant capital to the market right now. If this persists, bearish pressure on the coin will increase, potentially triggering a breach of support at $3,524.
If this happens, the coin could extend its dip to $3,067.However, if the bulls regain dominance, they could drive a break above the resistance at $3,859. If successful, ETH’s price could climb above $4,000.