DeFi Development Corp follows a similar approach to SOL Strategy to issue debt securities to purchase more SOL coins.
SOL price has hinted at a potential parabolic rally in the coming months bolstered by institutional tailwind.
DeFi Development Corp. (NASDAQ: DEFI), a Florida-based blockchain and DeFi-focused company, filed a Form S-3 registration statement with the United States Securities and Exchange Commission (SEC) on April 25, to offer up to $1 billion in securities. According to the SEC filing, DeFi Development Corp intends to register up to 1,244,471 shares of common stock for potential resale by existing stockholders.
“We may sell any combination of these securities in one or more offerings, at prices and on terms to be determined prior to the time of the offering, with an aggregate offering price of up to $1,000,000,000,” the filing noted.
The company noted that the proceeds from the intended offering will be used for general corporate purposes, including the acquisition of Solana (SOL).
Market Impact of DeFi Development Corp’s Move
The strategic move by DeFi Development Corp to raise $1 billion, under the Donald Trump administration, will have a far-reaching influence on the wider crypto market. Furthermore, the validation of the crypto market by institutional investors has helped increase liquidity and enabled ongoing mainstream adoption of digital assets and web3 technology.
The Solana network stands to benefit most from the DeFi Development Corp’s deal. As Coinpedia reported, SOL Strategies intends to raise up to $500 million to purchase more Solana coins in the near term.
Consequently, SOL price will likely continue with bullish sentiment in the coming months, especially if the highly anticipated altseason kickstarts. Moreover, the Solana network has recorded a sharp uptick in cash inflows in the past few months, led by stablecoins such as Circle’s USDC.
Ethereum (ETH) has had a rough ride recently, plunging 28% last month and falling below $2,000 in the recent crypto market crash.. investors wondering whether ETH can stage a comeback as it currently trades at $1,874.97, some critical indicators suggest a rebound could be on the horizon. From whale accumulation to technical signals and rising market interest, Ethereum price may be gearing up for a major rally. At the same time, a new coin – Rexas Finance (RXS), a promising Ethereum-based token, is gaining traction. With a record-breaking presale and growing investor confidence, RXS is currently priced at $0.20, with its launch price set at $0.25 on June 19, 2025. Both ETH and RXS are positioning themselves as top contenders for the biggest crypto gains in 2025. Let’s dive into why.
3 Reasons Ethereum Price Could Rally Soon
The following are reasons why ETH price is poised to surge soon.
Whales Are Accumulating Ethereum
Recently, Ethereum whales have been aggressively buying the ETH price dips while adding a total of 1.1 million coins within just 48 hours. This signals a potential rebound, due to increased confident in the leading altcoin. History records that, whenever whales accumulate during price declines, it often results into price recovery in the days that follow.
As institutional investors look for cheaper entry opportunities, the current Ethereum price of $1,874.97 may be seen as undervalued, setting the stage for a significant rally.
Ethereum price chart
Ethereum Price RSI Suggests a Bullish Reversal
Ethereum’s RSI is currently about 22, much below the 30 mark. This implies that ETH is oversold, so selling pressure has been too high, and a reversal could be about to happen. For traders trying to profit from a possible bounce, an RSI falling to such low levels usually indicates a strong buying possibility.
Historically, Ethereum’s RSI falling below 30 has typically signaled a major price comeback. For instance, past cases of ETH exceeding sell conditions have resulted in a price recovery of 20% or more in the following weeks. Ethereum is presently in a similar state; hence, a relief rally might be imminent as buyers retreat to benefit from the lowered prices.
Rising Social Dominance and Trading Volume
Technical analysis isn’t the only factor backing Ethereum’s comeback potential. Its growing market presence adds weight to this possibility. Santiment, an on-chain analytics company, reports that ETH now makes up 9.2% of all crypto talks.
This boost in attention shows that traders, analysts, and investors are keeping a close eye on Ethereum. More discussion and interest often come before price changes, as this buzz tends to draw in new buyers.
Also, Ethereum stays one of the most traded assets on platforms like Coinbase, which points to steady demand even during the market slump.
Rexas Finance (RXS): The Rising Star Poised for Explosive Growth
As Ethereum price prepares for a possible recovery, another asset is causing a stir in the cryptocurrency market—Rexas Finance (RXS). As a token on the Ethereum network aimed at tokenization of real-world assets (RWA), RXS is rapidly gaining popularity in anticipation of its forthcoming exchange launch.
Now priced at $0.20 in its last presale phase, the RWA token has successfully raised an impressive $47.01 million, with 91.02% of this round already sold. RXS will debut at $0.25 on June 19, 2025, representing an important achievement for early investors who have experienced increases exceeding 500%.
Rexas Finance Tokenomics
Reasons Investors Are Attracted to RXS
Notable presale results: The high level of interest in RXS as a new cryptocurrency while in its presale phases, emphasizes investor trust in its future prospects.
Whale interest: A significant recent acquisition of $85,000 in RXS reinforces the token’s increasing attraction to wealthy investors.
$1 Million Giveaway: The project’s tactical marketing, featuring a $1 million giveaway with more than 1.6 million participants, has created significant excitement, drawing in both retail and institutional investors.
RWA tokenization: As the tokenization of real-world assets gains traction in the crypto world, RXS stands out as a key contender in this area, establishing itself as one of the most promising tokens for 2025
Final Thoughts: ETH and RXS-A Perfect Pair for 2025?
As Ethereum price gets ready for a possible price upturn, the mood in the wider crypto market will get better. This could help promising projects like Rexas Finance (RXS). Analysts anticipates that Ethereum’s comeback might spark a strong rally in other coins, and RXS, with its solid foundations, could be a big winner. Big investors are buying up ETH technical signs are good, and market interest is growing. All these point to a bright future for ETH. RXS is riding the wave of Ethereum’s network success. Both these assets could end up as some of the top performers in 2025. If you’re looking for chances to make big gains, watching Ethereum’s recovery and Rexas Finance’s upcoming launch could be a smart move that changes the game.
With Consensus 2025 just weeks away, new Pi Core Team (PCT) updates are drawing attention from the Pi Network community. The team has officially approved a new decentralized app (DApp) called Fruity Pi, and according to community member DR Altcoin, DApps and long-awaited KYB approvals might speed up.
What is Fruity Pi?
Fruity Pi is a puzzle game where players match fruits and earn rewards. Users can also link their Pi wallets and spend Pi tokens in the game. The Pi Core Team has given it a purple check mark, which means the app has been reviewed and approved.
This approval is a big step, as only verified apps are allowed to fully launch and grow within the Pi ecosystem. DR Altcoin believes this move could speed up other pending approvals and finally kickstart delayed KYB (Know Your Business) checks—an important requirement for businesses to launch services on Pi.
Major Pi Network Announcement During Consensus 2025 Event?
These updates are happening just before the major Consensus 2025 summit in Toronto. This is one of the biggest events in the crypto space, and many expect the Pi Core Team to be present. With a new DApp approved and a possible wave of more approvals coming, Pi Network might be preparing to show its progress on a global stage.
Pi Coin Exchange listing Fading
Despite recent progress in the Pi ecosystem, Pi Coin is still facing problems getting listed on major exchanges. HTX was the first to list Pi after its mainnet launch in February 2025, but later removed it. Now, crypto payment service Banxa has also stopped supporting Pi Coin.
Even BitMart, which once supported Pi, has paused trading for more than a month, waiting for KYB approvals before moving forward with the 1:1 Pi swap. Meanwhile, top exchanges like Binance and Coinbase have not shown any signs of supporting Pi Coin.
Pi coin Price Analysis
Pi Coin is facing increasing bearish sentiment, despite the overall crypto market doing well. Pi Coin price today is trading at $0.65. It has stayed in a tight range between $0.60 and $0.68 over the past two weeks. While there’s been a small price increase in the last 24 hours, the RSI (Relative Strength Index) has dropped below 50, suggesting there’s still pressure on the price.
FAQ
Can I really earn and spend Pi tokens in Fruity Pi?
Yes, Fruity Pi allows players to link their Pi wallets, earn rewards, and spend Pi tokens within the game.
What announcements can we expect from Pi Network at the Consensus 2025 Event?
With Consensus 2025 approaching, the Pi Core Team may reveal new DApp approvals, KYB updates, and ecosystem progress.
When will Pi Coin be listed on major exchanges like Binance or Coinbase?
There’s no official timeline yet. Exchange listings likely depend on KYB approvals and Pi Network’s mainnet readiness.
Is it a good time to buy Pi Coin?
Pi Coin is still in early development with limited exchange access, so it’s best to watch for updates before making a move.
The post Pi Network News Today: New DApps, New Momentum: Pi Network Gears Up Ahead of Consensus 2025 appeared first on Coinpedia Fintech News
With Consensus 2025 just weeks away, new Pi Core Team (PCT) updates are drawing attention from the Pi Network community. The team has officially approved a new decentralized app (DApp) called Fruity Pi, and according to community member DR Altcoin, DApps and long-awaited KYB approvals might speed up. What is Fruity Pi? Fruity Pi is …
Bitcoin (BTC) has attempted to regain midterm bullish sentiment after rebounding from the crucial targets on Monday, August 4, 2025. The BTC/USDT pair rebounded nearly 1 percent from the 50-day Moving Simple Average (SMA) to trade around $114,981 during the mid-New York session.
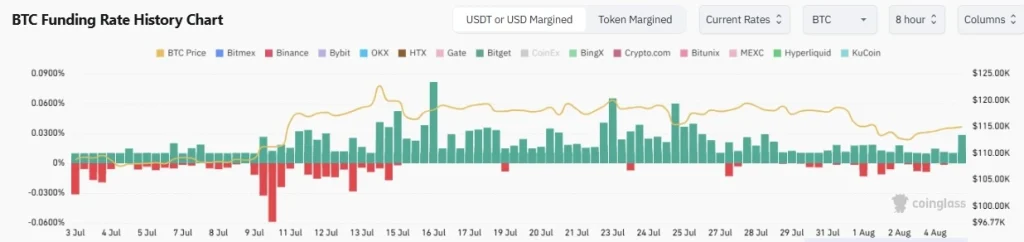
The wider crypto bullish rebound today was bolstered by the rising interest in artificial intelligence (AI), which helped U.S. stocks add over $1 trillion in market cap. Additionally, Bitcoin’s Funding Rate has remained positive for more days since mid-July 2025.
On-chain Data Shows Whale Investors Are Buying Retail Doubt and Fears
As Coinpedia reported, a series of re-awakenings by Satoshi-era whales has dramatically increased retail traders’ midterm fear amid long-term bullish crypto sentiment. Nonetheless, on-chain data shows whale investors, led by Bitcoin-treasury entities, have remained convinced of BTC’s ability to hedge against inflation and market uncertainty.
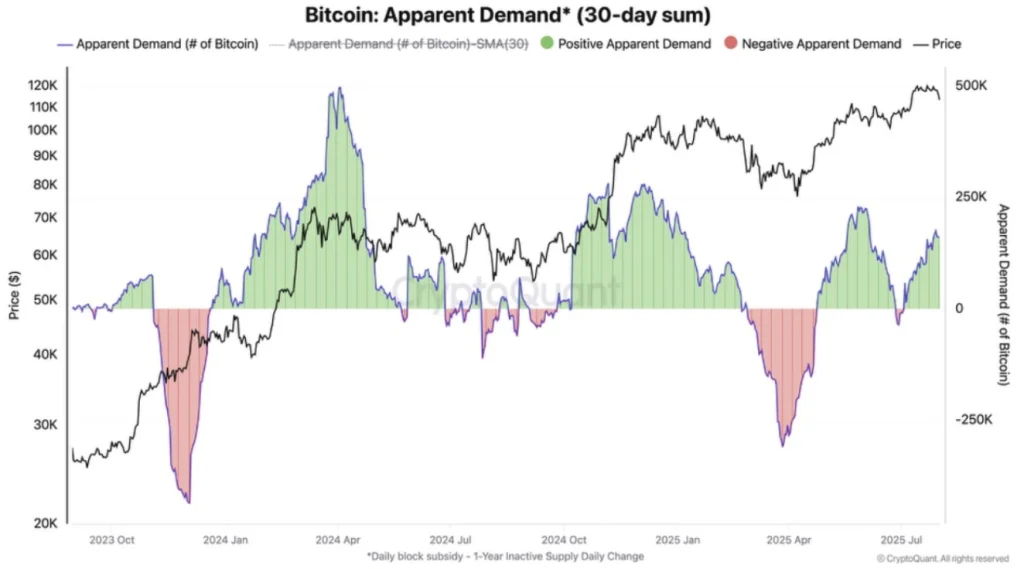
According to market aggregate data from Bitcointreasuries, the number of BTC-treasury entities increased by 23 in the past 30 days, thus their holdings rose by 4.4% in the same period to hover around 3.64 million. On-chain data analysis provided by CryptoQuant shows Bitcoin’s demand remains intact, especially after accumulating around 160k BTCs in the past 30 days.
Key Midterm Targets for BTC/USDT
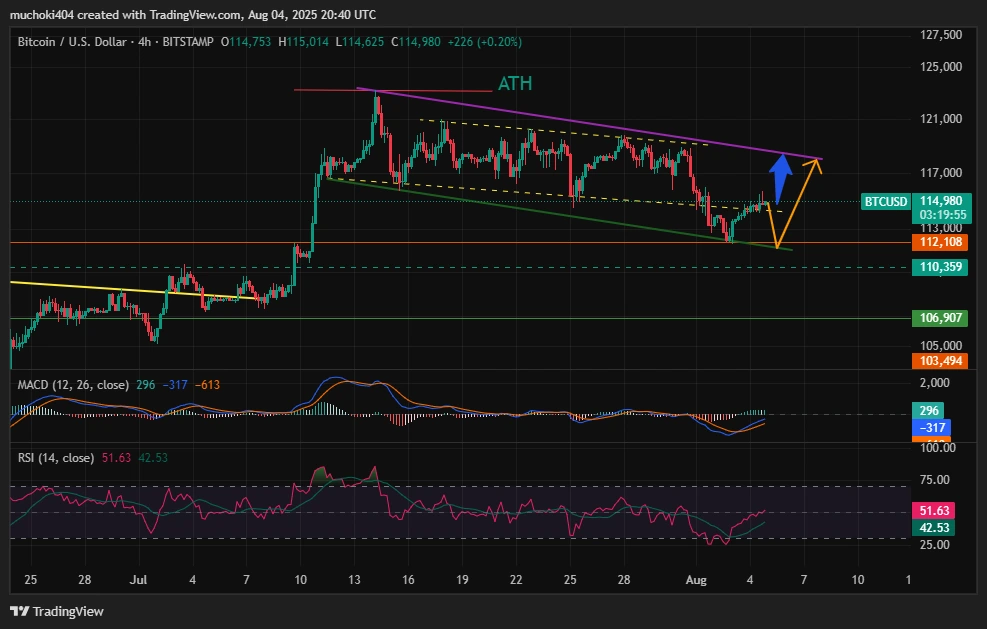
Bitcoin price has been trapped in a falling logarithmic trend since hitting its all-time high (ATH) around $122,296 on July 14, 2025. The midterm volatility is well-primed to heat up later this week amid high-impact news from the Bank of England (BOE), which is expected to cut its interest rate to 4 percent from 4.25 percent on Thursday.
In the four-hour timeframe, the BTC/USD pair rebounded from the lower border in the past 24 hours. A consistent close above $115k should trigger a midterm rally towards $117.8k. However, it is prudent to consider a potential retest of $112k before a rally towards ATH soon.
The post Bitcoin Price Analysis and Prediction: Key Targets for This Week appeared first on Coinpedia Fintech News
Bitcoin (BTC) has attempted to regain midterm bullish sentiment after rebounding from the crucial targets on Monday, August 4, 2025. The BTC/USDT pair rebounded nearly 1 percent from the 50-day Moving Simple Average (SMA) to trade around $114,981 during the mid-New York session. The wider crypto bullish rebound today was bolstered by the rising interest …