The website of Curve Finance, a major decentralized finance (DeFi) protocol, has reportedly been hacked.
The team posted an urgent alert on X (formerly Twitter), advising users not to interact with the platform. While details remain vague, the protocol has potentially suffered a DNS hijack.
Curve Finance Hacked – What We Know So Far
The incident has reportedly impacted multiple DeFi projects. Convex Finance and Resupply, both of which rely on Curve’s data feeds, reported outages and functionality issues.
Both teams confirmed their own platforms remain secure, but dependent services are disrupted until Curve’s domain is restored.
Convex’s website uses data from Curve, and Curve’s domain name is currently suffering an attack. As a result, this data is currently unavailable, which negatively impacts most of Convex’s website. Convex’s website is safe but will not work correctly until Curve’s domain name… https://t.co/d4npGmMgyn
DNS hijacking is a type of cyberattack where attackers manipulate the Domain Name System to redirect users to malicious sites. In this case, attackers could trick users into interacting with fraudulent versions of Curve’s platform.
Security experts and users have flagged this as a strong reminder of the risks associated with DeFi frontends. Unlike decentralized smart contracts, web frontends remain vulnerable to traditional attacks such as DNS hijacking.
Projects linked to Curve, including Convex, have emphasized that while their backends are unaffected, users should avoid signing transactions or interacting with dApps tied to Curve during this period.
While all smart contracts are safe, the domain name points to a malicious site which can drain your wallet!
We are investigating and working on recovering the access.
Curve Finance said it is working with affected partners to resolve the issue. As the investigation continues, further updates are expected.
This situation highlights the need for DeFi protocols to focus more heavily on frontend security. Recent DeFi hacks reflect that the front end remains an exposed vector despite decentralized architectures.
“After rigorous reviews, CoinEx will list PI (Pi) on March 18, 2025,” the exchange stated in its announcement.
With this latest listing, Pi Coin is now available on 12 exchanges, as per Coinranking data. Despite this expansion, the possibility of a Binance listing remains uncertain.
“The failure to get listed on Binance, despite 86% of the community voting in favor, raises serious concerns about public trust in the project,” a pioneer wrote on X.
Pioneers Demand Transparency on Pi Network’s Funding Sources
An investigation by one of Pi Network’s pioneers uncovered that SocialChain Inc., the company behind Pi Network, has received investments from three firms: 137 Ventures, Ulu Ventures, and Designer Fund. However, the investigation revealed a key issue: two of these investors have not included Pi Network in their official investment portfolios.
Additionally, none of these firms have disclosed the amount of money they have invested in Pi Network despite being forthcoming with investment details for other companies.
“Why is Pi Core Team keeping this under wraps? Pioneers deserve transparency. If Pi Network aims for long-term sustainability, the team must be more open about its financial backing and key partnerships,” the post read.
Notably, a previous lawsuit by former co-founder Vince McPhillip against Pi Network offers additional insight into the project’s funding methods. The complaint outlined a series of claims, including wrongful termination, intentional and negligent infliction of emotional distress, and breach of fiduciary duty.
Nonetheless, it detailed that the project had raised funds by selling financial instruments called SAFE (Simple Agreement for Future Equity).
According to the lawsuit, Pi Network sold SAFE agreements in September 2019 with a maximum valuation of $20 million. During this fundraising round, the project raised $500,000. A few months later, in February 2020, Pi Network conducted another fundraising round at the same $20 million valuation, raising an additional $300,000.
Despite these fundraising efforts, the lack of clear financial disclosure continues to fuel concerns within the Pi Network community.
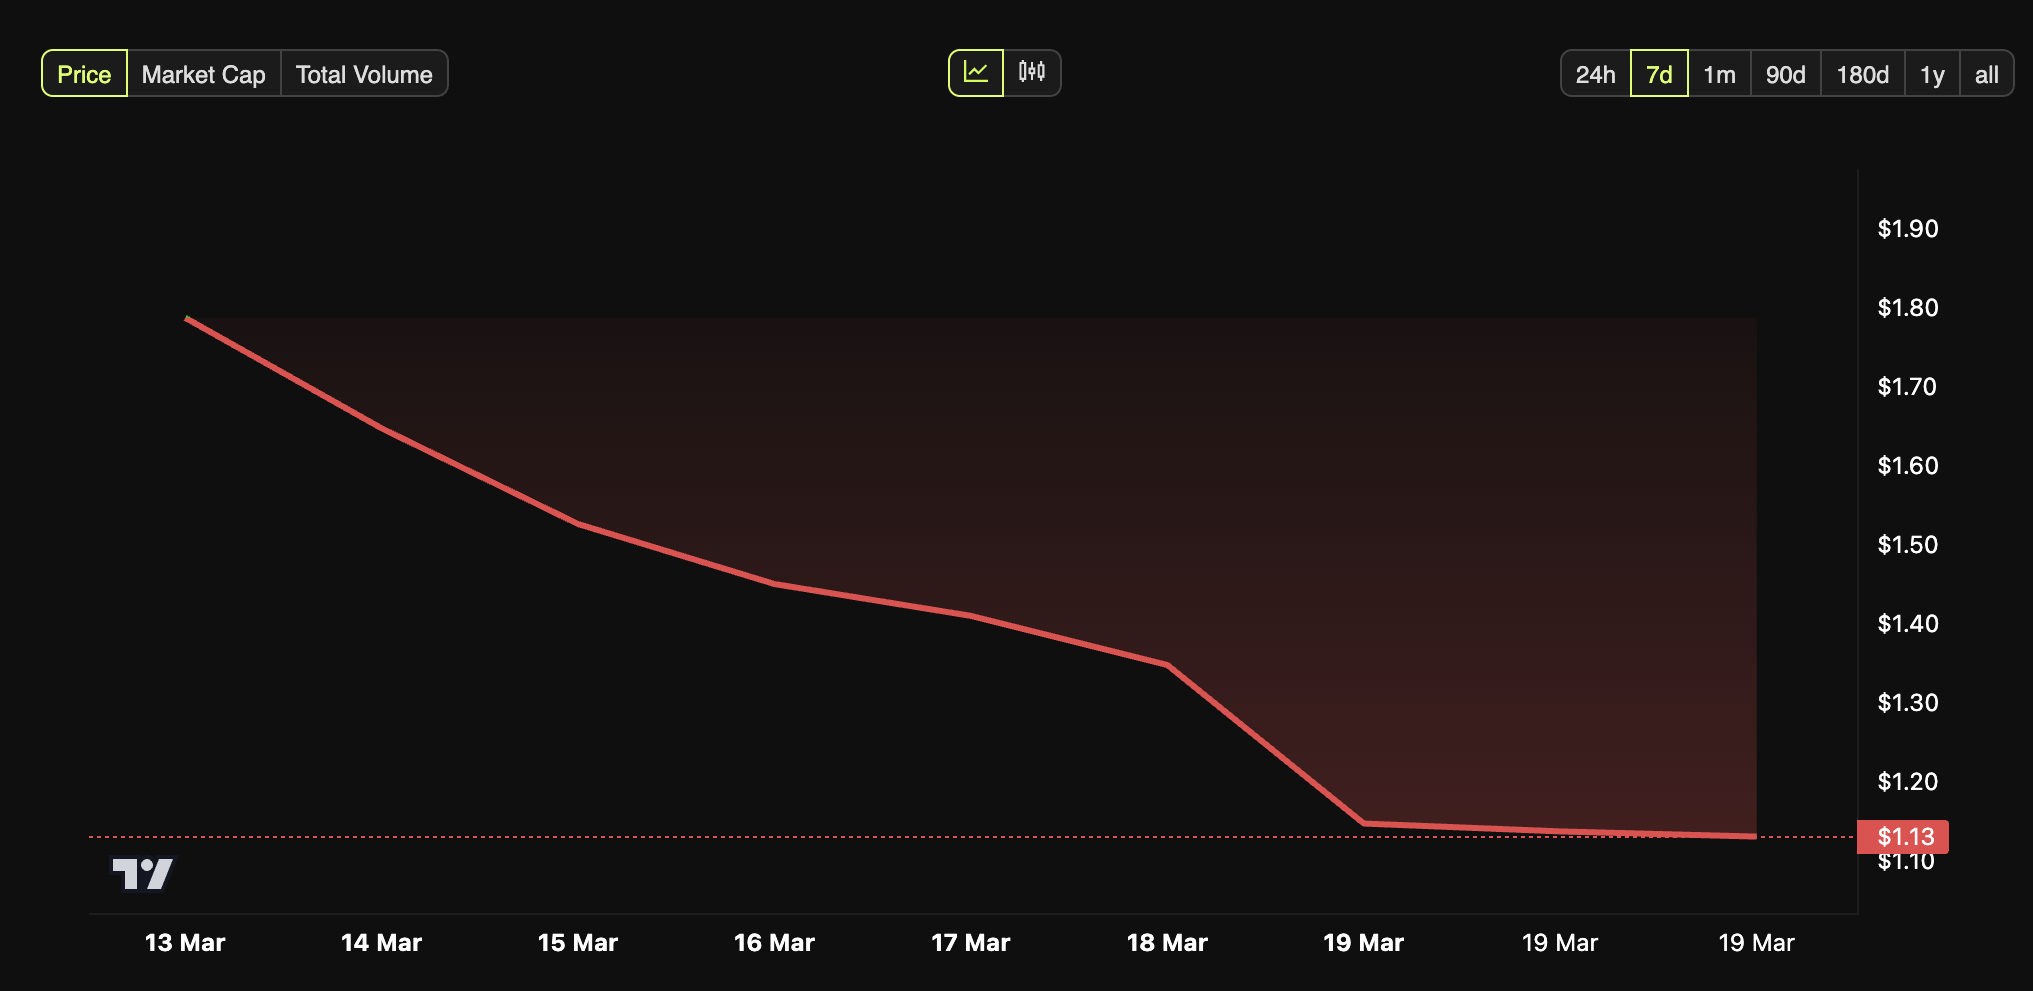
This drop has pushed the coin further down the cryptocurrency rankings, with PI falling from 12th to 21st place on CoinGecko. While the broader cryptocurrency market has also faced a downturn, PI’s losses have been more pronounced. At press time, PI was trading at $1.1, down 16.5% in the past 24 hours.
Despite this, Pi Network’s community engagement remains vibrant, particularly through PiFest 2025. The event has attracted 100,000 registered sellers worldwide, including 49,000 active participants on the Map of Pi.
Social media posts highlight strong participation from communities in Vietnam, Indonesia, and beyond, where users exchange goods and services using PI tokens.