Bitcoin surged back above $105,000 following a dramatic announcement by President Donald Trump confirming a complete ceasefire between Israel and Iran.
Trump declared the 12-day war “officially ended” following a 24-hour dual-stage ceasefire to be initiated first by Iran, then by Israel.
The Market Impact of Iran-Israel Ceasefire
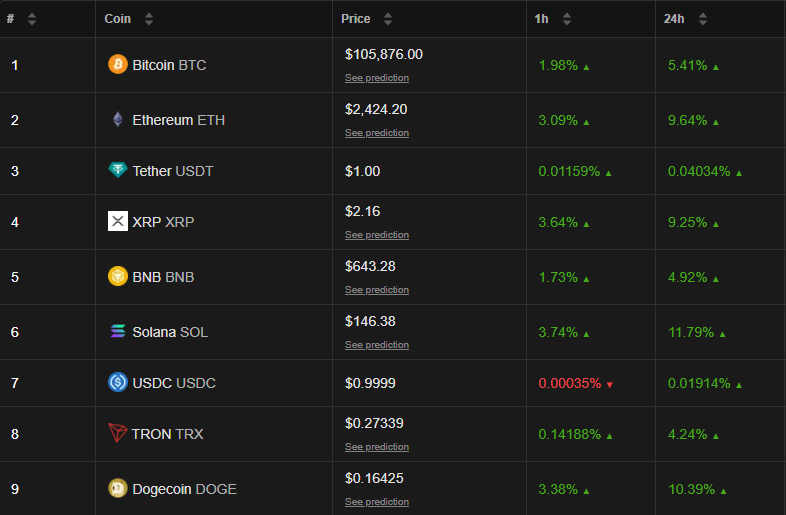
Crypto markets reacted swiftly. Over the weekend, Bitcoin dipped below $100,000 hours earlier amid news of a potential Strait of Hormuz shutdown. Today, BTC rebounded by over 5% on the announcement.
Ethereum also rallied, climbing back above $2,400, while risk sentiment improved across broader digital asset markets.
Crypto Market Rallies After Ceasefire Announcement. Source: BeInCrypto
The ceasefire removed immediate fears of further military escalation and global oil disruption. Also, the de-escalation was widely anticipated, as oil prices began to drop earlier despite Iran targeting US bases in Qatar.
Earlier in the day, Iran’s parliament approved a proposal to shut the Strait of Hormuz, which handles 25% of global oil shipments.
Had that closure gone into effect, it would have sharply driven up oil prices, potentially reigniting inflation and delaying central bank rate cuts.
Instead, the ceasefire has reduced energy market pressure and restored some degree of geopolitical stability, prompting capital to flow back into risk assets.
Trump Ceasefire Announcement in Iran-Israel War. Source: Truth Social
Markets will closely watch whether both sides adhere to the 24-hour ceasefire protocol and if the Strait of Hormuz remains open.
If the truce holds, macroeconomic stability may return quickly, boosting both equities and crypto. However, any breaches or renewed tension could send Bitcoin back into risk-off territory.
HBAR has seen a notable uptick in recent days, showing signs of recovery after the significant losses recorded in March. If this momentum continues, the cryptocurrency could soon make a comeback, potentially pushing its price higher.
HBAR’s positive movement in April provides hope that it may avoid repeating past patterns of sharp declines, offering a chance for sustained growth in the coming weeks.
Hedera Is Observing A Strong Bullish Momentum
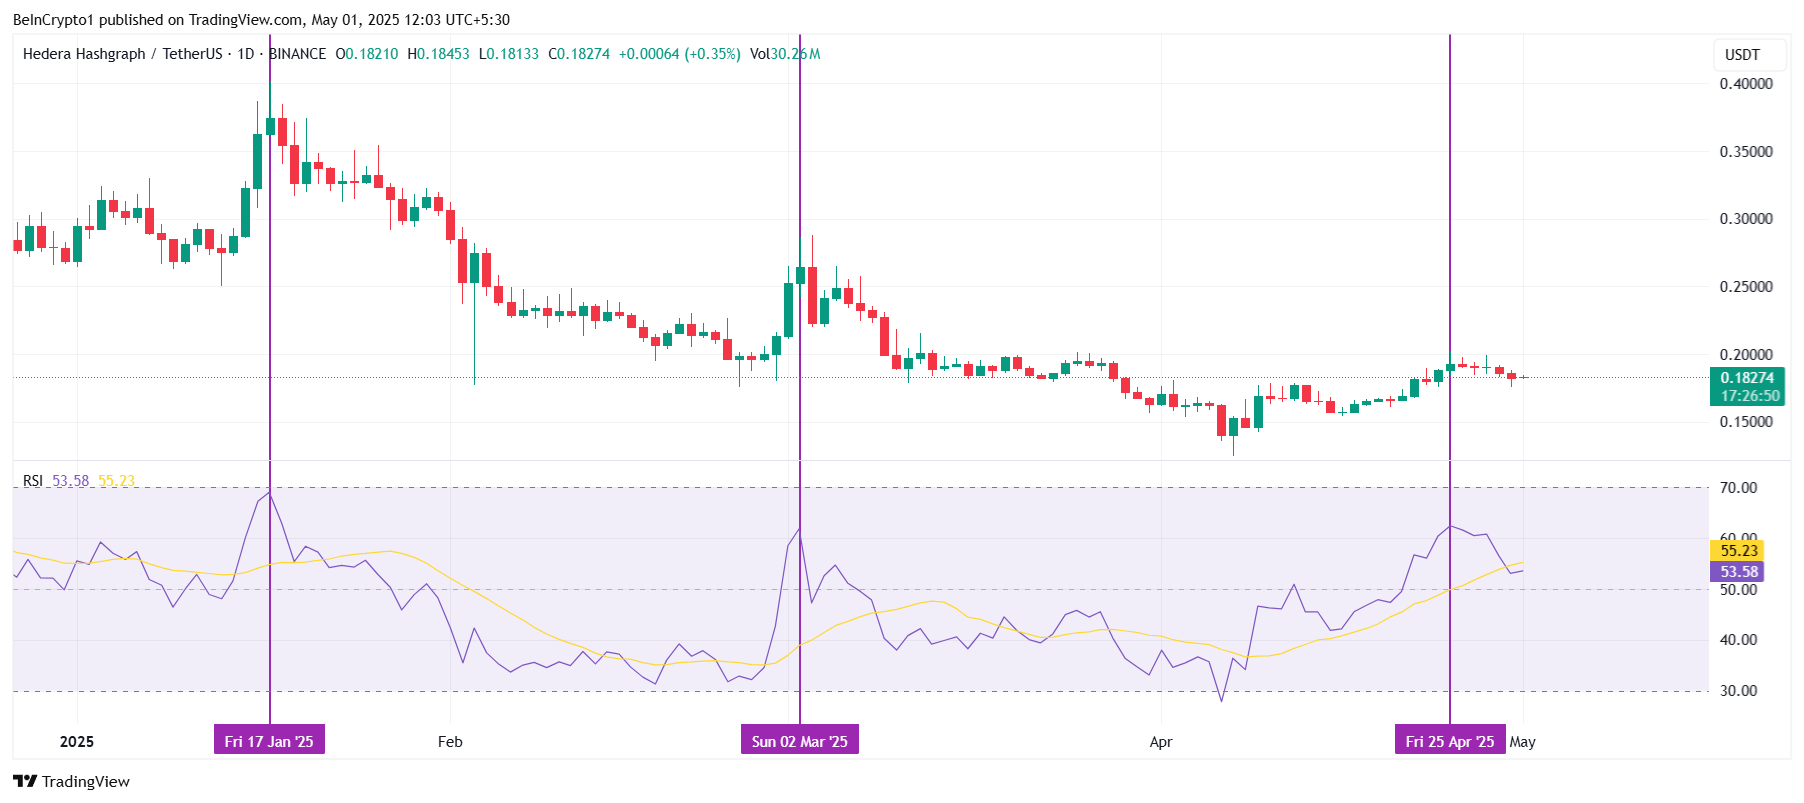
The Relative Strength Index (RSI) for HBAR is currently above the neutral mark at 50.0, which indicates positive market sentiment. This is generally seen as a bullish signal. However, historical instances show that HBAR has experienced corrections following sharp rises in the RSI, driven by volatile price movements.
This time, however, the market’s volatility appears to be much lower, suggesting that the current bullish momentum for HBAR is more organic. If the RSI remains steady in the positive zone, it could signal a more sustainable rally for the cryptocurrency.
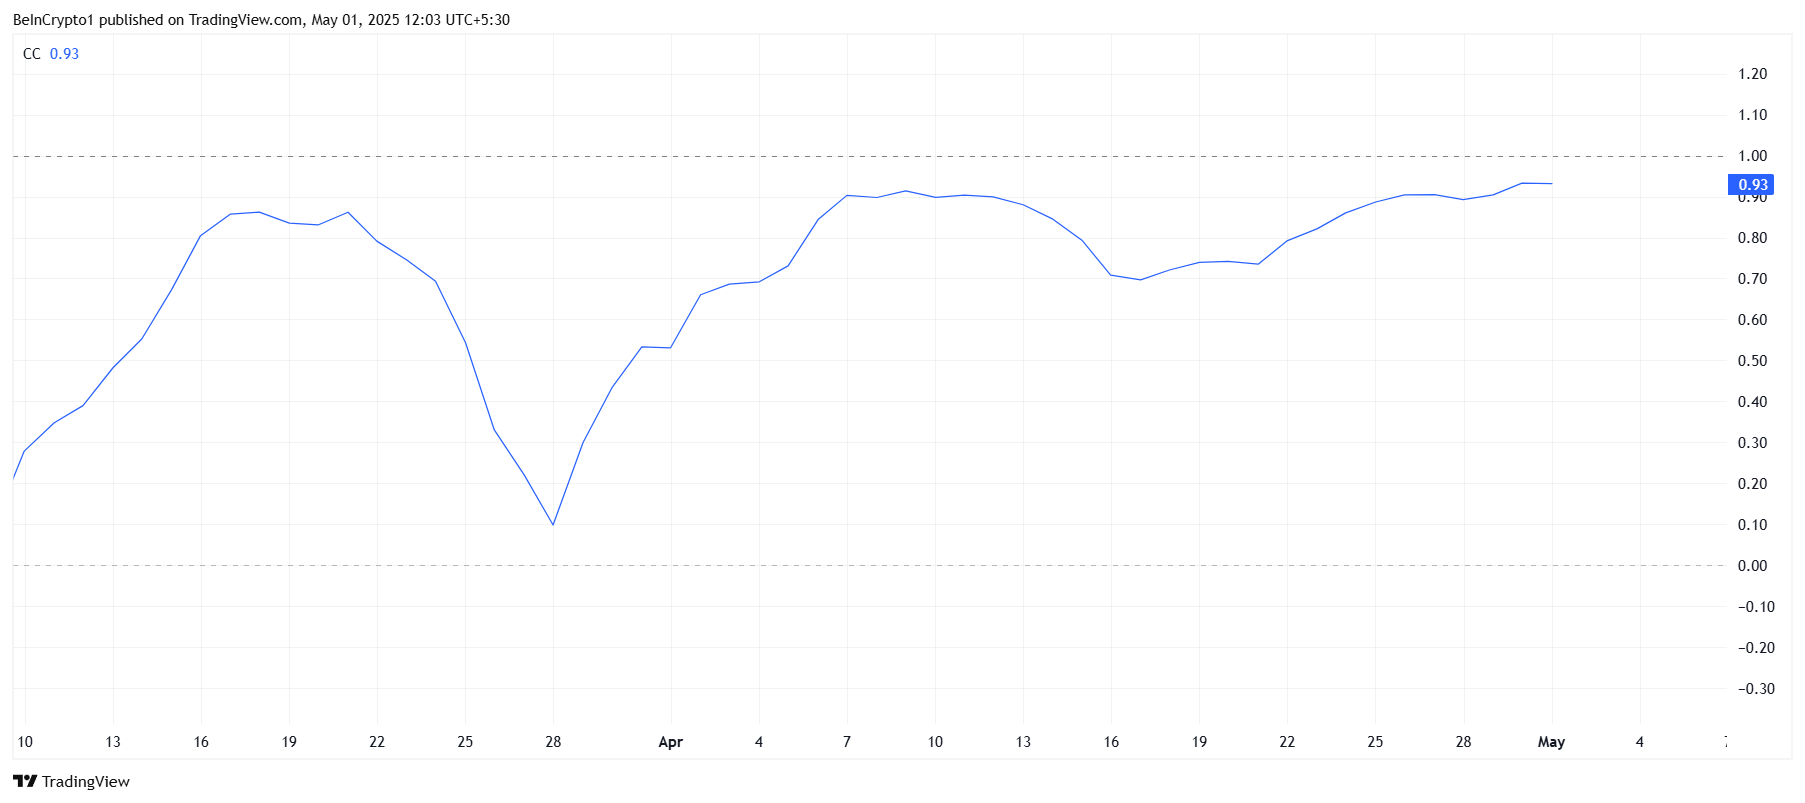
HBAR’s performance also seems closely tied to Bitcoin’s price action, with a strong correlation of 0.93 between the two. As Bitcoin continues to rise, currently approaching $95,000, HBAR is likely to follow suit.
Given Bitcoin’s strong market position, any further gains for the leading cryptocurrency will likely spill over into altcoins like HBAR. If Bitcoin continues its bullish path, pushing past key resistance levels, HBAR could see similar gains, propelled by the overall market optimism and BTC’s positive influence.
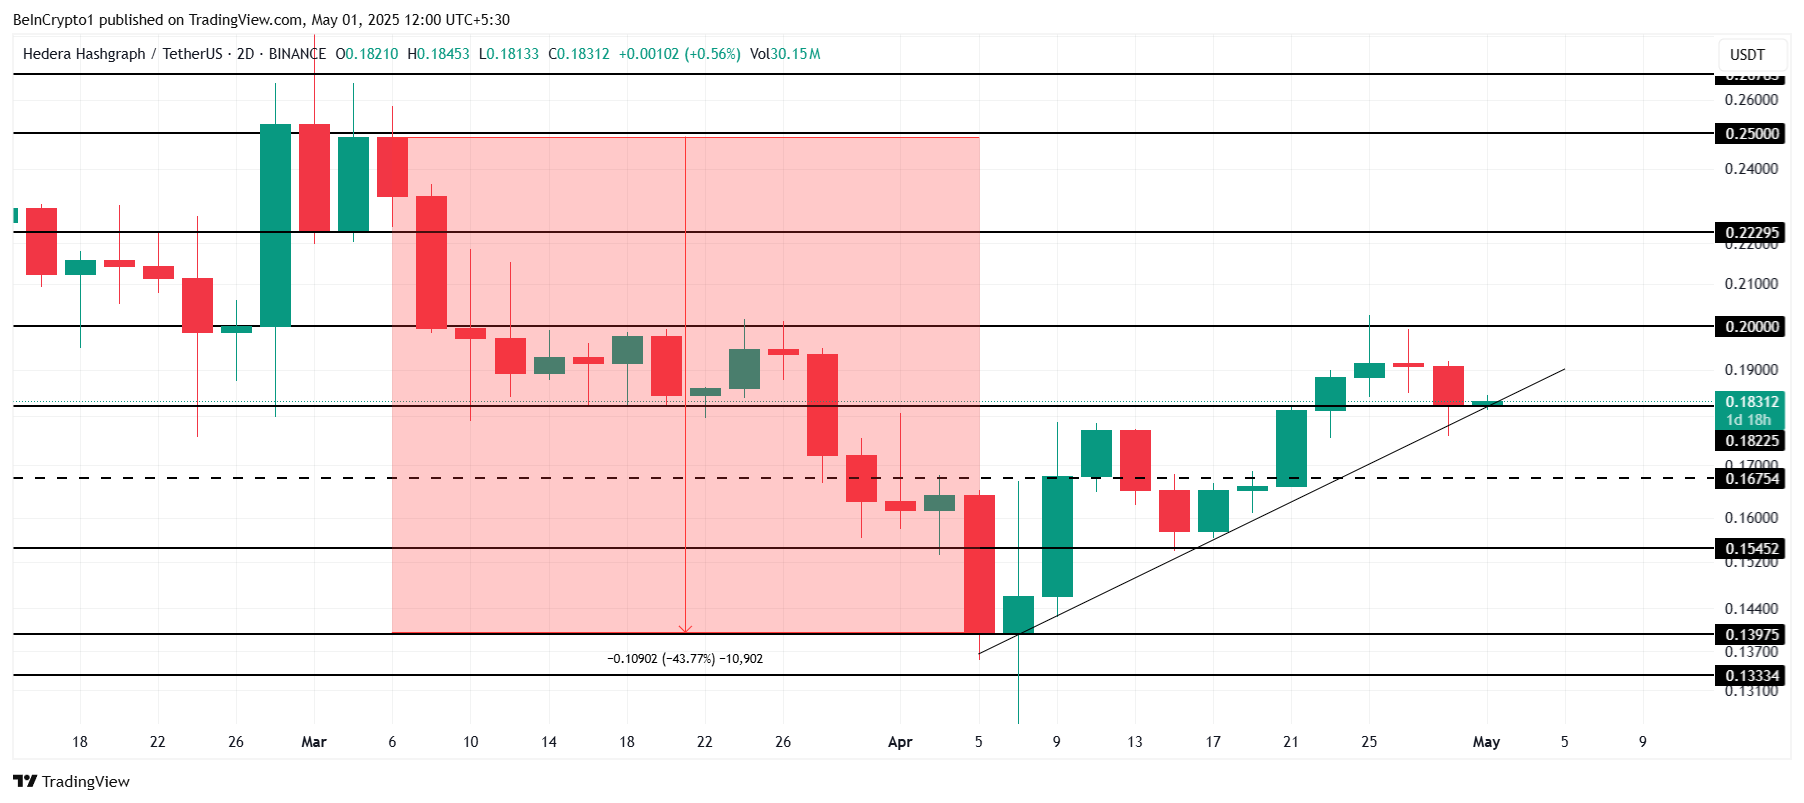
Throughout April, HBAR has maintained an uptrend, which is crucial for its recovery from the 43% losses seen in March. The price action in April will be a pivotal factor for HBAR as it looks to regain lost ground. Maintaining this upward trajectory is essential for the altcoin to recover and build on its current momentum.
Currently trading at $0.183, HBAR is aiming to break the key resistance level of $0.200. This level represents a psychological barrier for investors, and successfully flipping it into support could trigger further bullish reactions. If this happens, HBAR could see a rise to $0.222 as investor confidence strengthens and more market participants enter the space.
However, if HBAR fails to breach the $0.200 mark, it could face a decline to $0.167. If this happens, further selling pressure from investors looking to minimize losses could push the price down to $0.154. Such a drop would invalidate the short-term bullish outlook, potentially leading to more significant losses if the market sentiment turns bearish.
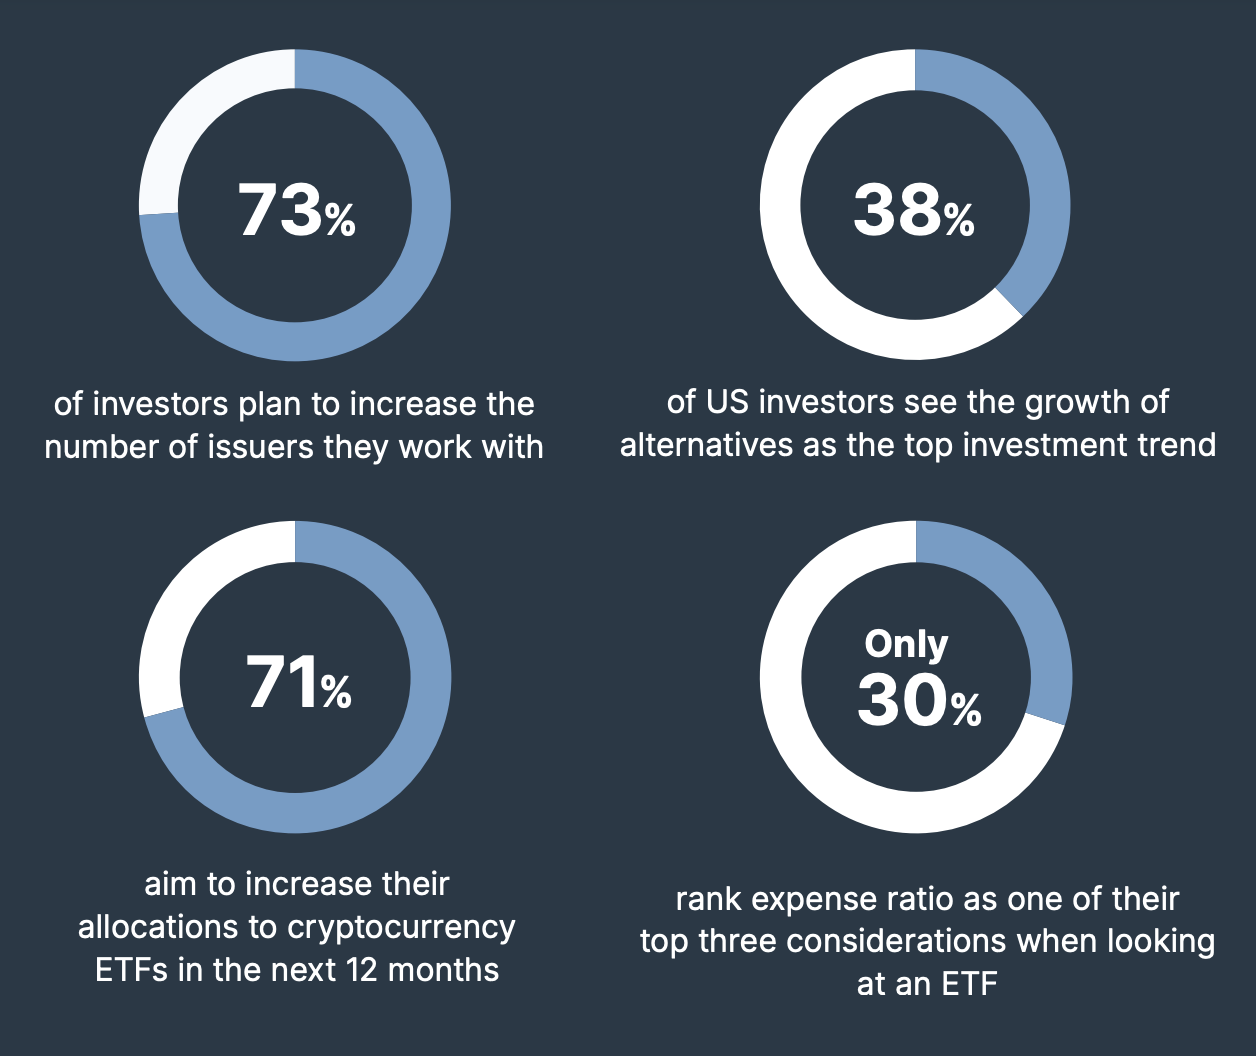
According to a recent survey by Brown Brothers Harriman, 71% of ETF investors wish to invest more in crypto this year. This bullish signal comes as the crypto ETF market is beginning to recover from recent volatility.
The firm is one of the oldest and most prestigious investment banks in the US, adding credibility to its claims. This data also aligns with other surveys that suggest wealthy investors are interested in Bitcoin.
Crypto ETFs Are Becoming Popular Among TradFi Investors
According to a new survey from Brown Brothers Harriman, 71% of ETF investors are planning to further their allocations into crypto.
“Good news for the crypto crowd, 71% [of surveyed investors] said they aim to increase their allocation to crypto ETFs in the next 12 months.. That’s higher than I would have thought, I’d have guessed 40-50% and i’m pretty bullish on this space, relatively speaking,” claimed Eric Balchunas, a prominent ETF analyst.
Brown Brothers Harriman is one of the oldest and most prestigious investment banks in the US, and its survey is a credible indicator of ETF sentiment. Additionally, other recent surveys have drawn similar conclusions.
Meanwhile, Bitcoin ETFs have largely recovered this week after seeing net outflow for five consecutive weeks. At the same time, more asset managers are filing diverse ETF applications with the SEC. Given the current positive sentiment among institutional investors, the long-term outlook is likely to be bullish for such funds.
In crypto trading, the promise of massive gains often comes with the risk of heavy losses. Over the years, several high-profile crypto traders have made headlines for their bold bets, only to see their fortunes crumble when the market turned against them.
From Bitcoin (BTC) to Ethereum (ETH), the crypto market has proven to be a double-edged sword. Millions can be made or lost in just hours, and traders are left to deal with the fallout from their high-risk moves. Here are the stories of three crypto traders who wiped out millions:
James Wynn
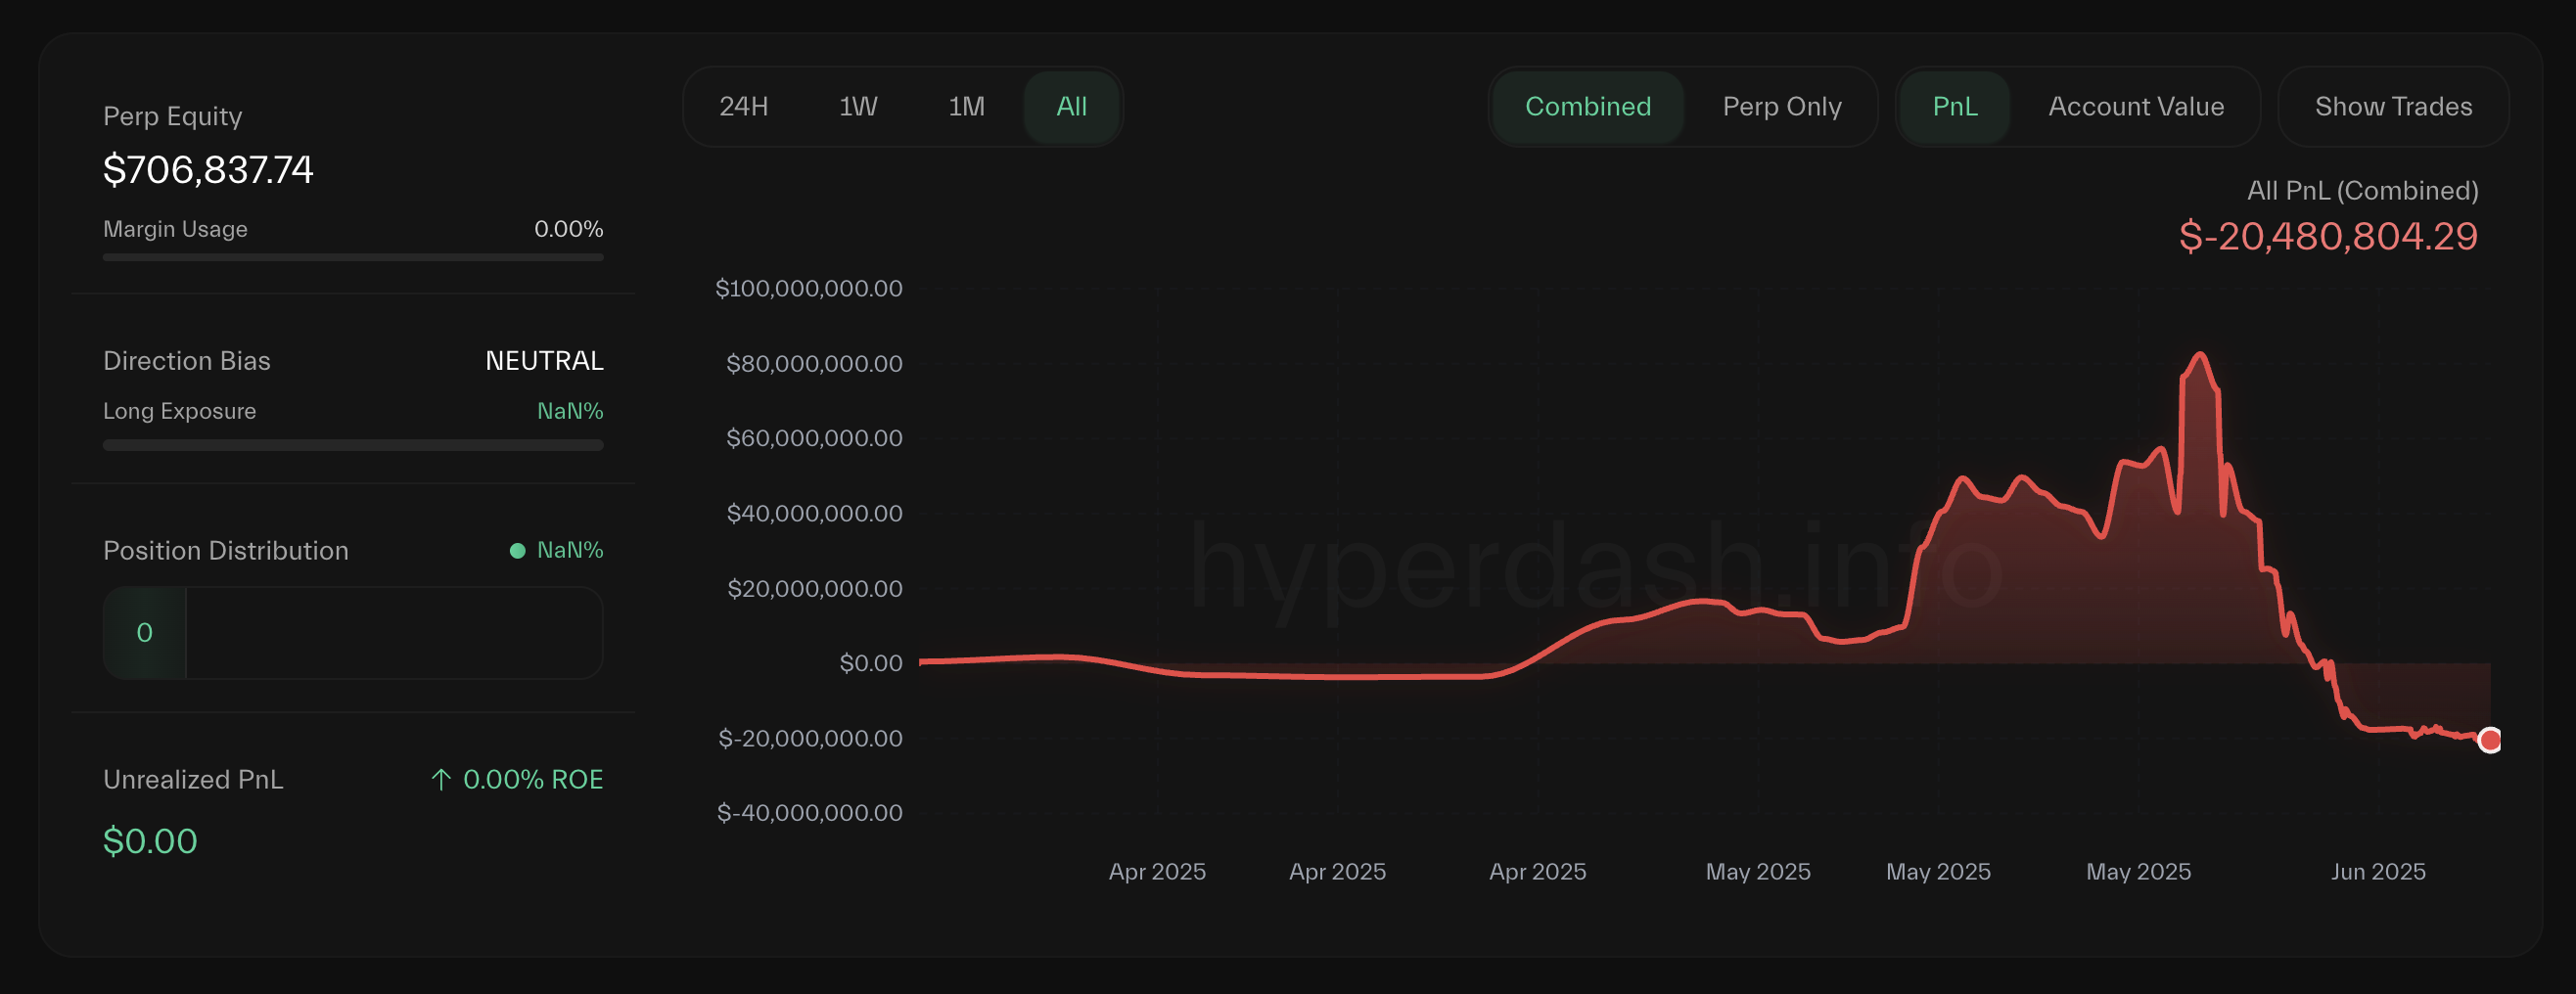
James Wynn, a pseudonymous trader on Hyperliquid, has become one of the most discussed figures on crypto Twitter (now X) due to his high-risk, high-reward trading style.
“Since I began trading this year on HyperLiquid I have made a total profit of $41,696,589.75 (on-chain). Next goal is $1bn. Not for the money. But for the legacy. Unlikely I’ll do it this cycle unless I went max degen on shorting the top, which I’m probably the only person with this kind of wealth who’s willing to turn it up on 40x leverage and put a significant % on the line,” Wynn said on May 9.
The trader had several successful trades. On May 24, he booked a $25.18 million profit from a long position in kPEPE and $16.89 million from a long Bitcoin position. Other notable trades included a $4.84 million profit from Fartcoin (FARTCOIN) on May 13 and a $6.83 million profit from Official Trump (TRUMP) on May 12.
Wynn’s profits peaked at over $87 million in late May. However, this was short-lived, as the trades began to backfire soon after. Wynn faced a series of significant setbacks.
On May 23, he lost $3.69 million from a long Ethereum position and $1.59 million from a Sui (SUI) long position. Two days later, on May 25, he suffered a $15.86 million loss from a short position in BTC.
“James Wynn has wiped out almost all his profits on Hyperliquid. It took him 70 days to go from 0 to $87 million+ in profit, and only 5 days to lose almost all the $87 million+ in profit,” Lookonchain posted on May 28.
Despite losing it all, Wynn’s bets continued. The largest blow came on May 30, when a long BTC position resulted in a loss of $37.41 million. Wynn’s losses extended into May 31, with an additional $1.20 million lost from another BTC long position.
At the time of writing, Wynn’s performance showed a win rate of 40.48%, with 17 successful trades out of 42.
Anonymous ETH Whale
Wynn’s downfall is part of a larger trend, with other crypto traders also losing millions. In March 2025, an anonymous cryptocurrency trader, identified by the wallet address 0xf3F496C9486BE5924a93D67e98298733Bb47057c, suffered a staggering $308 million loss after a 50x leveraged long position on ETH was liquidated.
The trader had opened the position when ETH was trading at $1,900, with a liquidation price of $1,877. However, amid heightened market volatility driven by global tariff concerns, ETH’s price plummeted, liquidating 160,234 ETH.
An Anonymous Trader’s 160,234 ETH Liquidation. Source: Hypurrscan
Lookonchain reported that the whale had rotated all their Bitcoin holdings into this leveraged ETH trade, amplifying the risk.
“Crazy! This whale has switched all of his long BTC positions to long ETH,” the post read.
Leveraged trading, which uses borrowed funds to magnify both gains and losses, proved disastrous in this case, as a small price movement wiped out the trader’s entire position.
While leveraged bets have led to massive financial losses, they have also tragically resulted in the loss of life. In June 2019, Hui Yi, the co-founder and CEO of the cryptocurrency market analysis platform BTE.TOP reportedly took his own life.
Yi’s distress was believed to be caused by his involvement in a failed 100x leveraged short position on 2,000 Bitcoins. The extreme leverage amplified his losses, making his position highly vulnerable to even minor price fluctuations.
There was also speculation that the 2,000 Bitcoins might have belonged to clients. Some even suggested that Yi may have faked his death to avoid repayment. However, no evidence supported these theories.
An ex-partner confirmed Yi’s death. This tragic incident highlighted the psychological toll of leveraged trading and the dangers of using excessive borrowed funds in the volatile crypto market.