Coinbase’s Layer 2 network, Base, is facing intense scrutiny after what appears to be a major pump and dump—one that it inadvertently helped fuel. The project’s official Twitter account publicly promoted a meme coin titled “Base is for everyone.”
This triggered a speculative surge, driving the token’s market cap to an estimated $15 to $20 million within hours of launch. The token quickly plummeted near zero in mutes.
Did Base Just Help Fuel a Pump and Dump?
Base’s tweet, which featured promotional imagery and direct links to the meme coin on Zora, created the perception of legitimacy.
Traders piled in, and price charts reflected an explosive rally—followed by an equally sharp collapse.
Within one 4-hour trading window, a green candle representing millions in inflow was immediately reversed by a red candle of equal size, marking a total loss of liquidity and confirming a textbook pump and dump.
The token’s value fell by more than 99%, and trading volumes on Uniswap surged past $13 million during the brief window of activity.
base just had a major rug pull, here’s what went down
what happened
→ official base twitter promoted memecoin “base is for everyone” → immediate speculative frenzy, token pumped from launch to ~$15-20m mc → liquidity pulled, token instantly collapsed to near-zero within… pic.twitter.com/rQzgCg59Z3
There is massive ongoing outrage against both Coinbase and Base. Crypto influencers have called the incident a failure of due diligence and communications strategy.
Accusations of incompetence and poor risk oversight are spreading fast on social media, while memes mocking the network’s “Base is for everyone” slogan are everywhere.
Base is yet to provide an official response to the incident.
Core Scientific (CORZ), Robinhood Markets (HOOD), and Strategy Incorporated (MSTR) are drawing attention today. CORZ rose after appointing Elizabeth Crain to its Board and reinforcing its shift toward AI infrastructure.
HOOD confirmed a $250 million CAD acquisition of WonderFi, expanding into Canada and going head-to-head with Wealthsimple. MSTR bought 7,390 BTC for $765 million, raising its total holdings to over 576,000 BTC, while facing a class-action lawsuit over its Bitcoin-focused strategy.
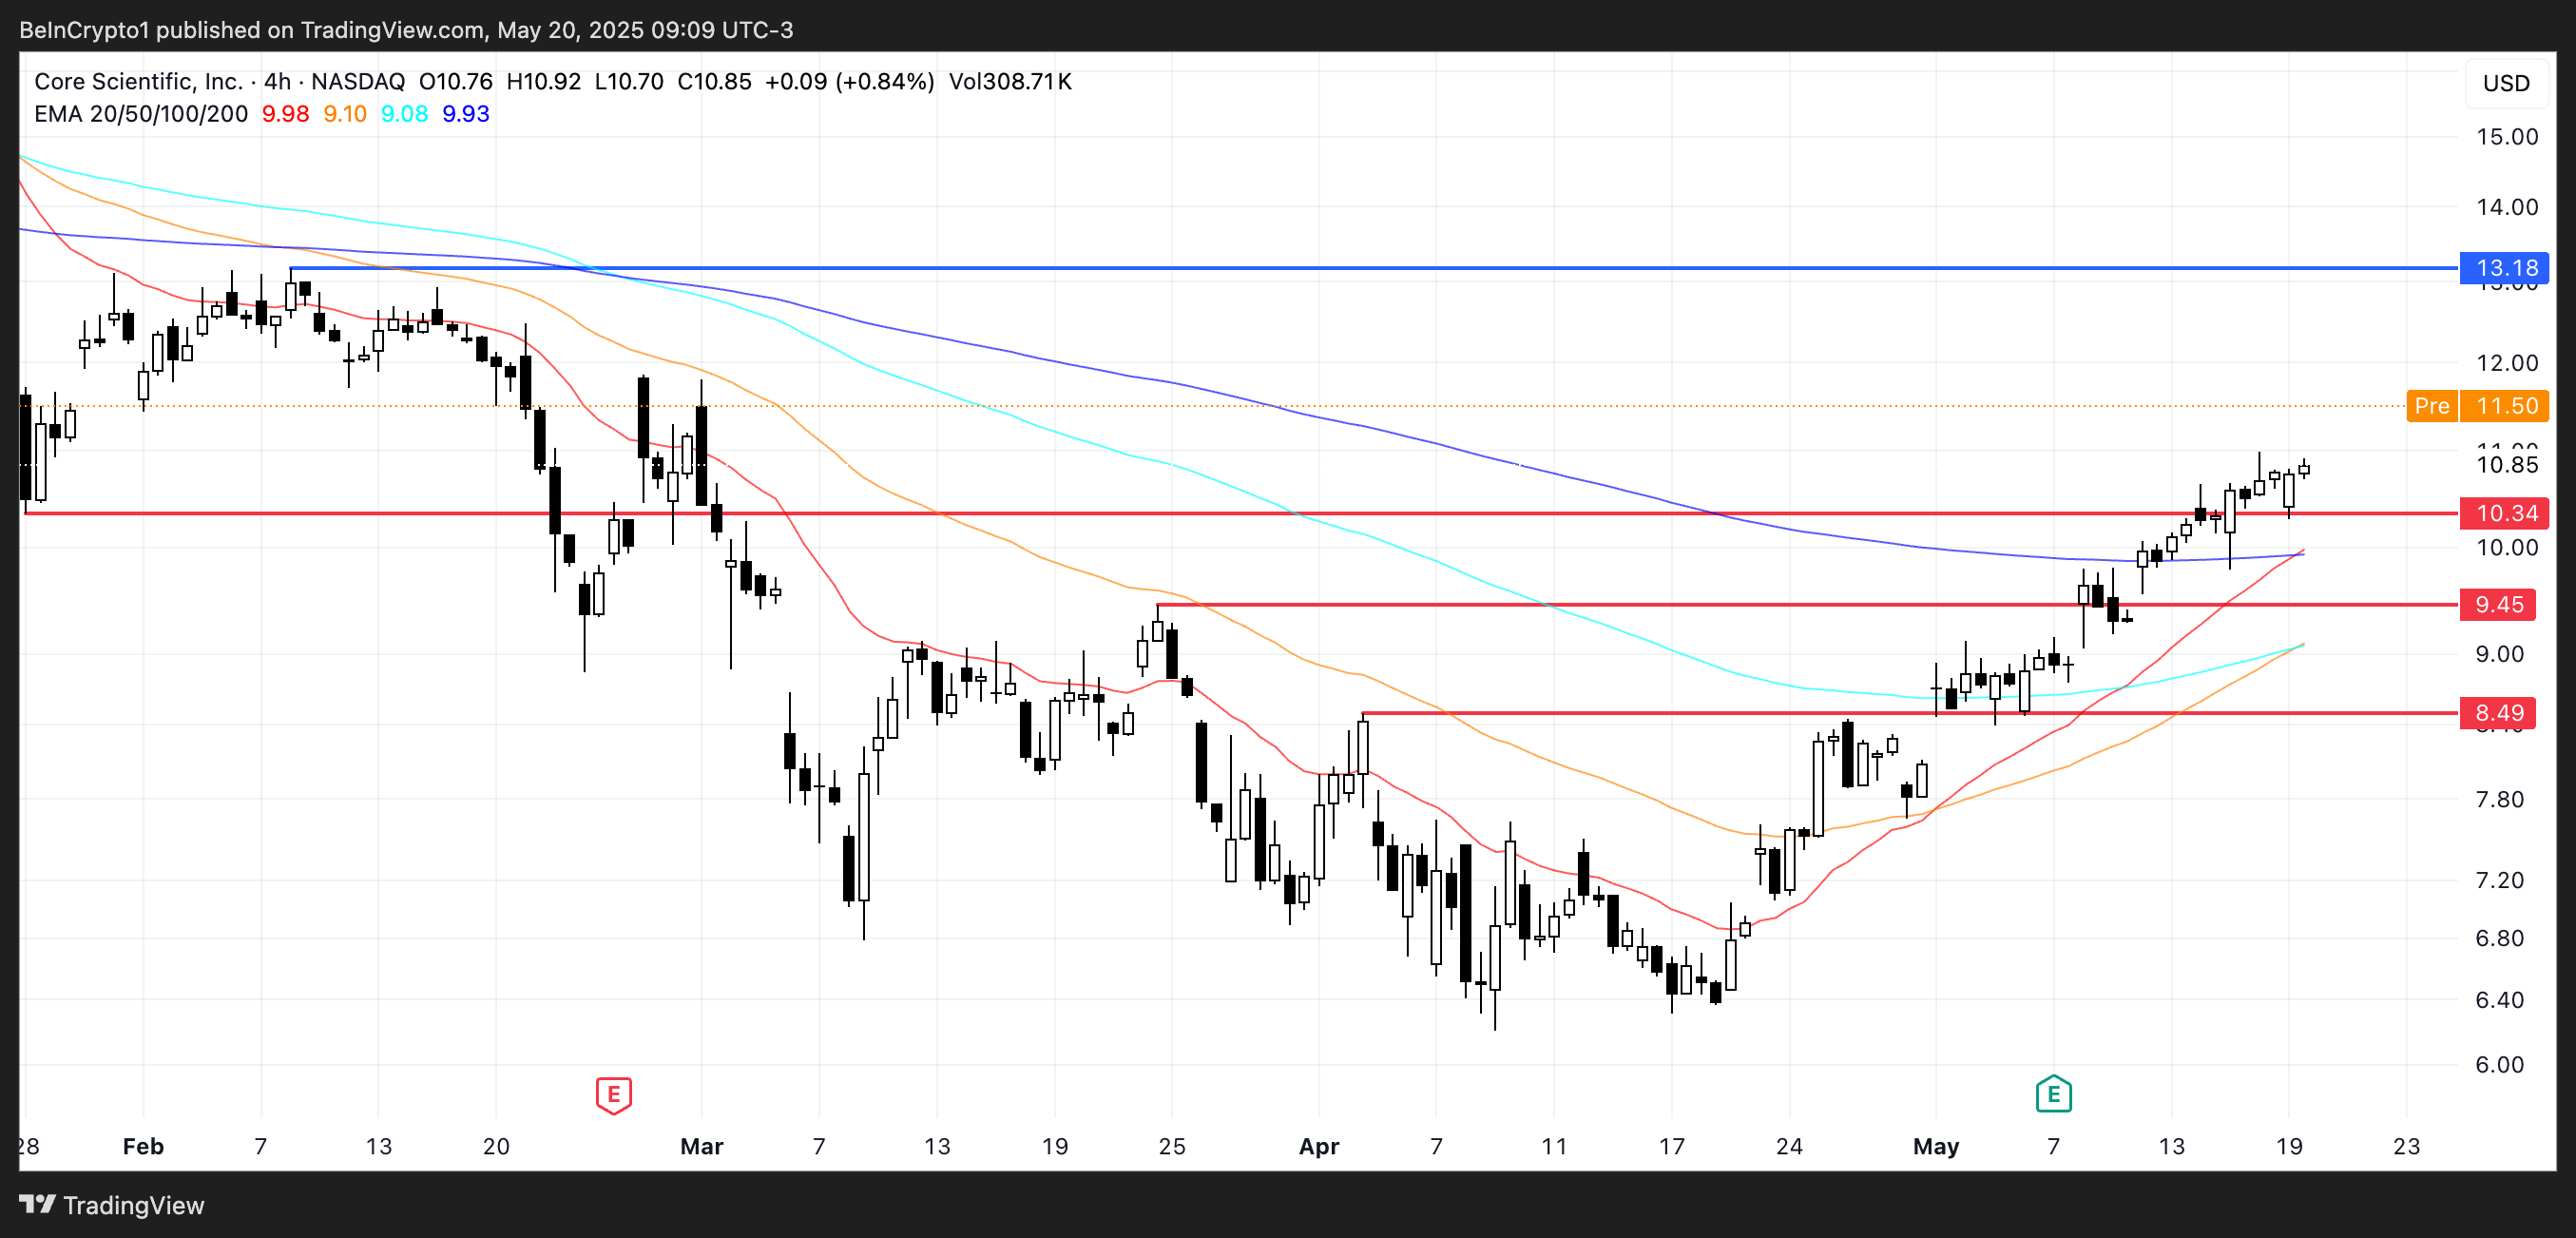
Core Scientific (CORZ)
Core Scientific (CORZ) closed yesterday with a modest gain of 0.65% and is already up 5% in pre-market trading, following the appointment of Elizabeth Crain to its Board of Directors.
Crain brings over thirty years of experience in investment banking and private equity, having co-founded Moelis & Company and held senior roles at UBS. She will also Chair the Audit Committee, a key position as Core Scientific continues its strategic shift toward AI-related infrastructure.
Her appointment, along with Jordan Levy’s being named Chairman, marks a pivotal moment for the company as it enhances its leadership team amid a broader transition in business focus and operations.
CORZ’s chart shows signs of renewed strength, with a potential golden cross forming on its EMA lines. Analyst sentiment remains overwhelmingly bullish—16 out of 17 analysts rate the stock as either a “Strong Buy” or “Buy,” with a one-year price target averaging $18.28, representing a 68.49% potential upside.
If momentum holds, the next key resistance level is $13.18, which could be tested in the short term.
However, investors should watch for support at $10.34; if it fails, the stock may retrace to $9.45 or even $8.49.
The deal, which offers a 41% premium over WonderFi’s last closing price, will bring WonderFi’s 115-person team and established crypto brands—Bitbuy, Coinsquare, and SmartPay—under Robinhood Crypto’s umbrella.
Robinhood Crypto executive Johann Kerbrat recently emphasized the company’s focus on tokenization and financial accessibility, highlighting how fractionalized assets like real estate can open up previously inaccessible markets to everyday investors.
The company submitted a 42-page proposal to the SEC seeking a federal framework for tokenized real-world assets. It aims to bring traditional financial markets on-chain with legally recognized asset-token equivalence.
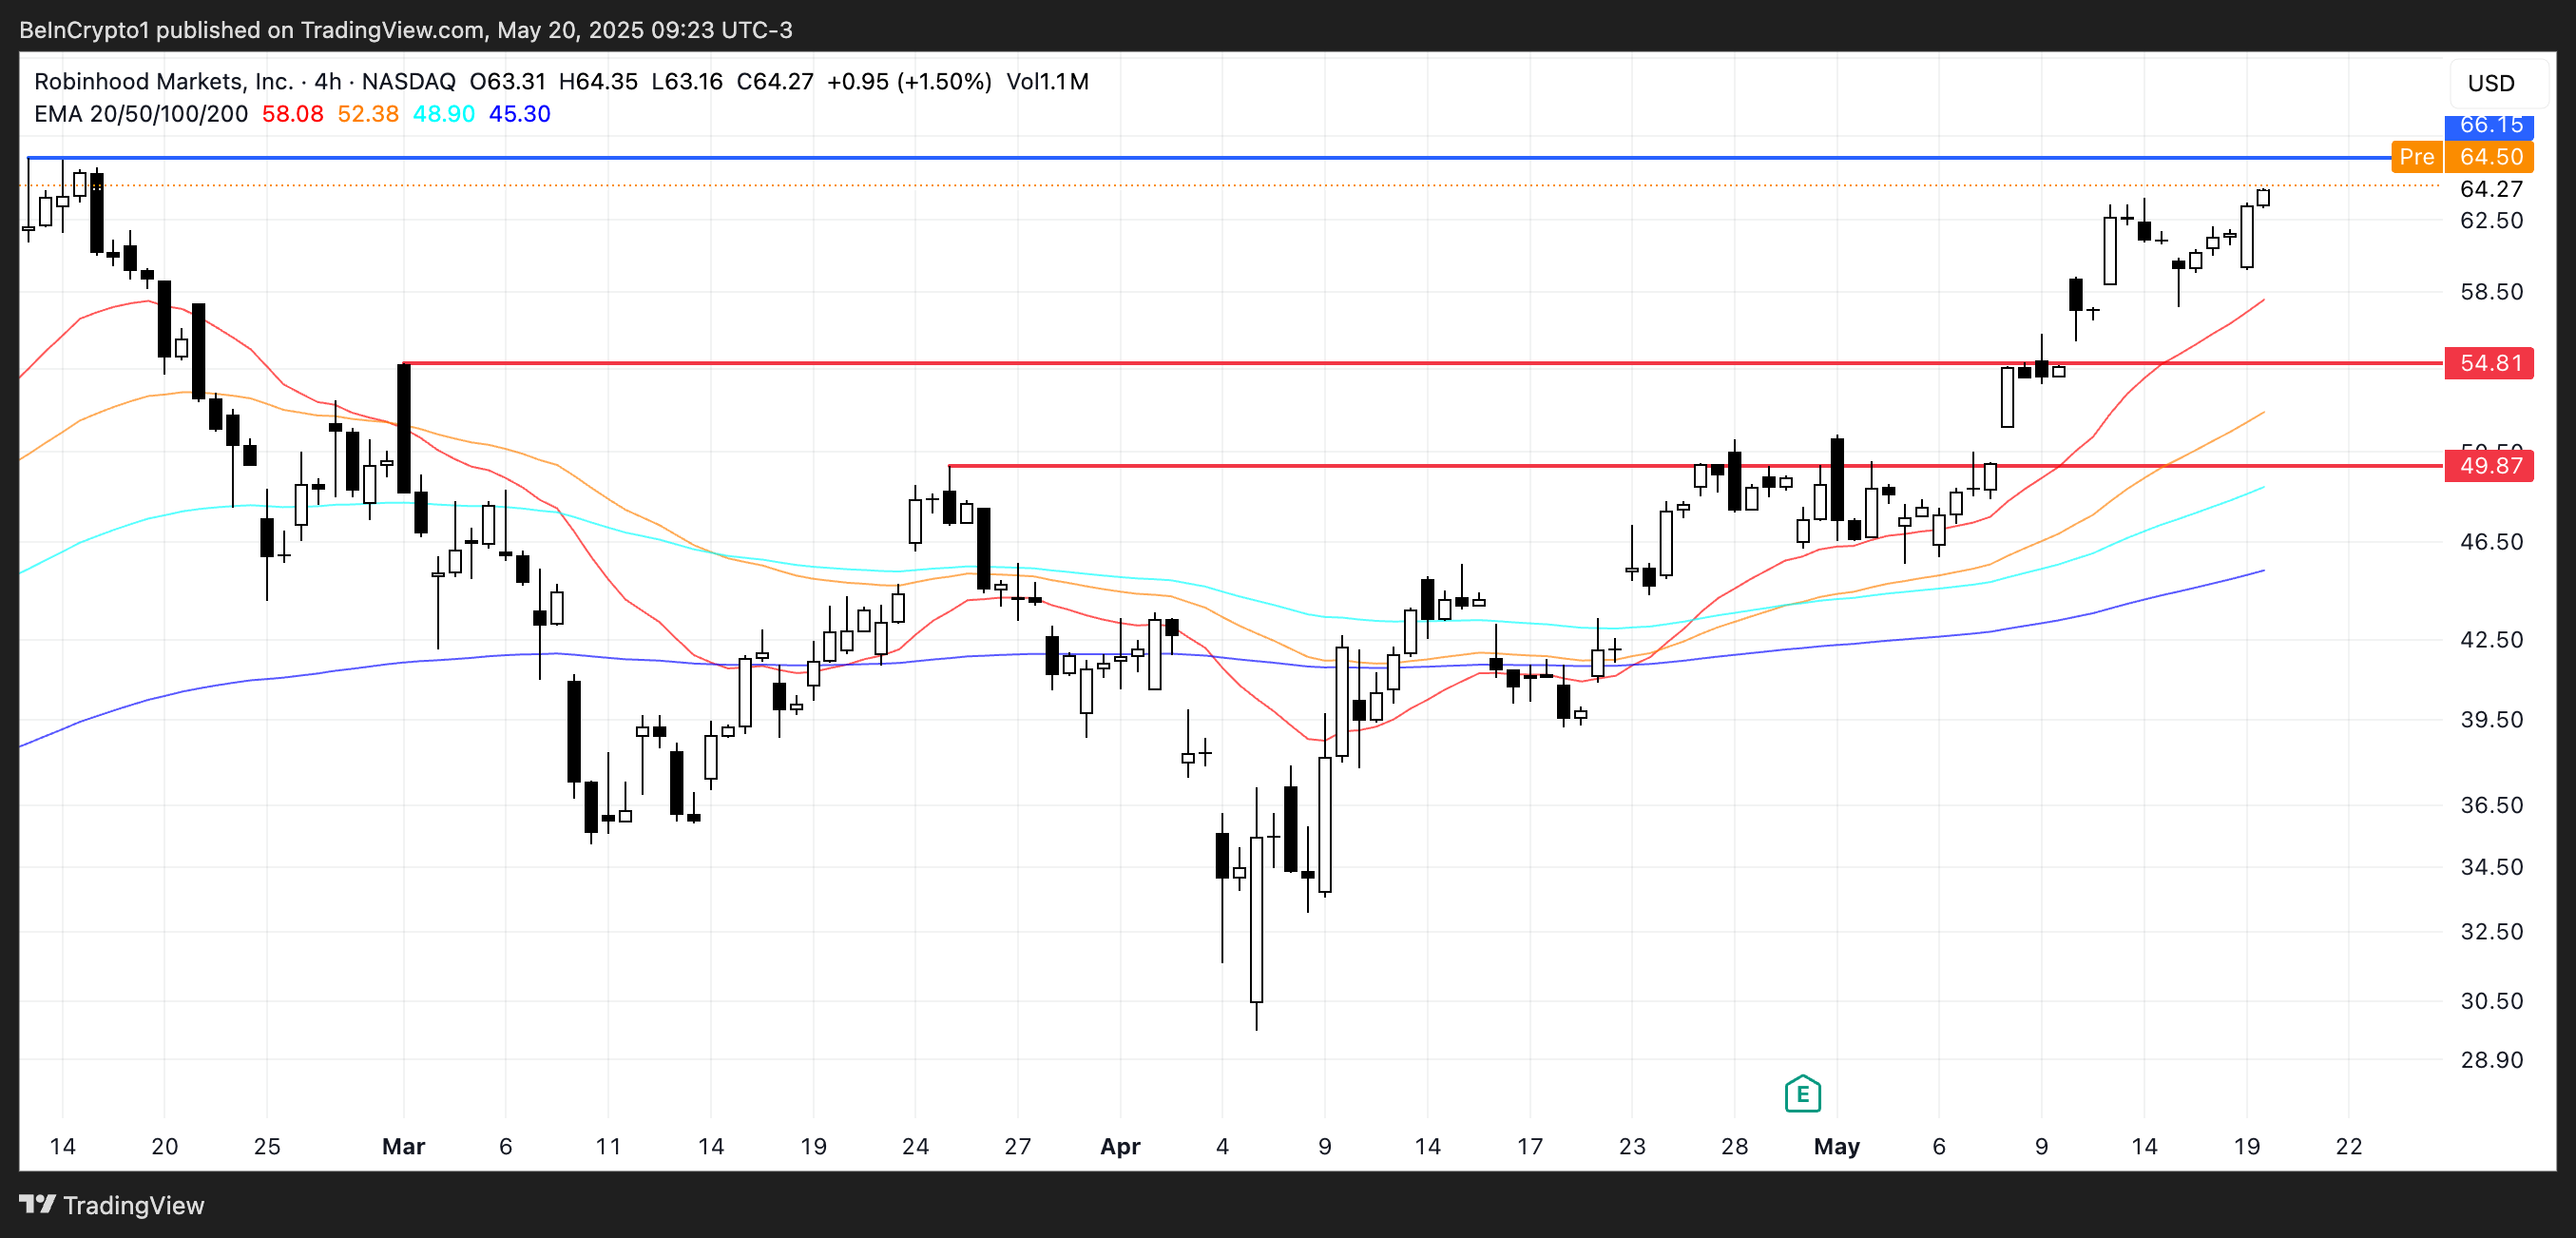
HOOD shares closed up 4% yesterday and are up slightly in pre-market trading, extending a remarkable 56% rally over the past 30 days. Technically, the stock’s chart shows strong momentum, with its short-term EMA lines clearly above the long-term trend—suggesting sustained bullish sentiment.
The next key resistance sits at $66.15; a clean break above that could push HOOD into uncharted territory, surpassing the $70 mark for the first time and establishing new all-time highs.
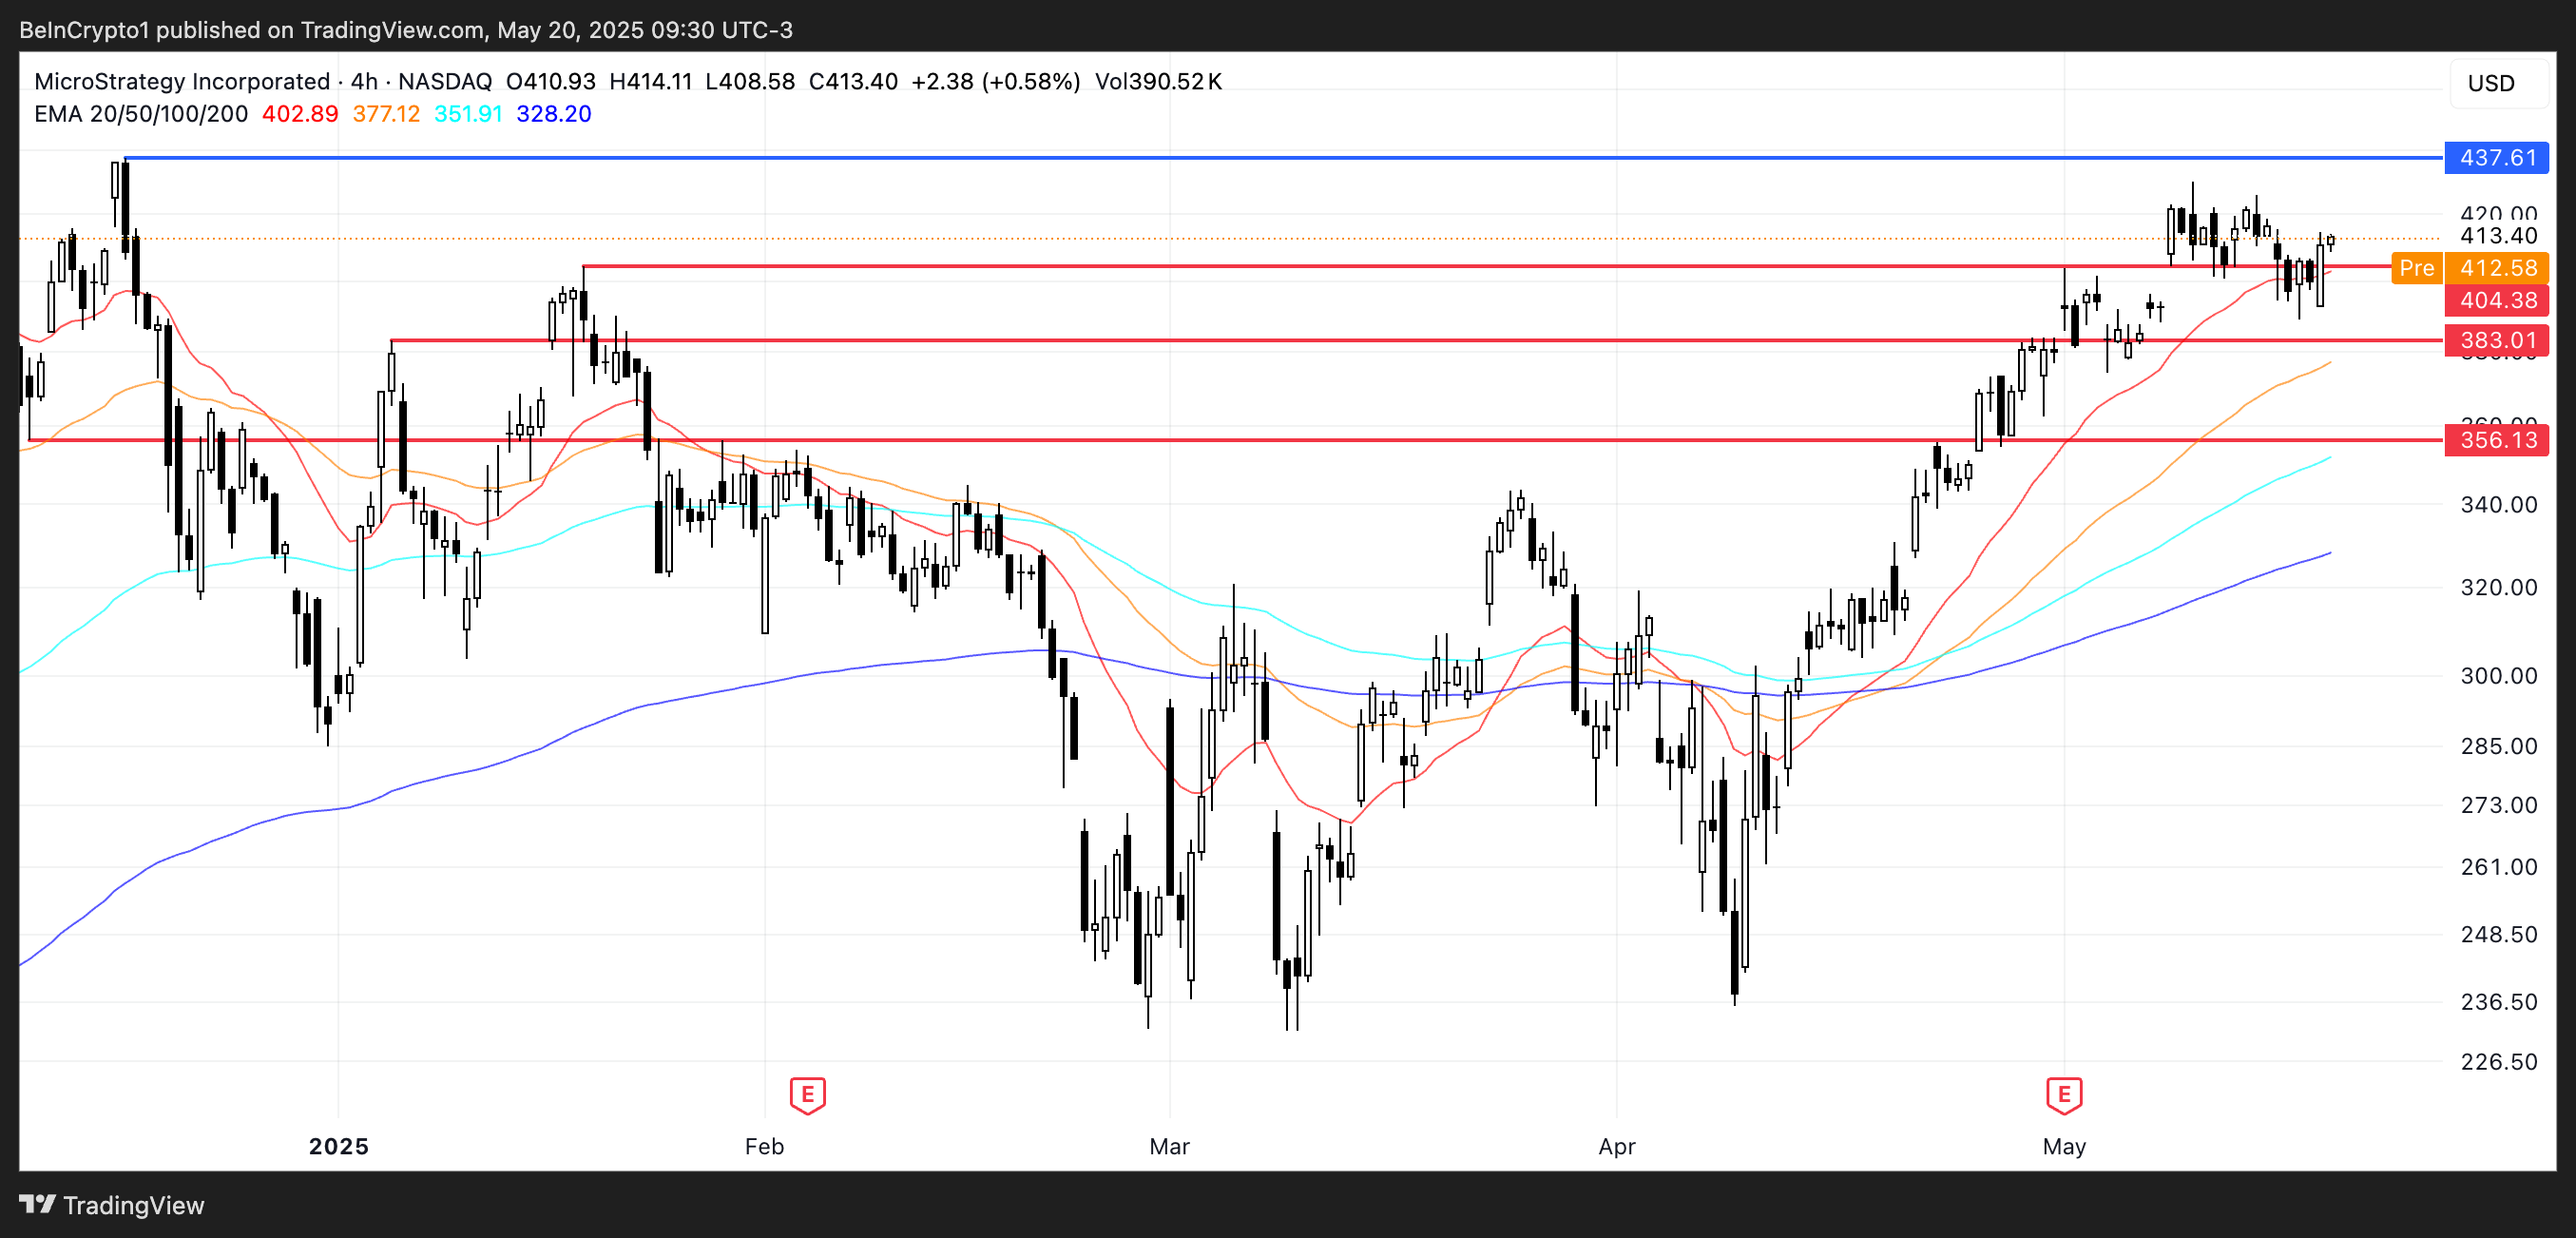
Strategy Incorporated (MSTR)
Strategy (formerly MicroStrategy) has added another 7,390 BTC to its corporate treasury, spending approximately $765 million as Bitcoin traded above $100,000.
This latest accumulation brings its total holdings to 576,230 BTC—acquired for $40.2 billion—now valued at over $59.2 billion, reflecting an unrealized gain of roughly $19.2 billion. However, the aggressive Bitcoin strategy continues to attract scrutiny.
The company and its executives, including Executive Chairman Michael Saylor, have been hit with a class-action lawsuit alleging they misrepresented the risks tied to their Bitcoin-centric investment approach.
Strategy is still the largest corporate holder of Bitcoin, despite legal pressure. Its Bitcoin-first approach has inspired similar treasury strategies in Asia and the Middle East.
MSTR closed yesterday up 3.4% and is down 0.47% in the pre-market. The stock is up nearly 43% in 2025. It is trading near key support at $404; if lost, it could fall to $383.
If momentum returns, MSTR could rise to $437. Analyst sentiment is strong—16 out of 17 rate it a “Strong Buy” or “Buy.” The one-year average price target is $527, implying a 27.5% upside.
The European Central Bank (ECB) cut interest rates by another 25 basis points today, but the crypto market has hardly noticed. This highlights the European market’s declining influence over the crypto sector compared to the US.
Meanwhile, the crypto community is praying for rate cuts in the US, and false tariff rumors caused a massive pump. These policies still matter, but Europe is losing its macro influence.
The ECB Cuts Rates To Crypto Ambivalence
Global recession fears are circulating throughout the crypto market, and regulation plays a key role in them. US investors have been desperate for a rate cut in the hopes that it could provide a bullish narrative.
None has yet materialized. However, the ECB cut interest rates today for the sixth consecutive time, yet the crypto market barely reacted.
“The outlook for growth has deteriorated owing to rising trade tensions. Increased uncertainty is likely to reduce confidence among households and firms, and the adverse and volatile market response to the trade tensions is likely to have a tightening impact on financing conditions,” the ECB said in a public statement.
According to price data, the total crypto market cap has decreased by 0.2% since the ECB announced these rate cuts. Of the top 10 largest assets, all of them posted gains today except one.
These gains came back when the pause actually happened. So, macro influence is still very strong in the current markets; it’s specifically that the ECB and Europe are losing influence.
The European Union isn’t the only economic bloc that’s losing its power in the space. Yesterday, the British government announced that inflation was lower than expected, potentially enabling another rate cut.
This, too, had a negligible impact on crypto. Macroeconomic concerns still impact the crypto market, but its strongest links are to the US and Asia.
It’s still the world’s largest stablecoin despite losing out on the entire European market. In fact, since then, it has taken steps to better integrate with US regulations.
Tether relocated to El Salvador, giving it close proximity to the US and easier access to the Latin American market. This growth area is apparently more fruitful than trying again in Europe.
The ECB’s rate cuts barely impacted the crypto market, but that doesn’t mean that the industry will ignore the whole continent. Moving forward, however, EU operations will matter less and less to the largest companies.
This mirrors broader trends, as international capital is refocusing away from Europe. It’s only natural that crypto is part of that pattern.
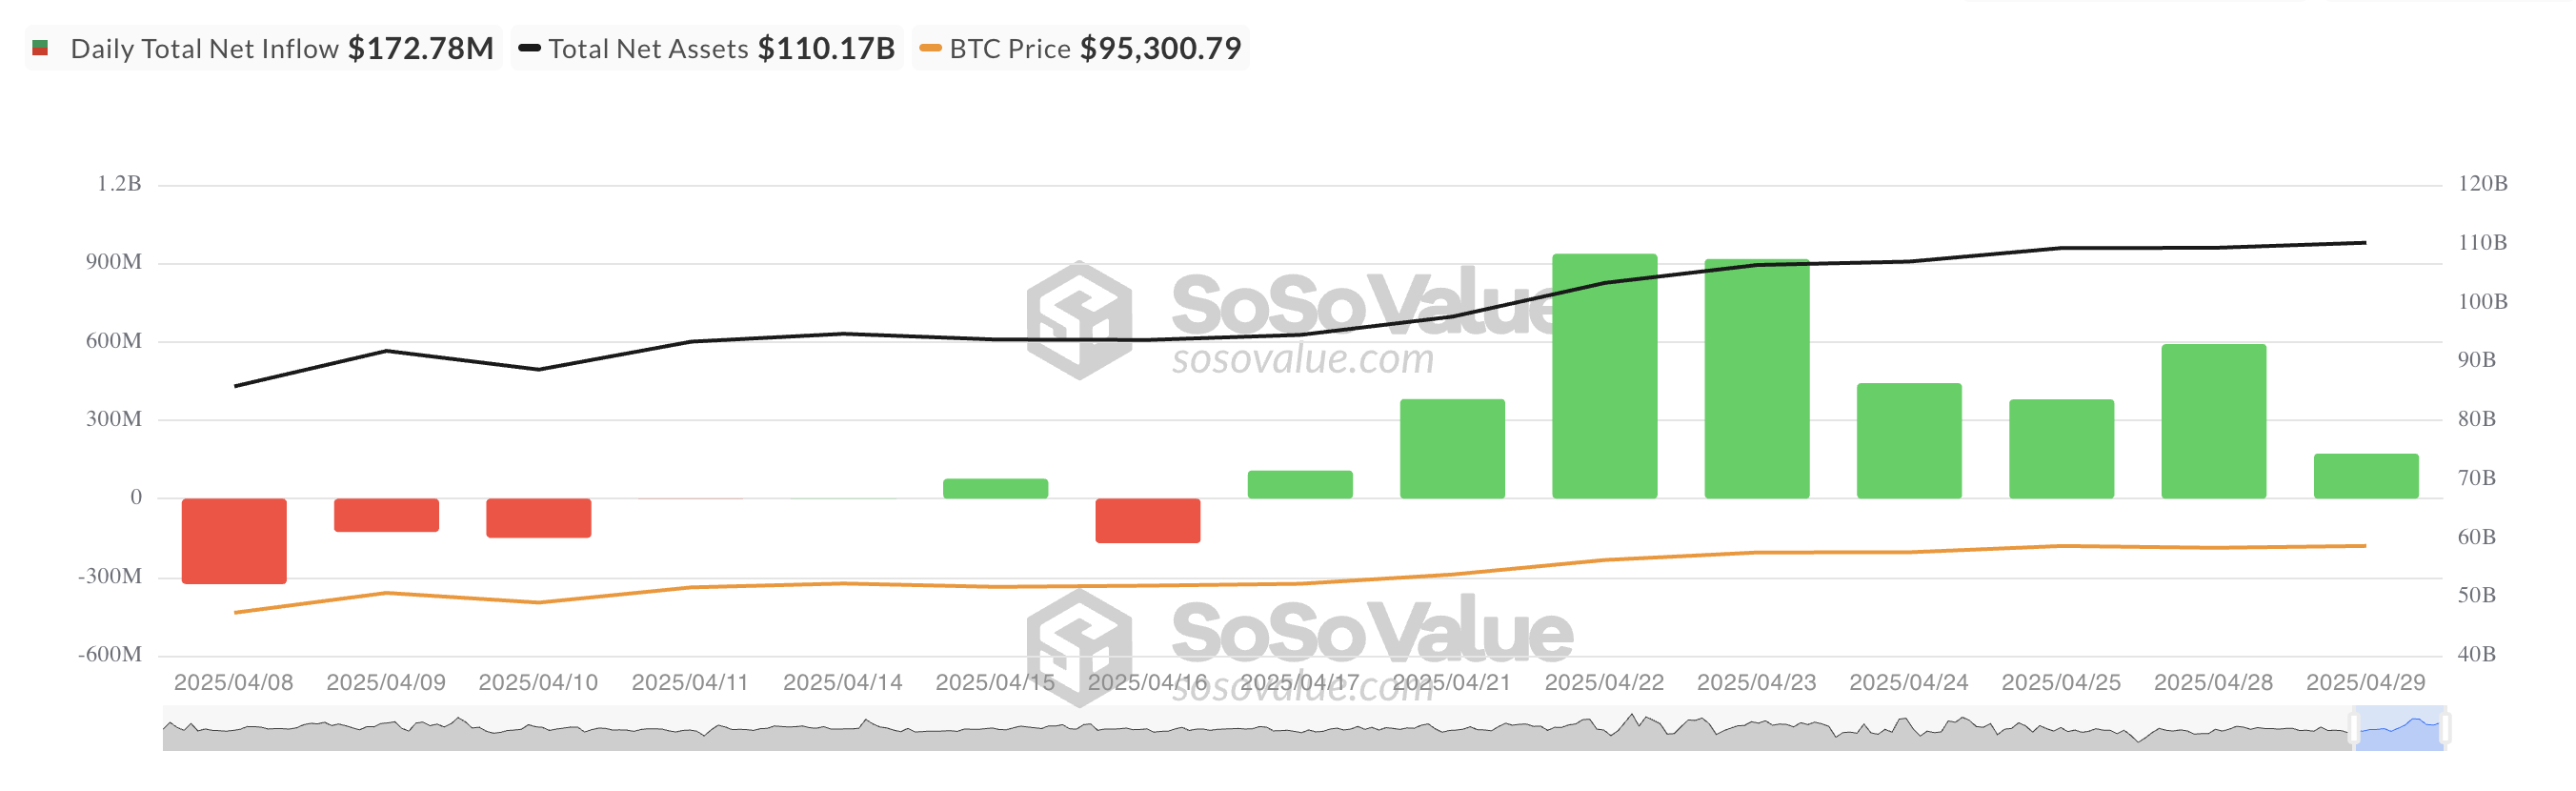
On Tuesday, institutional investors continued to pour capital into spot Bitcoin ETFs, marking the eighth consecutive day of inflows.
Total net inflows across all US-listed Bitcoin ETFs exceeded $170 million for the day, reinforcing the bullish sentiment that has gripped the market since last week.
Bitcoin ETFs Log 8th Straight Day of Inflows
Yesterday, BTC-backed funds posted another net inflow, totaling $172.78 million. This signaled sustained confidence in the asset class.
Total Bitcoin Spot ETF Net Inflow. Source: SosoValue
BlackRock’s iShares Bitcoin Trust (IBIT) once again led the pack, recording the highest daily inflow among all issuers. On Tuesday, the fund recorded a daily net inflow of $216.73 million, bringing its total historical net inflow to $42.39 billion.
IBIT has consistently dominated in recent sessions, reflecting BlackRock’s influence in the crypto ETF space and sustained institutional trust in its offerings.
Meanwhile, Bitwise’s spot Bitcoin ETF (BITB) recorded the highest net outflow among all issuers on Tuesday, with $24.39 million exiting the fund. Nevertheless, BITB’s total historical net inflows remain strong at $2.05 billion.
Leverage Cools in the Bitcoin Market
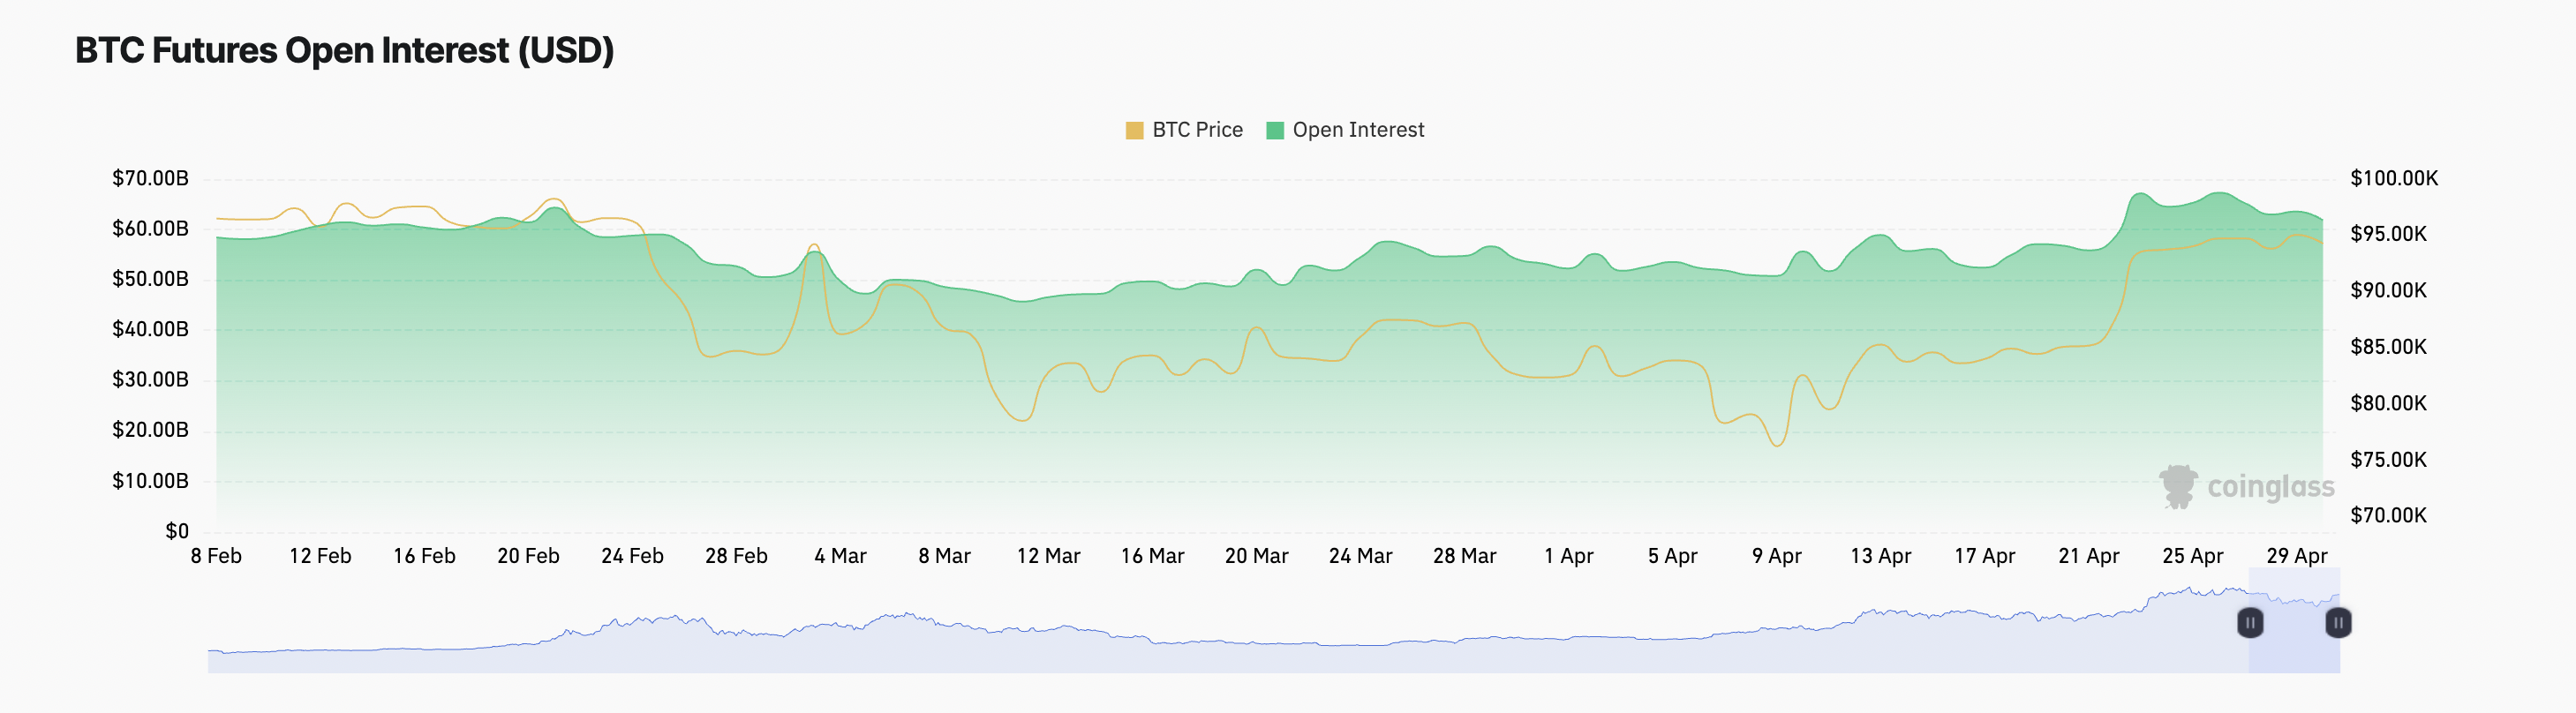
Open interest (OI) in the Bitcoin futures market has seen a modest decline today. This suggests a degree of cooling among leveraged positions, as some traders are closing out positions.
It stands at $61.81 billion at press time, plunging by 3% over the past 24 hours. During that period, BTC’s price noted a 1% uptick.
When an asset’s price rises while open interest falls, traders take profits or de-risk, suggesting caution despite the uptick. This trend points to a lack of conviction in BTC’s rally, with fewer participants willing to take on new leveraged positions.
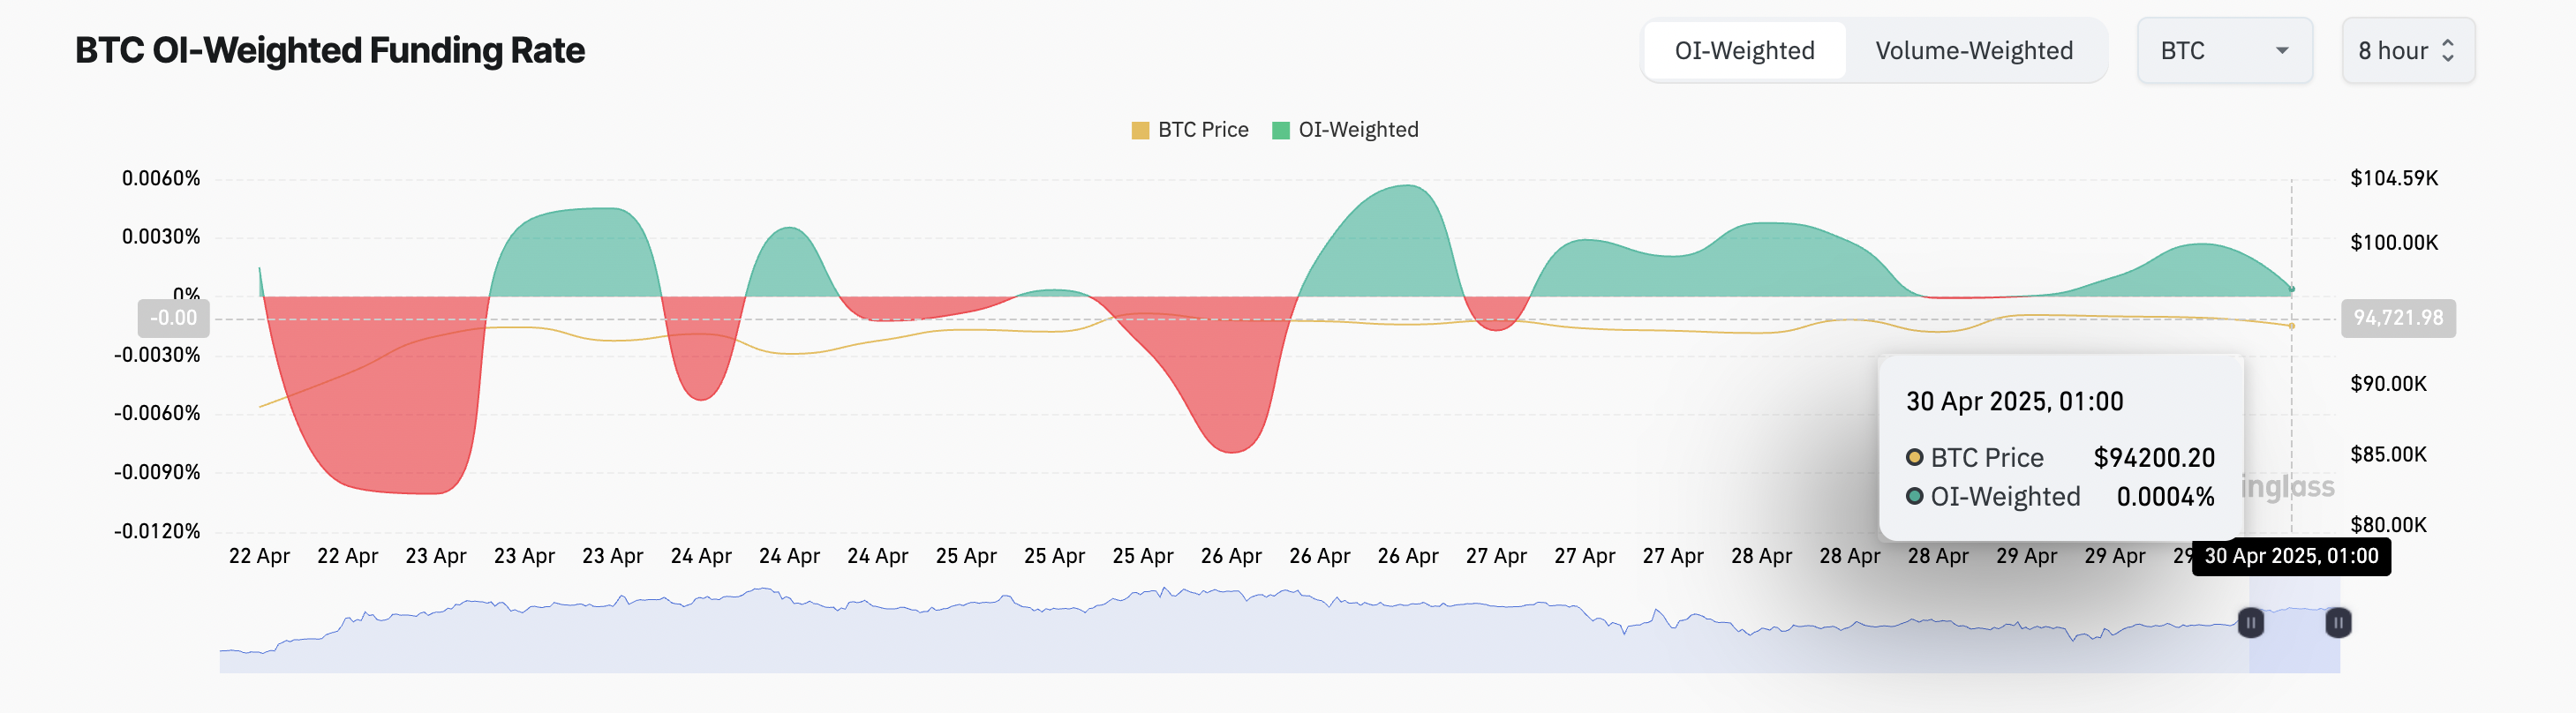
However, broader market sentiment remains optimistic. BTC’s funding rate is currently at 0.004%, indicating that long positions are still willing to pay to maintain leverage.
The funding rate is a periodic payment between long and short traders in perpetual futures contracts, used to keep the contract price aligned with the spot market. When the funding rate is positive, longs are paying shorts, indicating that more traders are betting on the price going up, a sign of bullish market sentiment.
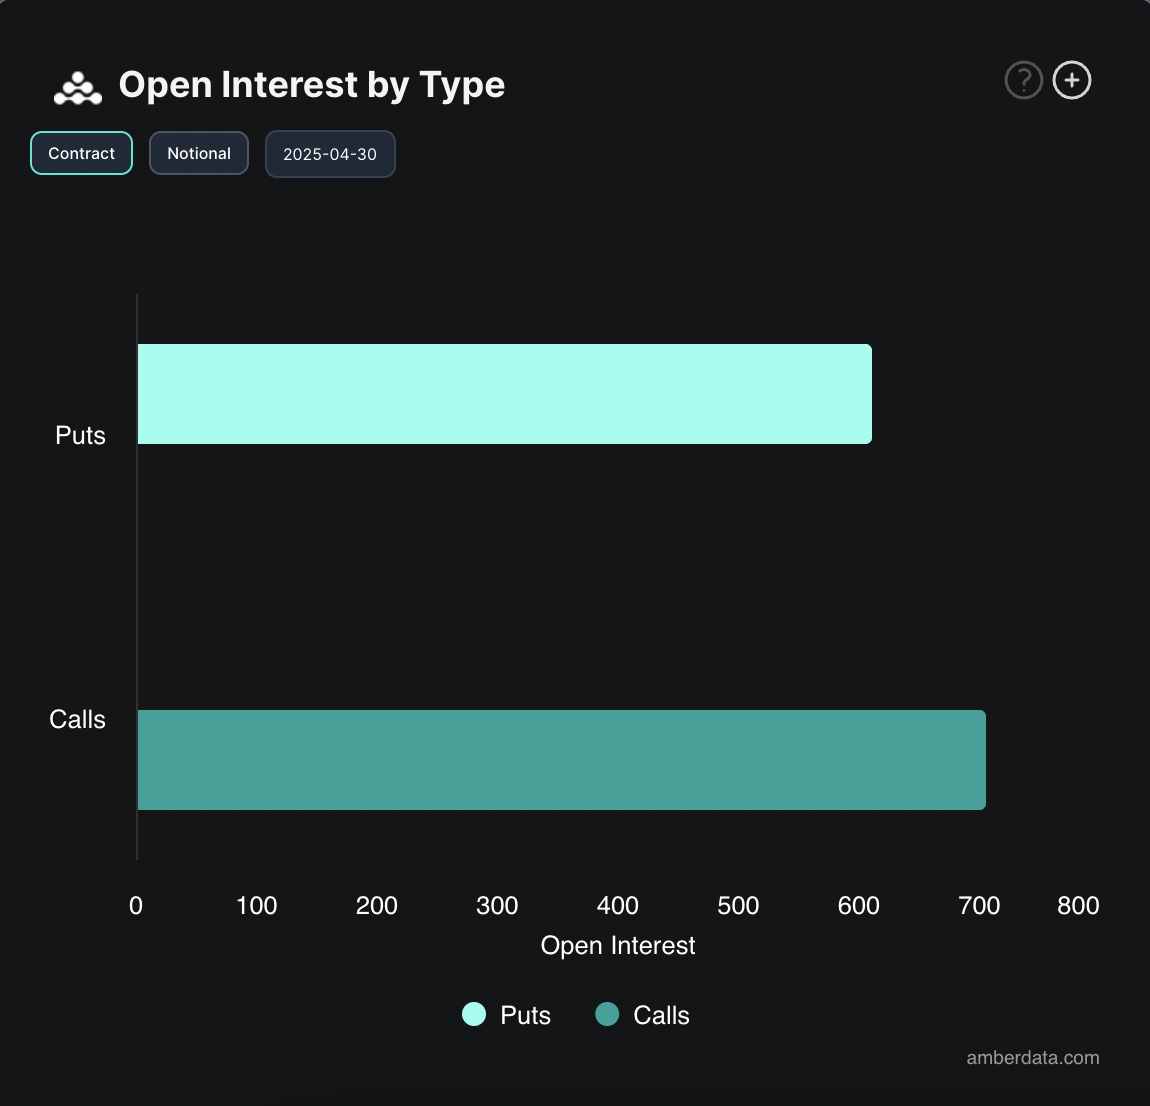
Moreover, the increase in call option volume suggests that traders are positioning for further upside in the coin’s price.
While derivatives activity shows minor signs of uncertainty, the persistent inflows into spot Bitcoin ETFs point to a market still leaning bullish in the near term.