Coinbase stock will replace Discover Financial Services in the S&P 500 effective May 19, 2025.
COIN shares surged over 8 percent during Monday’s after-hours trading session.
Coinbase Global Inc. (NASDAQ: COIN) will be listed as part of the S&P 500 index, which tracks large-cap companies in the United States, on May 19, 2025. According to the announcement, Coinbase will replace Discover Financial Services (NYSE: DFS) in the S&P 500.
Furthermore, Discover Financial Services is being acquired by Capital One Financial Corp. (NYSE: COF), a constituent of the S&P 500 index.
The announcement received huge attention from the wider crypto community led by Michael Saylor, co-founder of Strategy. Moreover, the listing of Coinbase shares on the S&P 500 index further solidifies the growth and maturity of the cryptocurrency market and blockchain technology.
Congratulations @Brian_Armstrong on $COIN being added to the S&P 500 Index. A major milestone for Coinbase and for Bitcoin.
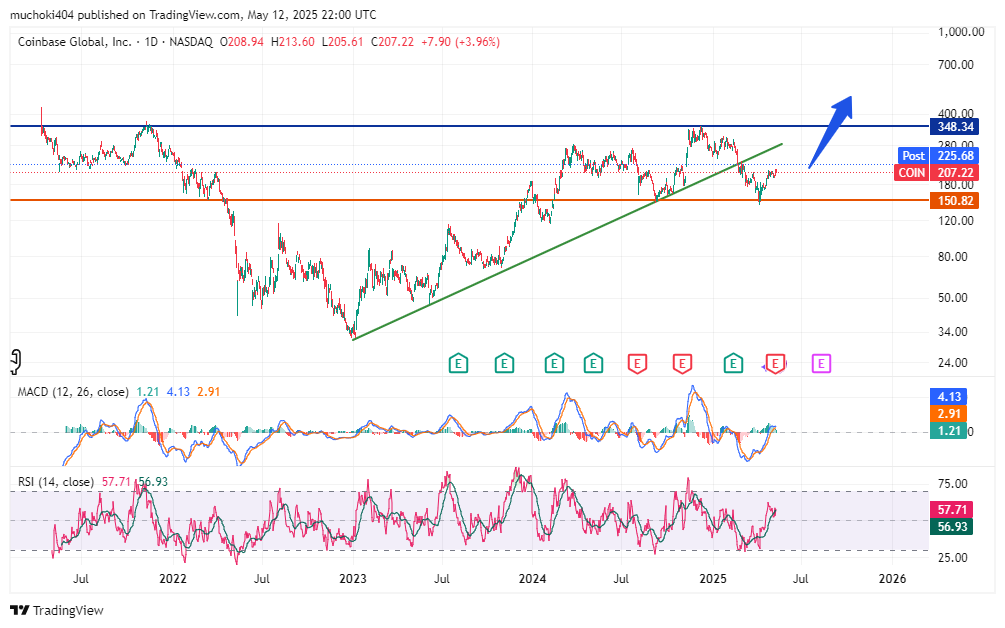
Following the announcement, COIN shares surged over 8 percent in Monday’s after-hours trading session to hover about $225. The large-cap company, with a market valuation of about $50 billion, successfully rebounded from a crucial support level above $150.
As a result, the COIN stock market is well positioned to rally beyond a crucial resistance level of around $348 in the near term. In the daily timeframe, COIN’s MACD line recently crossed above the seton line, amid the growing bullish momentum confirmed by the rising histograms.
Moreover, the company is heavily invested in Bitcoin and the wider altcoin market, which has signaled bullish momentum at the time of this writing. However, a consistent close below the recently established support level of around $150 will lead to further sell-off for COIN stock possibly towards the support level of around $116.
Binance founder Changpeng Zhao (CZ) has warned that 95% of cryptocurrencies are destined to fail due to weak fundamentals, lack of real-world utility, and terrible execution. However, Ozak AI (OZ) is emerging as a standout project with a sturdy use case in AI-driven blockchain generation. By integrating predictive analytics, machine learning, and decentralized finance, Ozak AI offers real-time market insights and automatic trading solutions, setting it apart from speculative tokens.
Currently in its 3rd presale stage at just $0.003, analysts expect OZ could attain $1, imparting a large growth possibility. With AI reshaping industries and blockchain technology evolving, Ozak AI’s progressive method positions many of the elite 5% of cryptos with long-term potential, proving CZ’s caution at the same time as highlighting its promising destiny.
The Crypto Market’s Harsh Reality
Binance founder Changpeng Zhao (CZ) has long been a vocal figure within the cryptocurrency space, offering insights into market trends and potential risks. Recently, CZ issued a stark caution: 95% of cryptocurrencies will finally fail. His declaration aligns with a widely usual reality within the crypto enterprise—most projects lack real-world software, sturdy development groups, or long-term sustainability.
Despite the fast increase of the blockchain sector, history has shown that only a handful of tasks manage to survive and thrive over time. Many cryptocurrencies released with bold roadmaps however fail due to terrible execution, lack of adoption, or unsustainable tokenomics. With regulation tightening and investors becoming extra cautious, most effective tasks with sturdy basics and innovative use instances will have a risk at long-term success. This raises the question: Which cryptos will defy the odds?
Among the emerging crypto initiatives, Ozak AI (OZ) is swiftly gaining traction as a promising project. Unlike the heaps of speculative tokens flooding the market, Ozak AI is built on a foundation of artificial intelligence and blockchain integration, offering real-world applications that deal with urgent financial and analytical needs.
Ozak AI combines AI-pushed predictive analytics, machine learning algorithms, and decentralized finance (DeFi) to offer users with real-time monetary insights, automated trading strategies, and advanced data analytics. This approach unites it other than conventional cryptocurrencies, many of which lack a tangible use case beyond hypothesis. By leveraging AI, Ozak AI ambitions to revolutionize the way investors have interaction with the crypto market, making facts-driven decisions extra accessible and efficient.
The project’s particular features include the Ozak Stream Network (OSN) for low-latency statistics processing, decentralized protection via DePIN (Decentralized Physical Infrastructure Networks), and customizable Prediction Agents (PAs) that permit users to tailor AI models to their unique wishes. These innovations role Ozak AI as a leading pressure inside the AI-powered blockchain revolution.
Moreover, the 3rd stage of the Ozak AI presale is currently occurring, and the task is already making waves within the crypto community. With an outstanding over $900K raised so far, Ozak AI tokens are currently priced at simply $0.003 each, with the next level price set at $0.005. This early-level opportunity is poised for sizable growth, with projections suggesting that the token ought to reach $1 by 2025.
The Road to $1: A Realistic Projection
Currently, Ozak AI is in its 3rd presale stage, with the OZ token priced at simply $0.003. Given the growing hobby in AI-driven crypto solutions and the speedy adoption of blockchain-based predictive analytics, analysts are expecting that OZ should reach $1 in the near future. This could represent an outstanding 333x return for early investors, making it one of the most money making opportunities in the current crypto market.
Unlike many tokens that rely simply on hype, Ozak AI is sponsored by a strong ecosystem and clear software. The growing demand for AI in financial markets, mixed with the assignment’s innovative method, gives it a great area over competitors. If adoption keeps at its current pace and the AI area keeps its momentum, Ozak AI might be among the elite 5% of cryptos that prevail, proving CZ’s caution right while solidifying its place as a chief player within the industry.
CZ’s caution about the fate of 95% of cryptocurrencies is a reminder that now not all initiatives are built to remain. However, Ozak AI’s solid fundamentals, progressive AI integration, and strong market positioning make its route to $1 extra promising than ever. For traders seeking a project with real-world value and long-term boom potential, Ozak AI sticks out as an extraordinary opportunity in an otherwise unsure market.
About Ozak AI
Ozak AI is a blockchain-based project that provides a technology platform that specializes in predictive AI and advanced data analytics for financial markets. Ozak AI helps crypto investors and businesses in decision-making by providing real-time, accurate, and actionable insights through machine learning algorithms and decentralized network technologies.
The post CZ’s Warning: 95% of Cryptos Are Doomed—But Ozak AI’s Path to $1 Looks Stronger Than Ever! appeared first on Coinpedia Fintech News
Binance founder Changpeng Zhao (CZ) has warned that 95% of cryptocurrencies are destined to fail due to weak fundamentals, lack of real-world utility, and terrible execution. However, Ozak AI (OZ) is emerging as a standout project with a sturdy use case in AI-driven blockchain generation. By integrating predictive analytics, machine learning, and decentralized finance, Ozak …
Coinbase’s listing of CFTC-regulated futures for XRP follows Bitnomial’s launch of a similar product last month.
The rising demand for XRP by institutional investors has helped increase bullish sentiment.
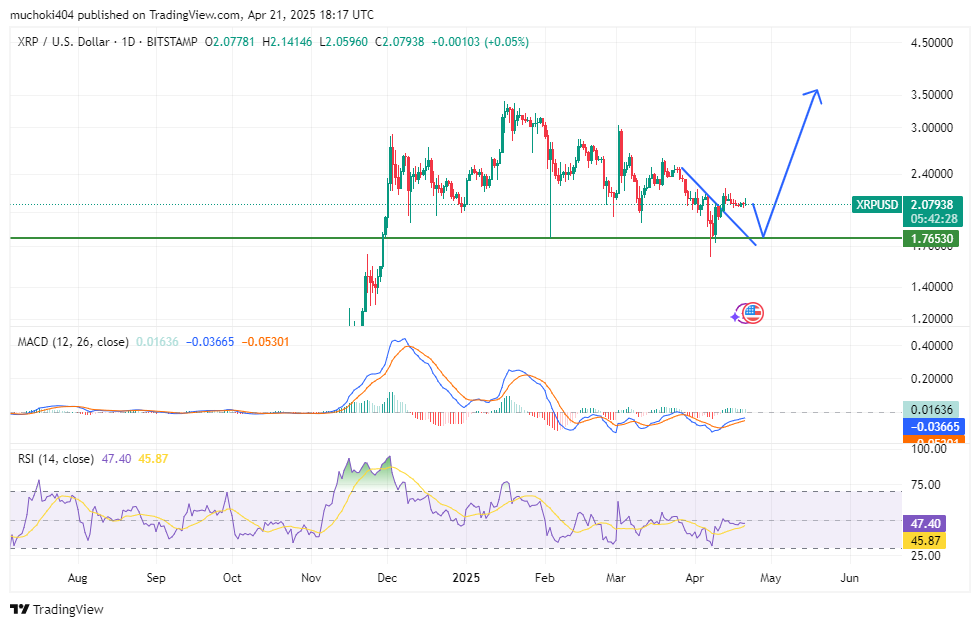
XRP/USD pair may retest $1.77 in the coming days before continuing with a macro bullish outlook.
Coinbase Global Inc. (NASDAQ: COIN), a top-tier cryptocurrency exchange in the North American markets, announced a major trading expansion for Ripple Labs’ XRP on Monday, April 21. After filing with the Commodity Futures Trading Commission (CFTC), on April 3, to offer XRP futures contracts, the exchange announced a successful listing of the regulated products on Monday.
Coinbase will offer monthly, cash-settled margin contracts, each representing 10k XRP, to its clients ahead. The launch of Coinbase’s XRP futures contract follows a similar product by Bitnomial in mid-March 2025.
Why the Launch of XRP Futures Contracts Matters
The launch of Coinbase’s XRP futures contract will further enhance the legitimacy of XRP among institutional investors. Moreover, XRP has gained significant regulatory clarity in the United States in the past few months, bolstered by the Donald Trump administration’s initiatives to foster the adoption of crypto assets.
Ultimately, the liquidity of XRP will significantly increase as more institutional investors participate in futures contract trading.
What Next for XRP Price
The impact of the rising adoption of XRP by institutional investors will be significant in the long haul. Moreover, digital assets are expected to play a crucial role in resetting global financial systems, which have been siloed over the past decades.
From a technical analysis standpoint, XRP price has been forming a potential bullish pattern, especially after breaking out of a falling logarithmic trend. In the daily time frame, XRP price, against the U.S. dollar is likely to retest the recent bullish breakout by falling back towards the support level above $1.77.
Moreover, the daily MACD indicator has yet to flash a bullish signal, and the Relative Strength Index (RSI) has experienced a resistance level of around 50 percent level.
However, a consistent close above $2.22 will invalidate further short-term correction and trigger a fresh rally toward a new all-time high ahead.
The post Coinbase Derivatives Announces Listing of CFTC-Regulated Futures for XRP: What Next? appeared first on Coinpedia Fintech News
Coinbase’s listing of CFTC-regulated futures for XRP follows Bitnomial’s launch of a similar product last month. The rising demand for XRP by institutional investors has helped increase bullish sentiment. XRP/USD pair may retest $1.77 in the coming days before continuing with a macro bullish outlook. Coinbase Global Inc. (NASDAQ: COIN), a top-tier cryptocurrency exchange in …