Circle’s Cross-Chain Transfer Protocol (CCTP) facilitated $7.7 billion in stablecoin bridging volume in May, an all-time high and an 83.3% increase from April.
The firm launched its IPO last week, rejecting outright buyout efforts to remain an active player in the stablecoin market. This impressive growth can help demonstrate Circle’s progress and solid foundations.
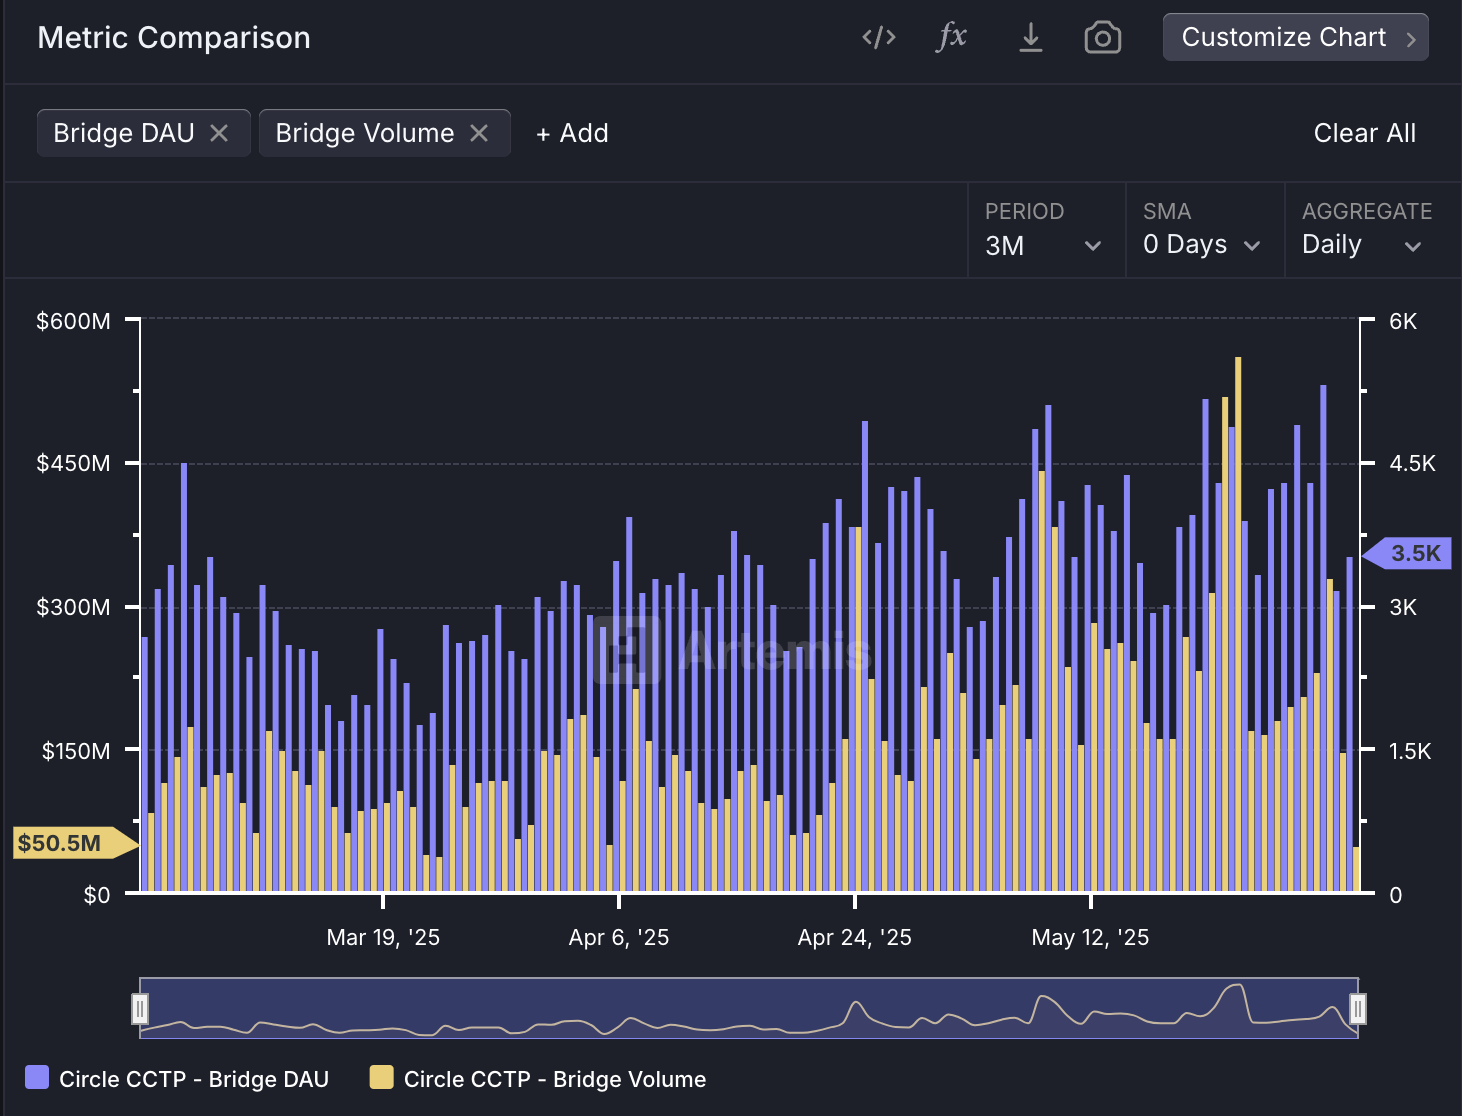
This CCTP volume is especially relevant for Circle for another reason. Specifically, the total number of active stablecoin addresses also reached a new record last month: 33.1 million.
In a time when the total demand for stablecoins and utility solutions is only growing, Circle is working to present its payments ecosystem as an attractive option.
CCTP’s record growth could signal Circle’s long-term market potential, better enticing new capital investment. The stablecoin issuer already increased its IPO size today, setting a more ambitious target of $896 million.
While the number of active stablecoin addresses is rising, major investment banks are planning to substantially increase their presence in the industry.
In other words, Circle’s record CCTP growth comes at a useful time. USDC’s trading volume also broke records in April, and now the stablecoin’s utility protocols are surging, too.
Circle is intent on remaining an independent company and positioning itself as a strong contender in this sector. To do this, it will need positive metrics like CCTP’s volume to move the market.
The collapse of the MANTRA (OM) token has left investors reeling, with many facing significant losses. As analysts comb through the causes of the collapse, many questions remain.
BeInCrypto consulted industry experts to identify five critical red flags behind MANTRA’s downfall and reveal strategies investors can adopt to steer clear of similar pitfalls in the future.
MANTRA (OM) Crash: What Investors Missed and How to Avoid Future Losses
On April 13, BeInCrypto broke the news of OM’s 90% crash. The collapse raised several concerns, with investors accusing the team of orchestrating a pump-and-dump scheme. Experts believe that there were many early signs of trouble.
In addition, the project adopted an inflationary tokenomic model with an uncapped supply, replacing the previous hard cap. As part of this transition, the total token supply was also increased to 1.7 billion.
However, the move wasn’t without drawbacks. According to Jean Rausis, co-founder of SMARDEX, tokenomics was a point of concern in the OM collapse.
“The project doubled its token supply to 1.77 billion in 2024 and shifted to an inflationary model, which diluted its original holders. Complex vesting favored insiders, while low circulating supply and massive FDV fueled hype and price manipulation,” Jean Rausis told BeInCrypto.
Moreover, the team’s control over the OM supply also raised centralization concerns. Experts believe this was also a factor that could have led to the alleged price manipulation.
“About 90% of OM tokens were held by the team, indicating a high level of centralization that could potentially lead to manipulation. The team also maintained control over governance, which undermined the project’s decentralized nature,” said Phil Fogel, co-founder of Cork.
Phil Fogel acknowledged that a concentrated token supply isn’t always a red flag. However, it’s crucial for investors to know who holds large amounts, their lock-up terms, and whether their involvement aligns with the project’s decentralization goals.
Moreover, Ming Wu, the founder of RabbitX, also argued that analyzing this data is essential to uncover any potential risks that could undermine the project in the long term.
“Tools like bubble maps can help identify potential risks related to token distribution,” Wu advised.
2. OM Price Action
2025 has been marked as the year of significant market volatility. The broader macroeconomic pressures have weighed heavily on the market, with the majority of the coins experiencing steep losses. Yet, OM’s price action was relatively stable until the latest crash.
OM vs. TOTAL Market Performance. Source: TradingView
“The biggest red flag was simply the price action. The whole market was going down, and nobody cared about MANTRA, and yet its token price somehow kept pumping in unnatural patterns – pump, flat, pump, flat again,” Jean Rausis disclosed.
He added that this was a clear sign of a potential issue or problem with the project. Nevertheless, he noted that identifying the differentiating price action would require some technical analysis know-how. Thus, investors lacking the knowledge would have easily missed it.
Despite this, Rausis highlighted that even the untrained eye could find other signs that something was off, ultimately leading to the crash.
Strategies to Protect Yourself
While investors remained optimistic about OM’s resilience amid a market downturn, this ended up costing them millions. Eric He, LBank’s Community Angel Officer, and Risk Control Adviser emphasized the importance of proactive risk management to avoid OM-style collapses.
“First, diversification is key—spreading capital across projects limits single-token exposure. Stop-loss triggers (e.g., 10-20% below buy price) can automate damage control in volatile conditions,” Eric shared with BeInCrypto.
Ming Wu had a similar perspective, emphasizing the importance of avoiding over-allocation to a single token. The executive explained that a diversified investment strategy helps mitigate risk and enhances overall portfolio stability.
“Investors can use perpetual futures as a risk management tool to hedge against potential price declines in their holdings,” Wu remarked.
Meanwhile, Phil Fogel advised focusing on a token’s liquidity. Key factors include the float size, price sensitivity to sell orders, and who can significantly impact the market.
3. Project Fundamentals
Experts also highlighted major discrepancies in MANTRA’s TVL. Eric He pointed out a significant gap between the token’s fully diluted valuation (FDV) and the TVL. OM’s FDV reached $9.5 billion, while its TVL was only $13 million, indicating a potential overvaluation.
“A $9.5 billion valuation against $13 million TVL, screamed instability,” Forest Bai, co-founder of Foresight Ventures, stated.
Notably, several issues were also raised regarding the airdrop. Jean Rausis called the airdrop a “mess.” He cited many issues, including delays, frequent changes to eligibility rules, and the disqualification of half the participants. Meanwhile, suspected bots were not removed.
“The airdrop disproportionately favored insiders while excluding genuine supporters, reflecting a lack of fairness,” Phil Fogel reiterated.
The criticism expanded further as Fogel pointed out the team’s alleged associations with questionable entities and ties to questionable initial coin offerings (ICOs), raising doubts about the project’s credibility. Eric He also suggested that MANTRA was allegedly tied to gambling platforms in the past.
Strategies to Protect Yourself
Forest Bai underscored the importance of verifying the project team’s credentials, reviewing the project roadmap, and monitoring on-chain activity to ensure transparency. He also advised investors to assess community engagement and regulatory compliance to gauge the project’s long-term viability.
Ming Wu also stressed distinguishing between real growth and artificially inflated metrics.
“It’s important to differentiate real growth from activity that’s artificially inflated through incentives or airdrops, unsustainable tactics like ‘selling a dollar for 90 cents’ may generate short-term metrics but don’t reflect actual engagement,” Wu informed BeInCrypto.
Finally, Wu recommended researching the background of the project’s team members to uncover any history of fraudulent activity or involvement in questionable ventures. This would ensure that investors are well-informed before committing to any project.
4. Whale Movements
As BeInCrypto reported earlier, before the crash, a whale wallet reportedly associated with the MANTRA team deposited 3.9 million OM tokens into the OKX exchange. Experts highlighted that this wasn’t an isolated incident.
“Large OM transfers (43.6 million tokens, ~$227 million) to exchanges days prior were a major warning of potential sell-offs,” Forest Bai conveyed to BeInCrypto.
Ming Wu also explained that investors should pay close attention to such large transfers, which often act as warning signals. Moreover, analysts at CryptoQuant also outlined what investors should look out for.
“OM transfers into exchanges amounted to as much as $35 million in just an hour. This represented an alert sign as: Transfers into exchanges are below $8 million in a typical hour (excluding transfers into Binance, which are typically large given the size of the exchange). Transfers into exchanges represented more than a third of the total OM transferred, which indicates a high transfer volume into exchanges,” CryptoQuant informed BeInCrypto.
Strategies to Protect Yourself
CryptoQuant stated that investors need to monitor the flows of any token into exchanges, as it could indicate increasing price volatility in the near future.
Meanwhile, Risk Control Adviser Eric He outlined four strategies to stay up-to-date when it comes to large transfers.
Chain Sleuthing: Tools like Arkham and Nansen allow investors to track large transfers and monitor wallet activity.
Set Alerts: Platforms like Etherscan and Glassnode notify investors of unusual market movements.
Track Exchange Flows: Users need to track large flows into centralized exchanges.
Check Lockups: Dune Analytics helps investors determine if team tokens are being released earlier than expected.
He also recommended focusing on the market structure.
“OM’s crash proved market depth is non-negotiable: Kaiko data showed 1% order book depth collapsed 74% before the fall. Always check liquidity metrics on platforms like Kaiko; if 1% depth is below $500,000, that’s a red flag,” Eric revealed to BeInCrypto.
Additionally, Phil Fogel underlined the importance of monitoring platforms like X (formerly Twitter) for any rumors or discussions about possible dumps. He stressed the need to analyze liquidity to assess whether a token can handle sell pressure without causing a significant price drop.
Interestingly, experts were slightly divided on how CEXs contributed to OM’s crash. Forest Bai claimed that CEX liquidations during low-liquidity hours worsened the crash by triggering cascading sell-offs. Eric He corroborated this sentiment.
“CEX liquidations played a major role in the OM crash, acting as an accelerant. With thin liquidity—1% depth falling from $600,000 to $147,000—forced closures triggered cascading liquidations. Over $74.7 million was wiped in 24 hours,” he mentioned.
“Analyzing the open interest in the OM derivatives market reveals that it was less than 0.1% of OM’s market capitalization. However, what’s particularly interesting is that during the market collapse, open interest in OM derivatives actually increased by 90%,” Wu expressed to BeInCrypto.
According to the executive, this challenges the idea that liquidations or forced closures caused the price drop. Instead, it indicates that traders and investors increased their short positions as the price fell.
Strategies to Protect Yourself
While the involvement of CEXs remains debatable, the experts did address the key point of investor protection.
“Investors can limit leverage to avoid forced liquidations, choose platforms with transparent risk policies, monitor open interest for liquidation risks, and hold tokens in self-custody wallets to reduce CEX exposure,” Forest Bai recommended.
Eric He also advised that investors should mitigate risks by adjusting leverage dynamically based on volatility. If tools like ATR or Bollinger Bands signal turbulence, exposure should be reduced.
The MANTRA (OM) collapse is a powerful reminder of the importance of due diligence and risk management in cryptocurrency investments. Investors can minimize the risk of falling into similar traps by carefully assessing tokenomics, monitoring on-chain data, and diversifying investments.
With expert insights, these strategies will help guide investors toward smarter, more secure decisions in the crypto market.
As Q2 began, the crypto market gained momentum, with many tokens showing strong performance in the latter half of April. Following Bitcoin’s lead, most altcoins have seen significant improvements, posting triple-digit gains. Some altcoins are even approaching their all-time highs, reflecting increased market optimism and growth.
BeInCrypto has analysed three such altcoins that are close to forming new all-time highs in the coming month.
Walrus (WAL)
WAL has surged by 50% over the past week, reaching a price of $0.622. This strong uptick also saw the altcoin hit a new all-time high (ATH) of $0.690. The recent gains reflect growing investor interest and confidence in the altcoin’s performance in the market.
Currently, WAL is just 11% away from breaching its ATH and potentially forming a new high at $0.750. However, this progress depends on sustaining the bullish momentum. If the market conditions remain favorable and buying pressure continues, WAL may break through this resistance and push toward the $0.750 target.
If investors decide to sell early and the bullish momentum fades, WAL could struggle to maintain its upward trend. A failure to break the $0.634 resistance level could lead to a drop to $0.546. This would invalidate the current bullish outlook and signal a potential correction in the altcoin’s price.
Saros (SAROS)
SAROS has not posted significant gains this month but did manage to hit a new all-time high (ATH) of $0.1712 before falling to $0.1311 at the time of writing. Despite the drop, the altcoin remains within a range that could allow for potential recovery and further price growth.
Currently, SAROS is facing resistance at $0.1344, and breaking through this level is crucial for the altcoin to return to its ATH of $0.1712. A successful breach would open the path toward $0.2000, providing the altcoin with a strong opportunity for continued upward movement if the bullish momentum sustains.
If SAROS fails to breach the $0.1344 resistance, it could remain consolidated above $0.1153. A failure to hold above this level would put the bullish outlook at risk, potentially leading to further downward movement and invalidating any potential for short-term growth.
BNB
BNB is currently priced at $609, needing a 30% rise to reach its all-time high (ATH) of $793. However, achieving this requires strong market conditions and investor support, both of which have been lacking throughout April. A sustained rally would be crucial for the altcoin to reclaim its ATH.
Currently trapped under a nearly five-month downtrend, BNB faces significant resistance. A 30% rally would be needed to break through this trend and reach $793. If BNB can surpass the $700 mark, it would confirm that the altcoin is on track to challenge its previous ATH and establish a new high.
However, BNB is struggling to gain traction among investors, making such a rise difficult. Failing to breach the $618 resistance could result in a decline, with BNB potentially falling below $600. If this occurs, BNB could slide toward $576, further invalidating the bullish outlook and prolonging its downtrend.
XRP
XRP is breaking out of a descending wedge pattern that has held since the start of the year. Currently trading at $2.28, the altcoin is heading toward the $2.40 resistance level. A successful breakout would indicate the potential for continued upward momentum, boosting optimism among investors.
Despite the recent surge, XRP is still more than 48% away from its all-time high (ATH) of $3.40. A sustained rally or bull run could propel XRP toward its ATH, especially if the current breakout is confirmed. Successfully flipping $2.56 into support would indicate that further gains are likely.
If XRP fails to breach the $2.40 resistance, a price reversal could occur, leading to a decline back to $2.02. Such a move would invalidate the bullish outlook, and XRP could fall back into the descending wedge pattern.
The leading altcoin, Ethereum, experienced a challenging month in March, marked by a series of bearish trends that reflected a broader market slowdown.
However, as the market begins to show signs of recovery, the key question for April remains: Can Ethereum regain its bullish momentum?
Ethereum’s March Woes: Price Crash, Activity Slump, and Growing Supply Pressure
On March 11, Ethereum plummeted to a two-year low of $1,759. This prompted traders to “buy the dip,” triggering a rally to $2,104 by March 24.
However, market participants resumed profit-taking, causing the coin’s price to fall sharply for the rest of the month. On March 31, ETH closed below the critical $2,000 price level at $1,822.
Amid ETH’s price troubles, the Ethereum network also experienced a severe decline in activity in March. Per Artemis, the daily count of active addresses that completed at least one ETH transaction fell by 20% in March.
As a result, the network’s monthly transaction count also plummeted. Totaling 1.06 million during the 31-day period in review, the number of transactions completed on Ethereum fell by 21% in March.
Generally, as more users transact and engage with Ethereum, the burn rate (a measure of ETH tokens permanently removed from circulation) increases, contributing to Ether’s deflationary supply dynamic. However, when user activity drops, ETH’s burn rate reduces, leaving many coins in circulation and adding to its circulating supply.
This was the case for ETH in March when it saw a spike in its circulating supply. According to data from Ultrasound Money, 74,322.37 coins have been added to ETH’s circulating supply in the past 30 days.
Usually, when an asset’s supply spikes like this without a corresponding demand to absorb it, it increases the downward pressure on its price. This puts ETH at risk of extending its decline in April.
What’s Next for Ethereum? Expert Says Inflation May Not Be a Major Concern
In an exclusive interview with BeInCrypto, Gabriel Halm, a Research Analyst at IntoTheBlock, noted that ETH’s current inflationary trends “may not be a major red flag” to watch out for in April.
Halm said:
“Even though Ethereum’s supply has recently stopped being deflationary, its annualized inflation rate is still only 0.73% over the last month, which is still dramatically lower than pre-Merge levels and lower than that of Bitcoin. For investors, this moderate level of inflation may not be a major red flag, provided that network usage, developer activity, and institutional adoption remain robust.”
Moreover, regarding whether Ethereum’s declining network activity has played a significant role in its recent price struggles, Halm suggested that its impact may be overstated.
“Historically, from September 2022 to early 2024, Ethereum’s supply remained deflationary, yet the ETH/BTC pair still trended lower. This suggests that macroeconomic and broader market forces can play a far more significant role than token supply changes alone.”
ETH/BTC Market Cap Comparison. Source: IntoTheBlock
On what ETH holders should anticipate this month, Halm said:
“Ultimately, whether Ethereum dips or rallies in April will likely depend more on market sentiment and macro trends than on its short-term supply dynamics. Still, it’s essential to keep an eye on network developments that could spur renewed activity and reinforce ETH’s leading position in the broader crypto landscape.”