Circle, the company behind the $62 billion USDC stablecoin, has received in-principle approval from Abu Dhabi Global Market’s Financial Services Regulatory Authority. This approval allows Circle to operate as a money services provider in the UAE, marking a major step in its Middle East expansion. The announcement comes shortly after Circle launched a new payments network to grow USDC adoption. Meanwhile, the firm remains in a quiet period following its IPO filing in the United States.
The US Securities and Exchange Commission (SEC) is opting for a longer period to issue its decision on a proposal for a Grayscale Litecoin ETF. Amid the delay, Litcoin price has reversed its daily gains, shedding nearly 2% of its value. Grayscale Litecoin ETF Faces Another ETF Delay A fresh filing has revealed that the
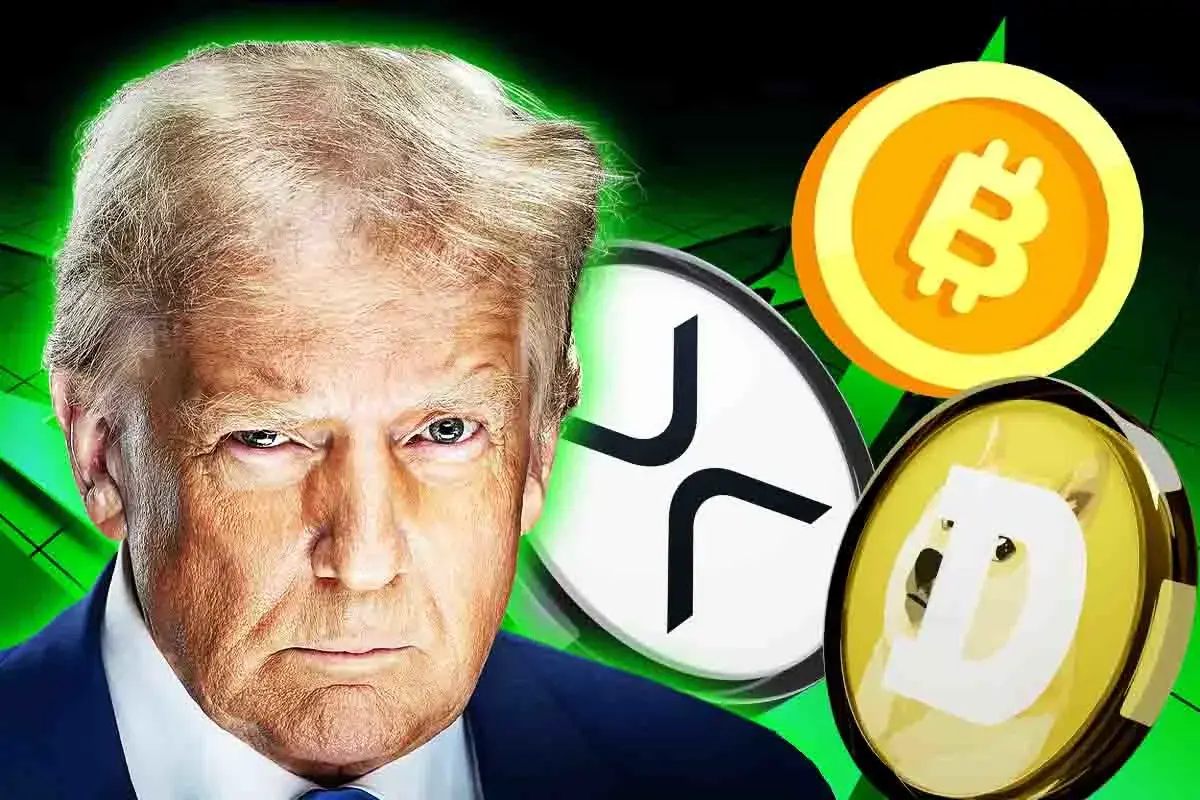
As US President Donald Trump announced a 90-day tariff delay, top cryptocurrencies like Bitcoin (BTC), XRP, and Dogecoin (DOGE) are showing signs of a potential breakout. In addition, with Trump’s hint at pausing the 50% tariff on China, all eyes are on its potential impact on the broader crypto market.
With the traditional financial market experiencing relief after a massive downturn, cryptocurrencies, in correlation with stocks and bonds, are exhibiting positive momentum. Thus, Trump’s pause on his tariffs has sparked speculations of a bullish turn in BTC, XRP, and DOGE prices.
How Will Trump’s Tariff Delay Impact BTC, XRP, DOGE Prices?
Notably, Trump’s unexpected pause on his tariff plans has sparked anticipation of a bullish reversal in the crypto market. These speculations have been further boosted by the Bitcoin price’s recent rally past $94k, marking a significant market shift.
Other top cryptocurrencies like XRP and DOGE have also seen a bullish resurgence following Trump’s tariff delay. Considering the prevailing positive sentiment, analysts and traders remain optimistic about the future performance of BTC, XRP, and DOGE prices.
BTC Price to Hit $180K
Analyst CryptoELITES believe that the Bitcoin price is poised to hit a new all-time high of $180,000 in November 2025. At the same time, crypto expert Merlijn The Trader forecasted the BTC price’s bullish rally to $150k in the near future. Now, Bitcoin is exchanging hands at $94,386, up 1.9%.
Source: X, CryptoELITES
XRP Price Sets Sights at $50
In a recent analysis, expert XRP Governor has set a long-term target for the XRP price amid the latest Trump tariff delay. According to him, XRP could reach an ambitious high of $50 in 2027. Currently, XRP is valued at $2.20, up 2.29%.
DOGE Price Targets $0.22
Dogecoin, which is currently trading at $0.1821, has a short-term target of $0.22. Identifying a bull flag on its price chart, analysts predict DOGE’s potential uptrend.
Crypto Market Boost
Significantly, the crypto market is about to witness its highest rally, as pointed out by market expert Michael van de Poppe.
Source: X, Michael van de Poppe
Trump Views High Tariff as a Victory: Here’s Why
According to Donald Trump, high tariffs, 20%-50%, on foreign imports will be a “total victory” as the US will make a fortune from the revenue generated. In addition, these tariffs will attract companies to set up production in the US. This will create job opportunities and economic growth.
Furthermore, Trump draws comparisons to other countries like China, India, and Brazil to highlight their high tariffs. Thus, he acknowledges that tariffs are a key component of his economic policy.
In conclusion, this move has sparked speculation about a potential bullish rally in the crypto market, with Bitcoin being a key beneficiary.