Charles Schwab, one of the world’s largest asset managers with $7.13 trillion under management, is preparing to launch spot crypto trading within the next 12 months. This move signals growing mainstream adoption of digital assets by traditional financial institutions. By entering the crypto space, Schwab aims to meet rising investor demand for easier access to cryptocurrencies. The rollout is expected to make crypto trading more accessible to everyday users through Schwab’s trusted platform. More details are expected in the coming months.
Grayscale and VanEck submitted amended S-1s of their proposed Solana ETFs. This is a positive sign that the funds may soon be approved. These two filings disclose sponsor fees, fund mechanics, and custodial relationships. Grayscale Sets 2.5% Fee, Cash Model for GSOL Solana ETF Grayscale’s amended filing sets a 2.5% sponsor fee and names Coinbase
Pi Network introduced two significant updates on the annual Pi2Day 2025: the Pi App Studio and Ecosystem Directory Staking.
While the Pi App Studio has been welcomed as a tool for developers to build applications, the Ecosystem Directory Staking feature has ignited confusion and controversy among its user base, particularly due to the absence of profit for participants.
What is Pi Network’s New Staking Feature?
The Ecosystem Directory Staking mechanism allows users to stake Pi Coin on the mainnet blockchain to enhance the ranking of selected apps within the Pi ecosystem. This voluntary system increases visibility for quality apps and community engagement.
This is quite different from traditional staking models in the cryptocurrency space. In traditional staking, participants typically lock up a cryptocurrency in a network to support its operations (like securing the network or validating transactions) in exchange for rewards, such as more of the cryptocurrency. This departure from conventional staking practices left Pioneers confused.
“Pioneers! There is another misunderstanding about this new staking feature. You WILL NOT get Pi rewards for staking for ranking apps! Please read carefully, as always! When staking ends, you get your Pi back minus transaction fee,” a user posted.
“A new paragraph has been added to the Pi Blog, clearly stating that there are no rewards for Pi staking. If this point had been emphasized multiple times from the beginning, many people would have understood it more easily,” another Pioneer added.
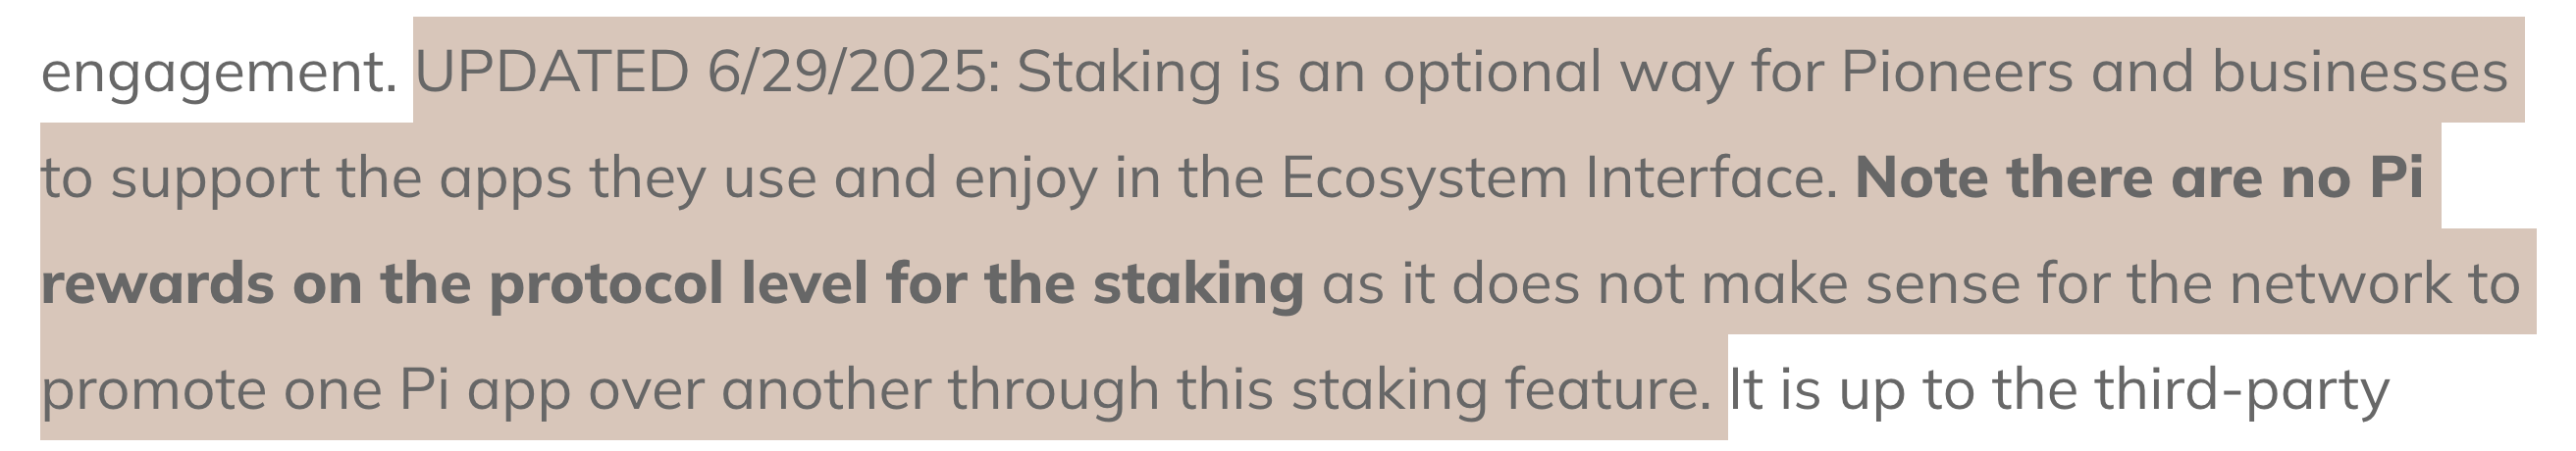
Pi Network Staking Clarification. Source: Pi Network
While staking doesn’t provide Pi rewards at the protocol level, there are provisions for incentives from the developer side. Developers can motivate users by offering incentives like app enhancements, in-app rewards, or promotions. Moreover, the team noted that users would receive their original staked amount back once the staking period had concluded.
“When you stake, your Pi is locked (can’t be used for purchases). Example: You stake 200 Pi for 60 days. After 60 days, you’ll get back exactly 200 Pi—no bonus, no interest. The 212 Pi is only used to help boost the app’s ranking in the ecosystem. Staking is a way to support the ecosystem, not to earn. Make your choices consciously,” a user explained.
Despite the disappointment, Pioneers have highlighted that the new staking mechanism could benefit the network. According to a user, this incentivizes meaningful engagement and prioritizes apps that users value enough to support financially.
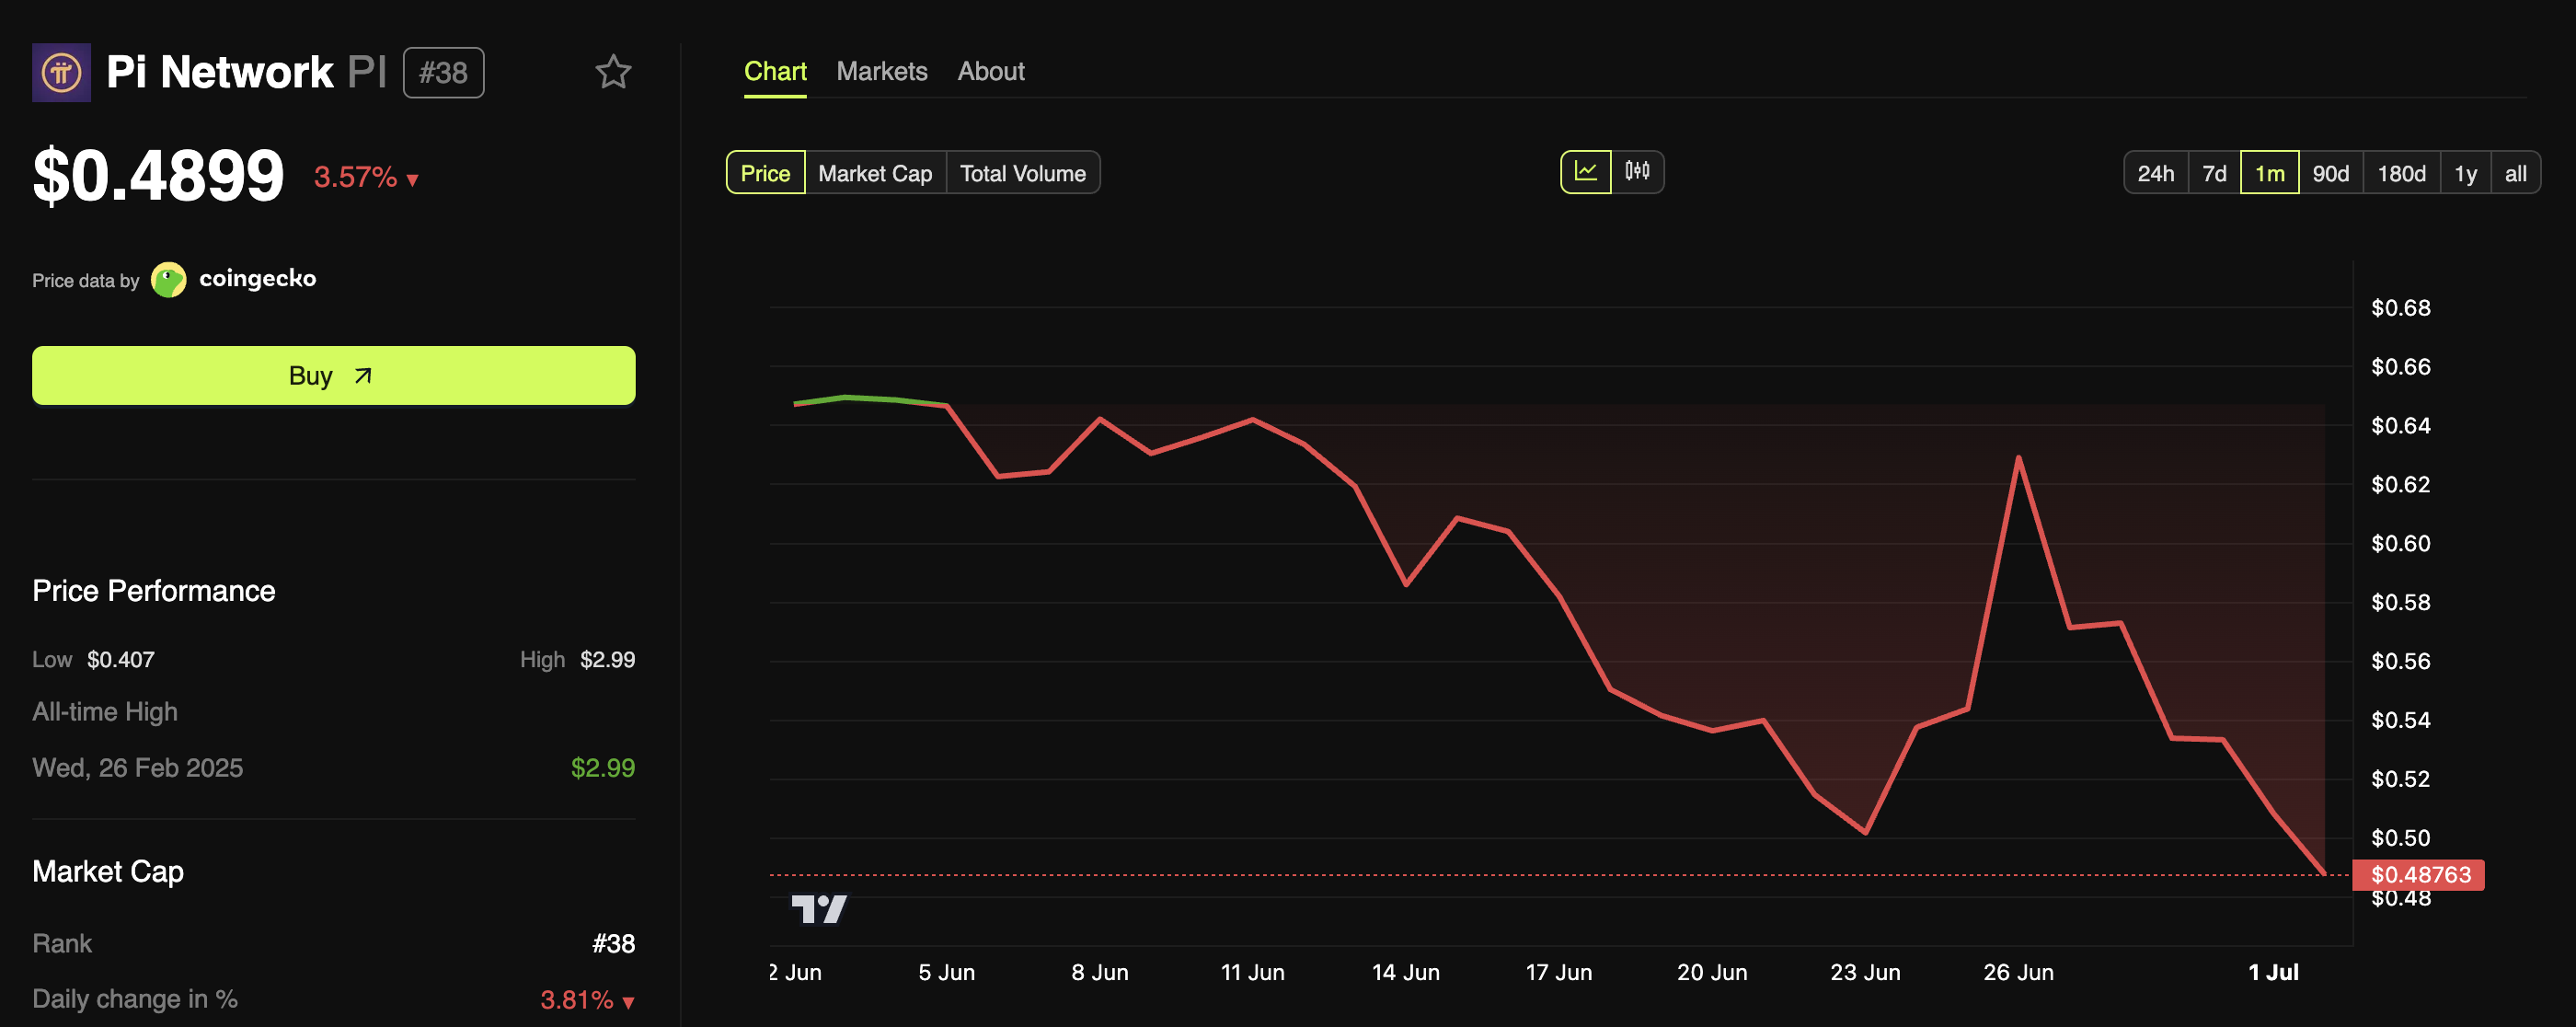
Moreover, the system also reduces the overall circulating supply of Pi, potentially impacting its availability and price.
“Circulating Supply is decreasing – because all the Pioneers who are staking Pi are locking it, so it will not be available in the market,” the post read.
Thus, while Pi Network’s approach to app development and ecosystem engagement is notable, the staking feature highlights the need for transparent communication to maintain user trust. For now, the long-term impact on Pi Coin’s value, if any, and user participation remain uncertain.