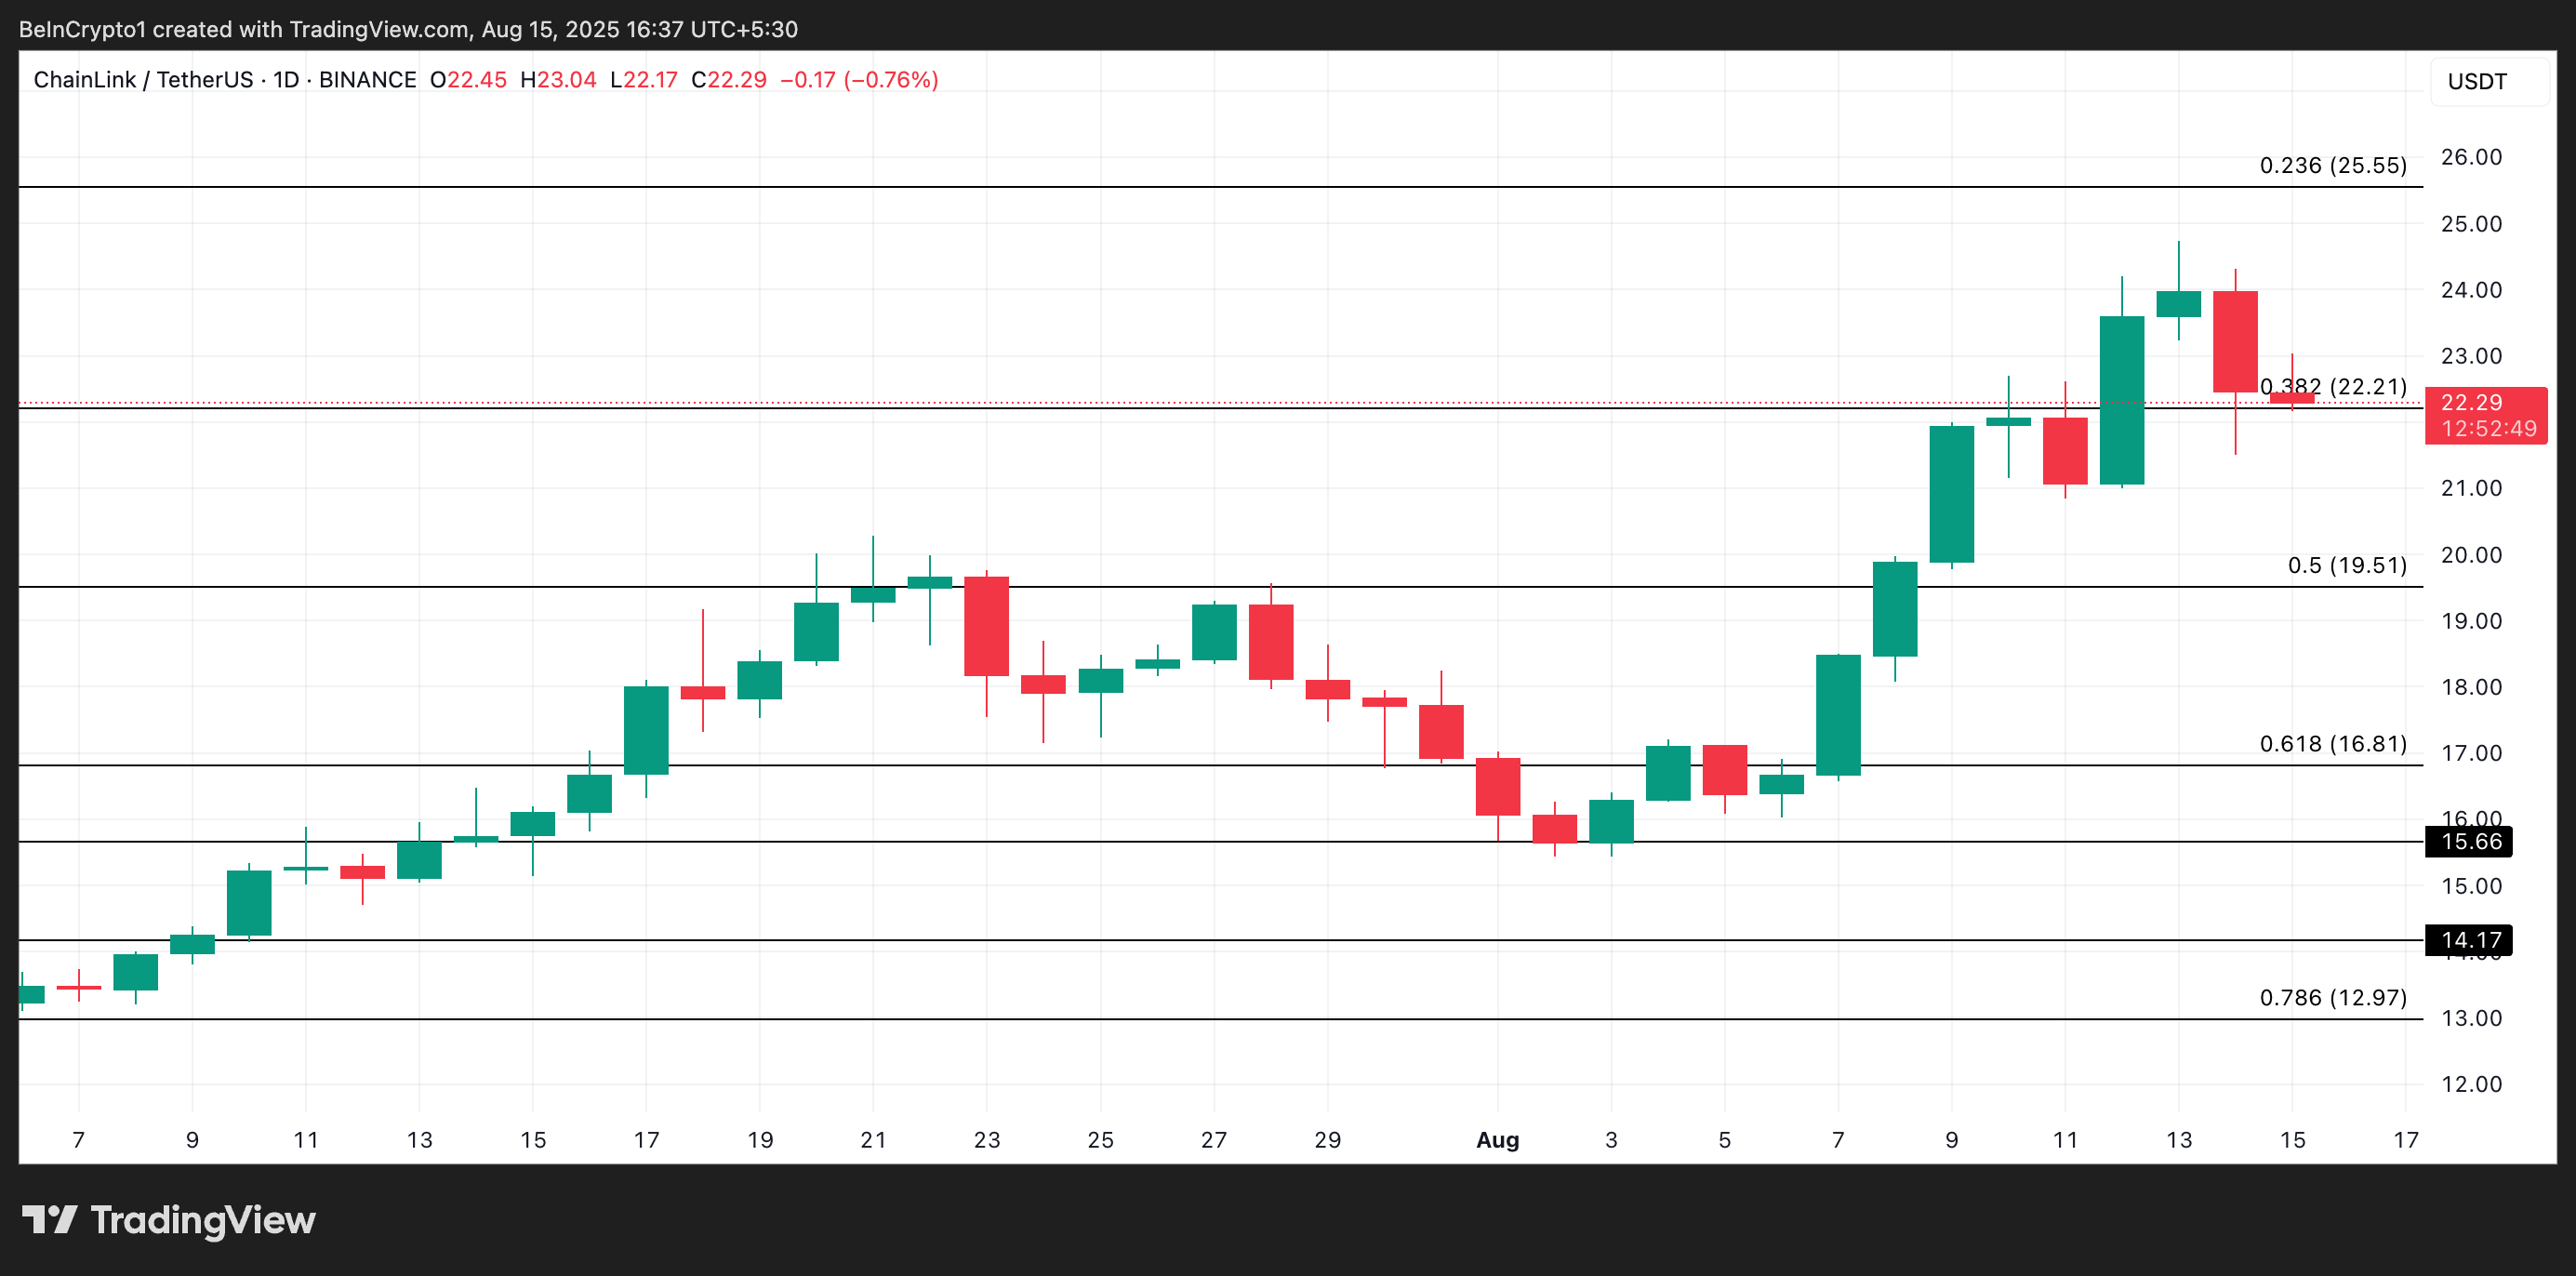
Chainlink’s price has stalled its rally since it hit an intraday peak of $24.74 on August 13. Now trading at $22.29, the altcoin’s price has since dropped 11%.
While LINK’s price has dawdled, large holders appear unfazed. They view the dip as a buying opportunity and are ramping up their accumulation as a result. What does this mean for the altcoin?
LINK Whales Make Big Moves
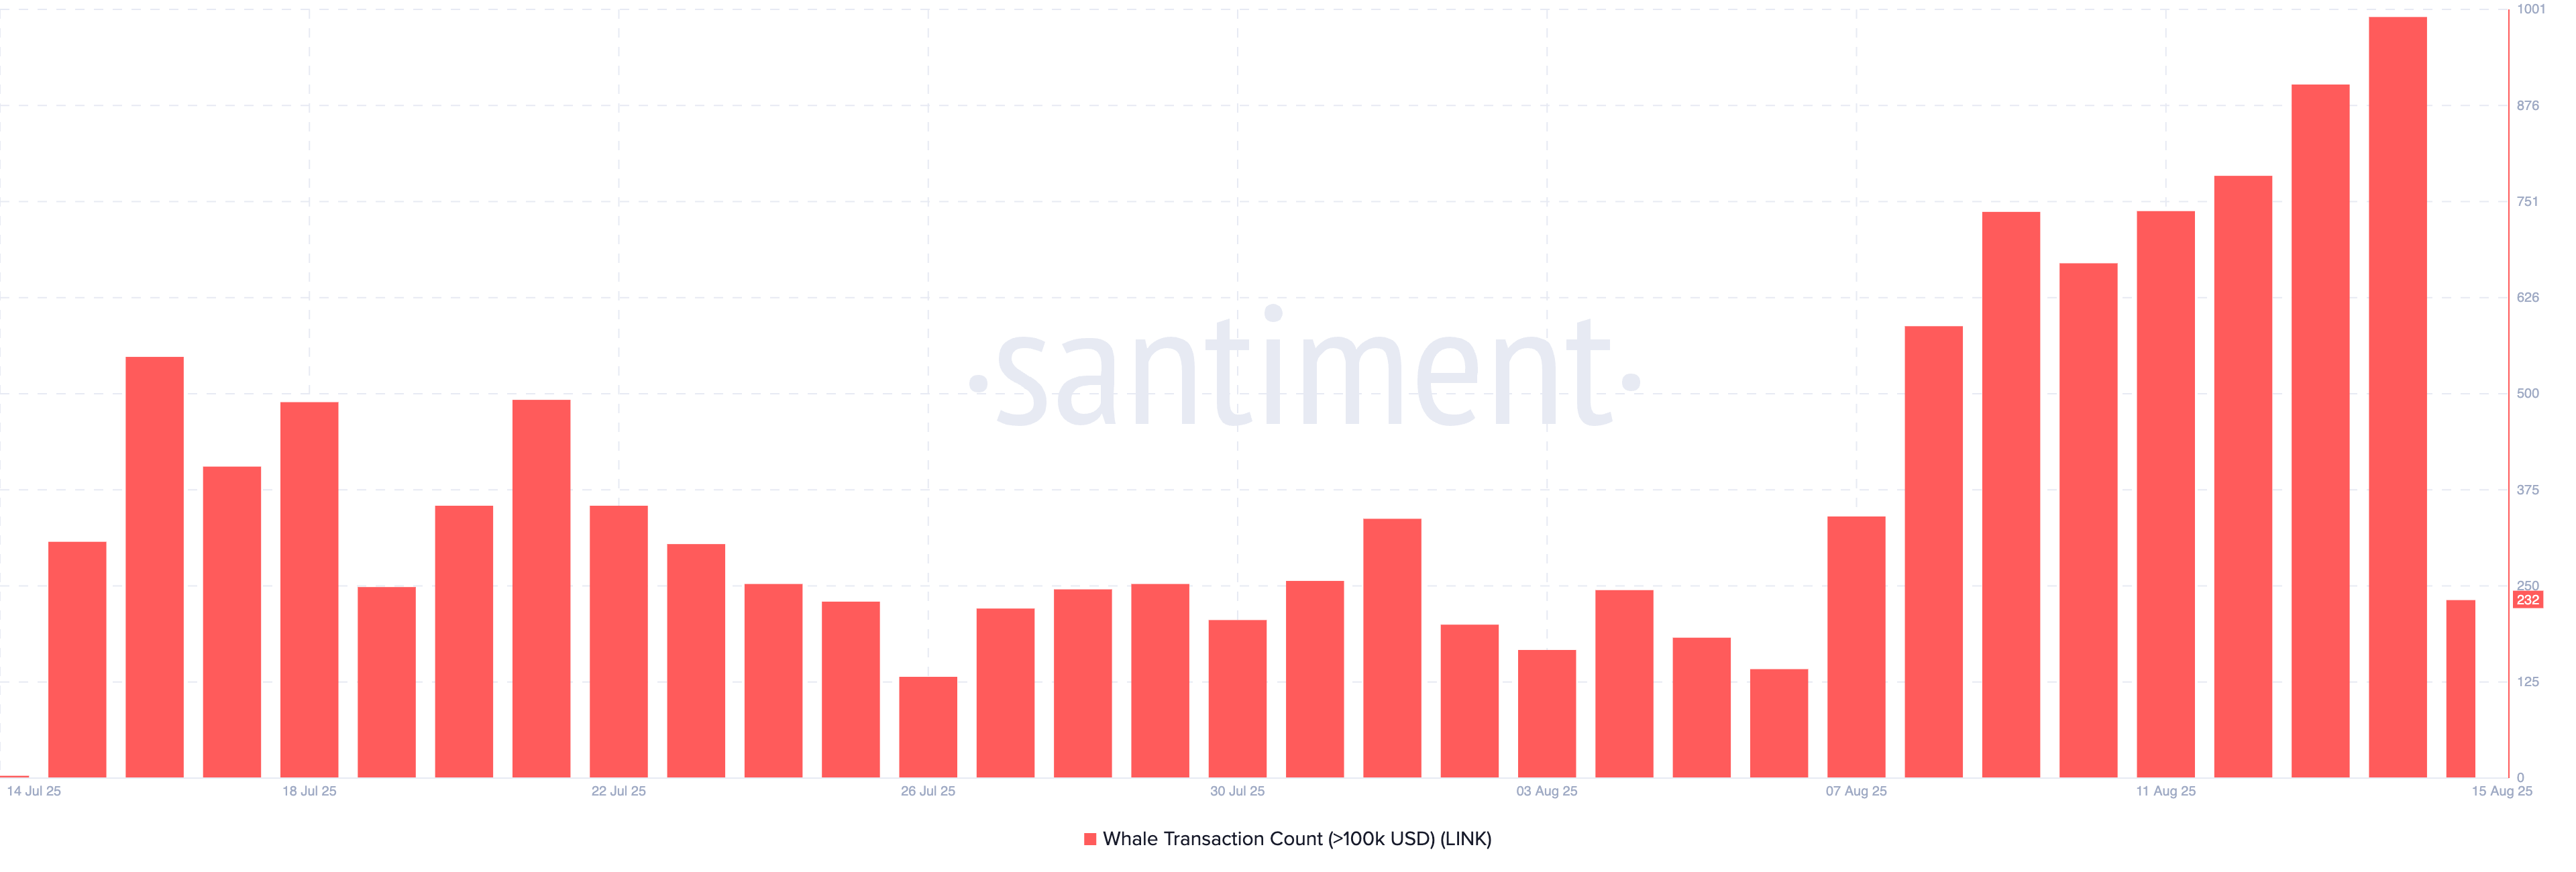
On-chain data has shown that the count of LINK whale transactions exceeding $100,000 soared to a seven-month high of 992 on Thursday.
LATEST: $LINK Rallies Nearly 40% in a Week as Whale Activity Surges
Whale transactions at their highest level in seven months, alongside profits not seen since late 2024.
This uptick in high-value transfers helped drive LINK’s price to a high of $24.31, just 2% shy of the previous day’s close, before easing lower.
As of today, 232 whale transactions worth more than $100,000 have already been recorded. This suggests continued interest from deep-pocketed investors despite today’s broader market consolidation.
For token TA and market updates: Want more token insights like this? Sign up for Editor Harsh Notariya’s Daily Crypto Newsletter here.
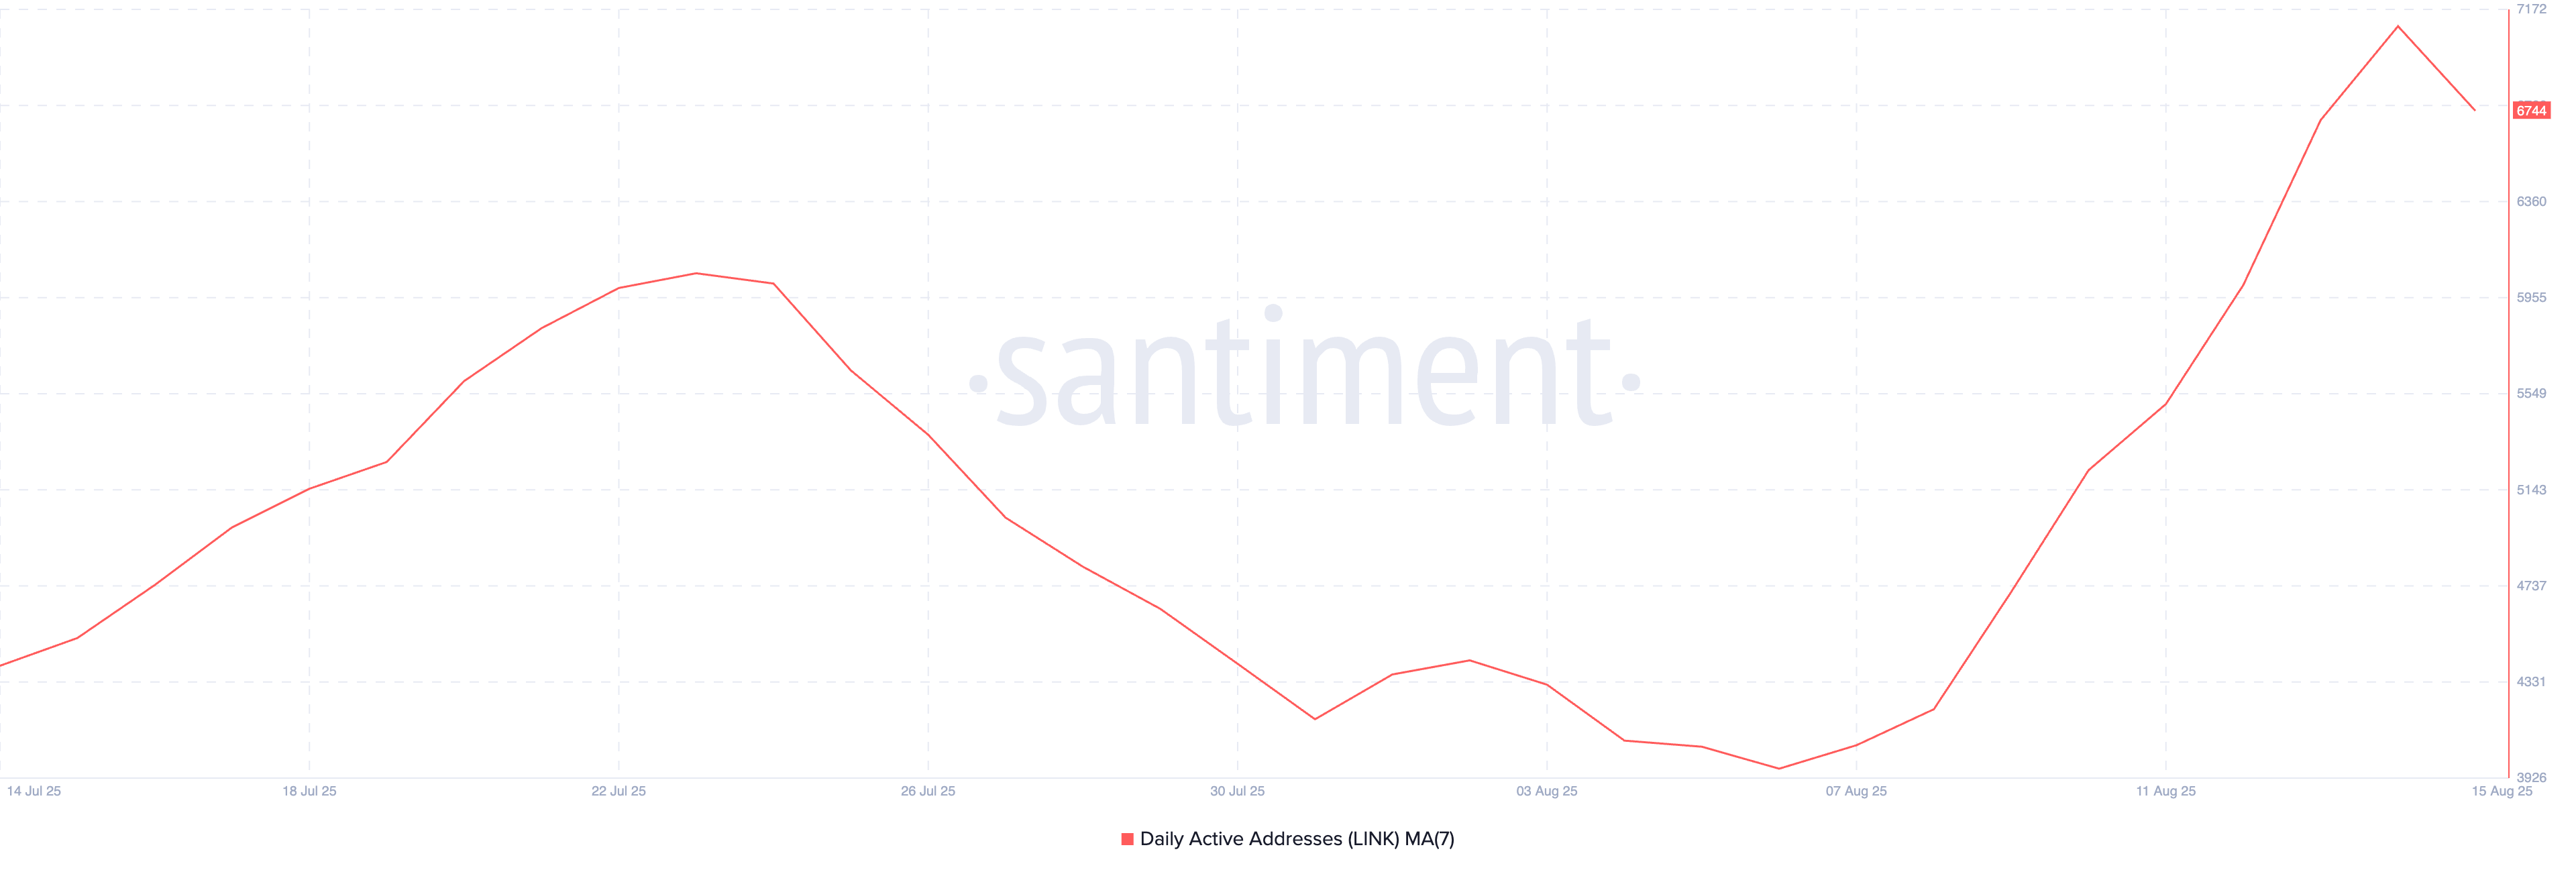
In addition, the number of daily active addresses trading LINK has also trended higher, signaling increased on-chain engagement. Per Santiment, this, observed using a seven-day moving average, has risen by 55% since the beginning of August.
This steady uptick suggests that while whales are active, broader participation from the LINK traders is also growing, confirming climbing interest in the asset despite recent market volatility.
LINK Price Poised for Breakout if $22.21 Support Holds
Higher active address counts reflect stronger network usage on Chainlink. If this trend continues alongside increased whale demand for LINK, it could strengthen the support at $22.21. In this scenario, LINK could rally toward $25.55.
Hedera (HBAR) is showing no signs of slowing down. The token is up over 92% month-on-month, signaling strong bullish momentum. But the story doesn’t end there.
Whale wallets are piling in, funding rates are holding steady, and the price structure shows room for a potential breakout continuation. With multiple legs of support behind this move, HBAR price could be gearing up for more.
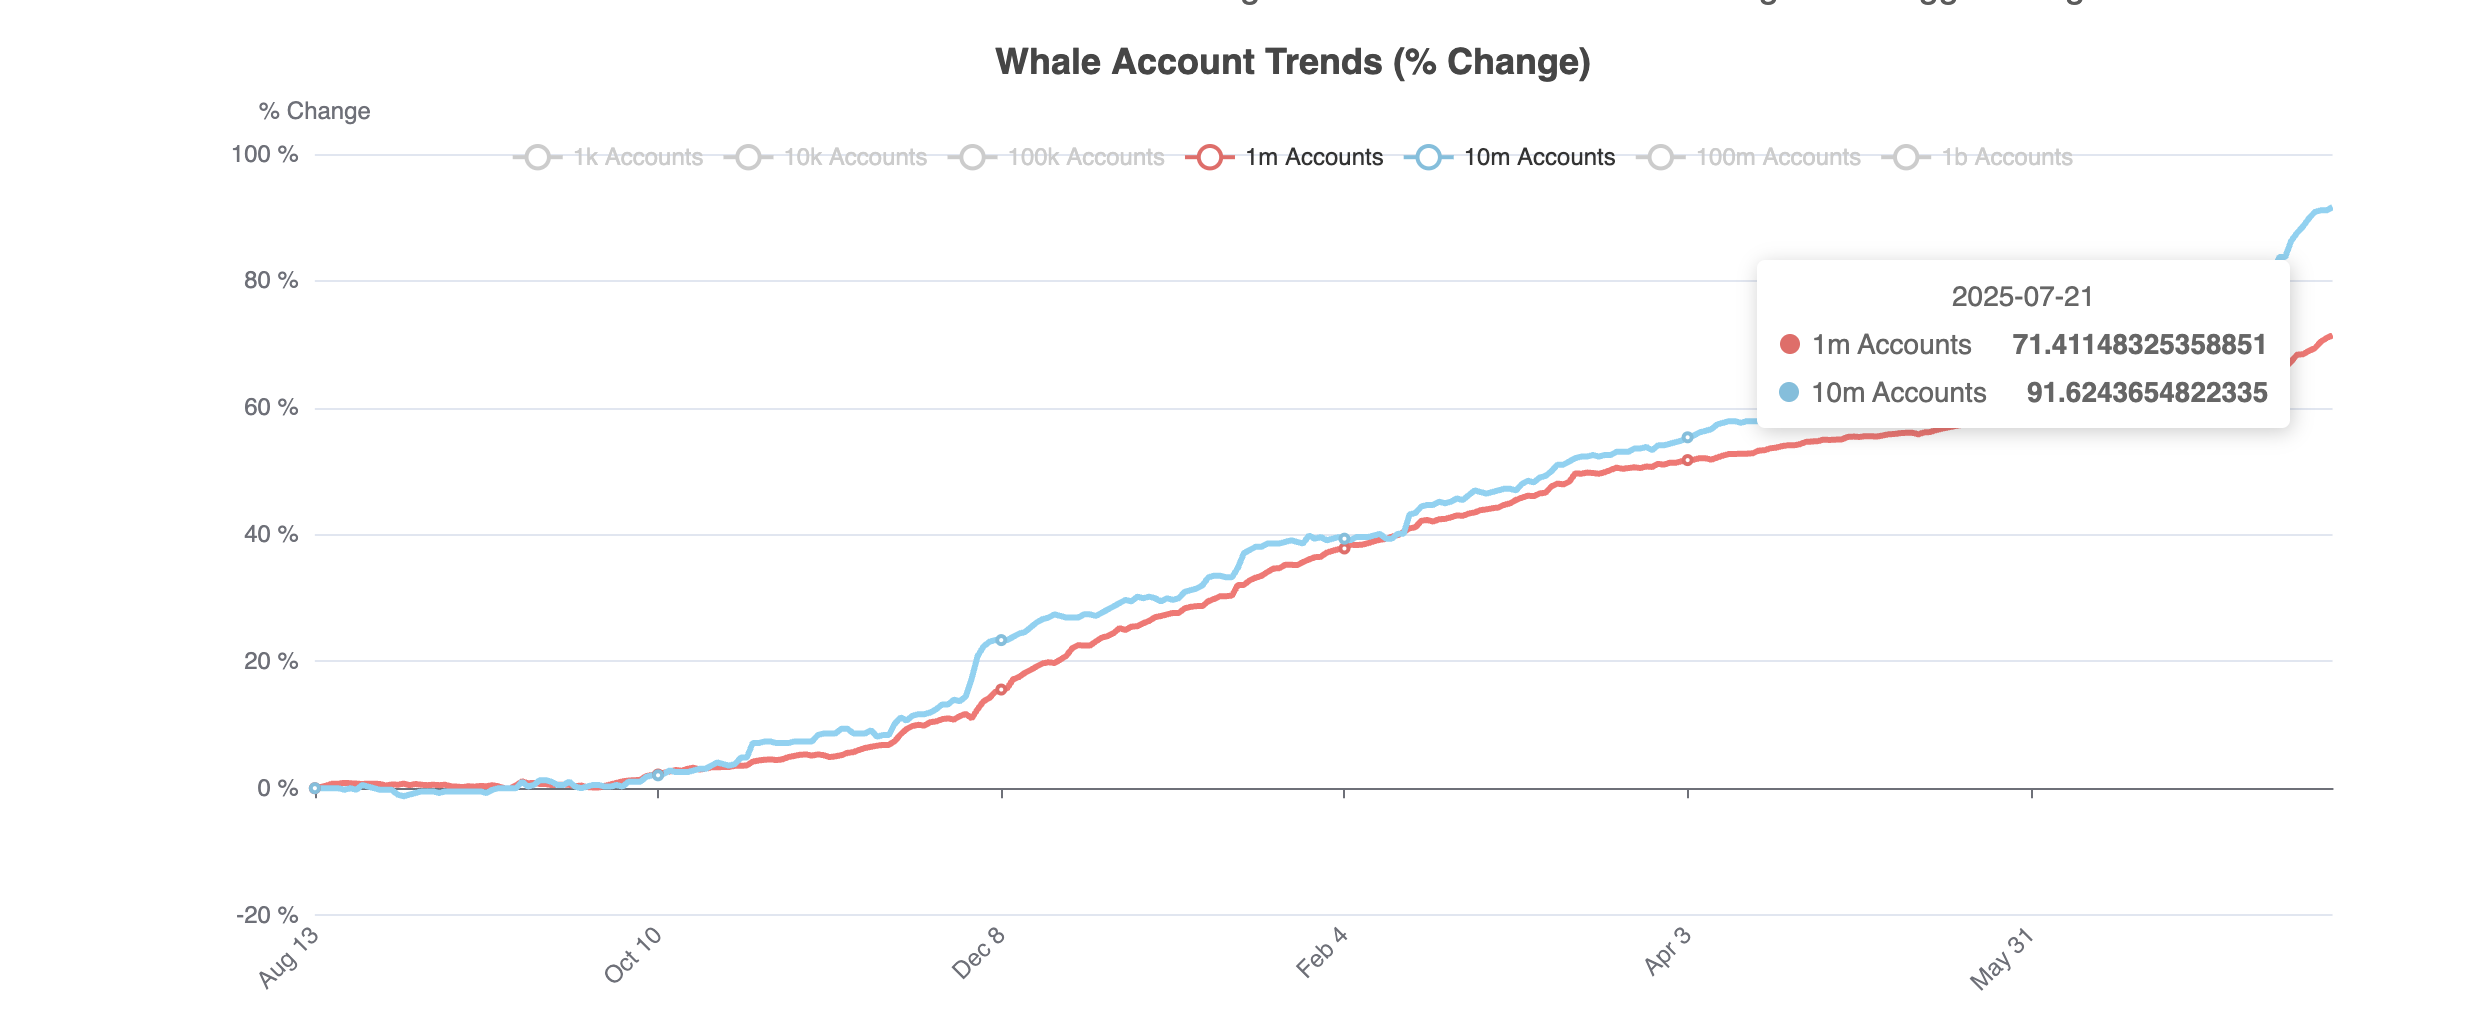
Whale Wallet Surge Signals Confidence
Whale wallets have continued their accumulation spree. Over the past week, the number of wallets holding 1 million HBAR or more rose from 67.28% to 71.41%. Also, wallets with 10 million+ HBAR jumped from 86.29% to 91.62%. That’s a more than 5% rise in a matter of days.
For token TA and market updates: Want more token insights like this? Sign up for Editor Harsh Notariya’s Daily Crypto Newsletter here.
Such a concentrated increase in whale holdings typically reflects growing confidence in near-term price action. It also suggests that larger players are positioning themselves before a potential continuation rally.
Whale wallet data tracks the percentage of supply held by large wallets, helping measure accumulation pressure.
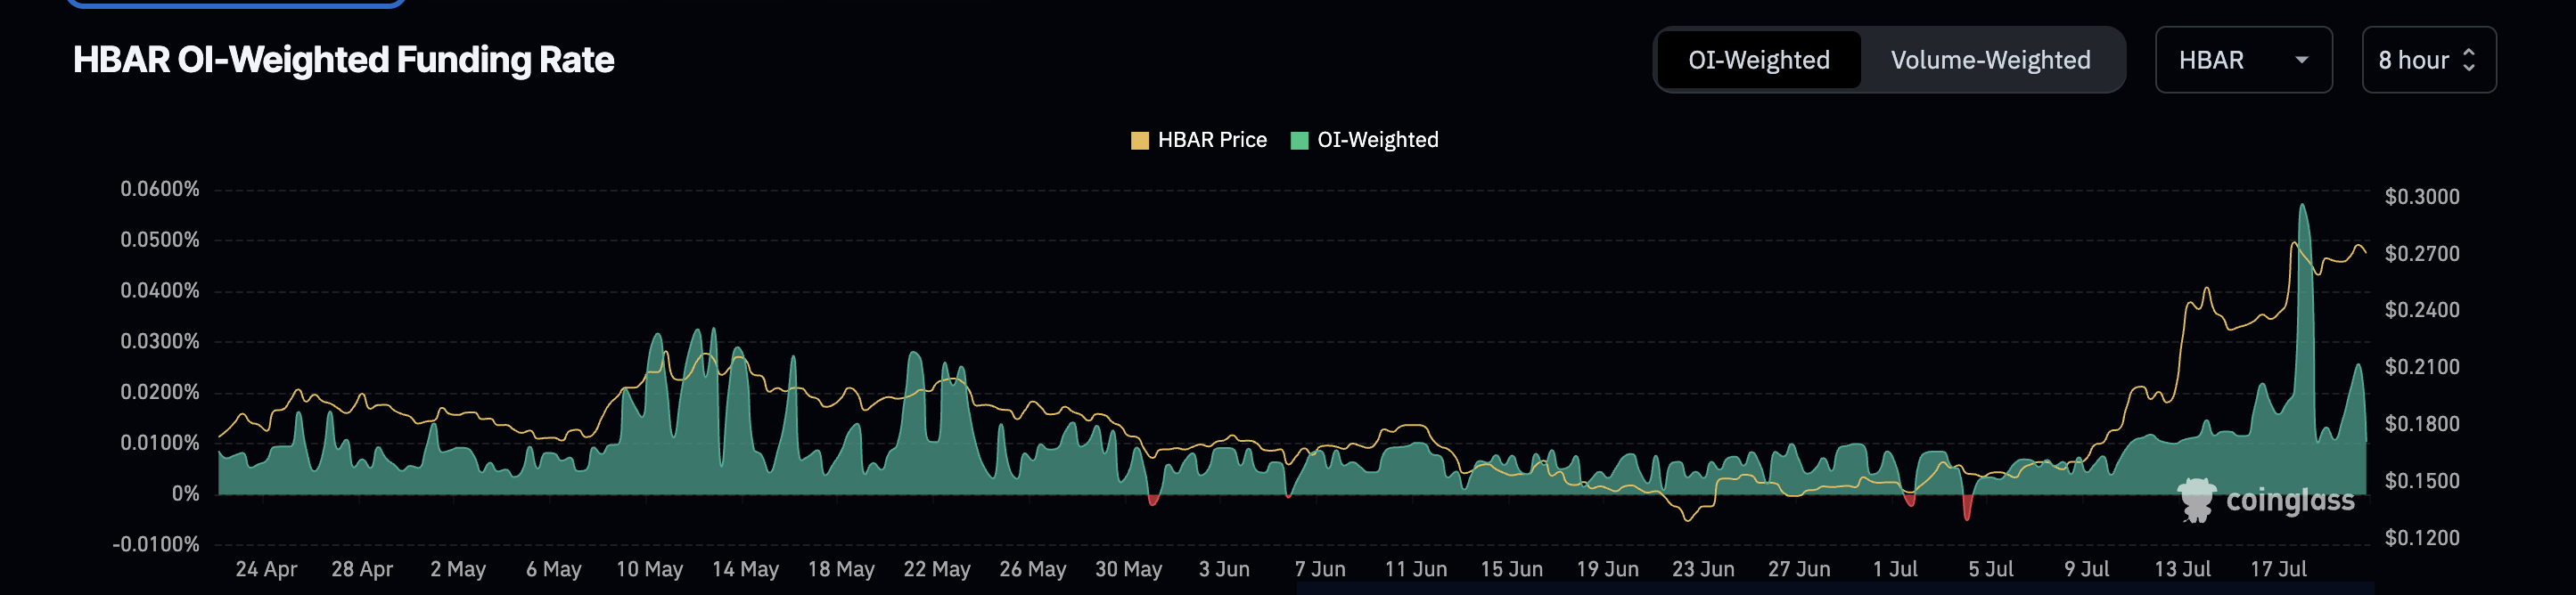
Funding Rate Spikes Show Aggressive Longs
The open interest-weighted funding rate for HBAR reached 0.057% on July 18, its highest level in months. As of July 21, it sits at a still-elevated 0.01%, suggesting that long positions are maintaining their dominance.
This spike in funding rates mirrors HBAR’s recent price rally and implies that leverage is building in favor of bulls. Typically, a rising funding rate indicates aggressive long positioning. It can foreshadow continued upward momentum, especially when backed by whale accumulation.
The good thing here is that the Funding rates (despite being positive) aren’t overheated, suggesting that leveraged positions do not dominate the derivatives market. This pattern keeps the risk of a long squeeze out for now.
A long squeeze occurs when over-leveraged long positions are forced to exit as prices dip, triggering a cascade of liquidations that accelerates the price drop.
Funding rates reflect the cost of holding leveraged long vs. short positions. A positive rate means longs are paying shorts, suggesting bullish sentiment.
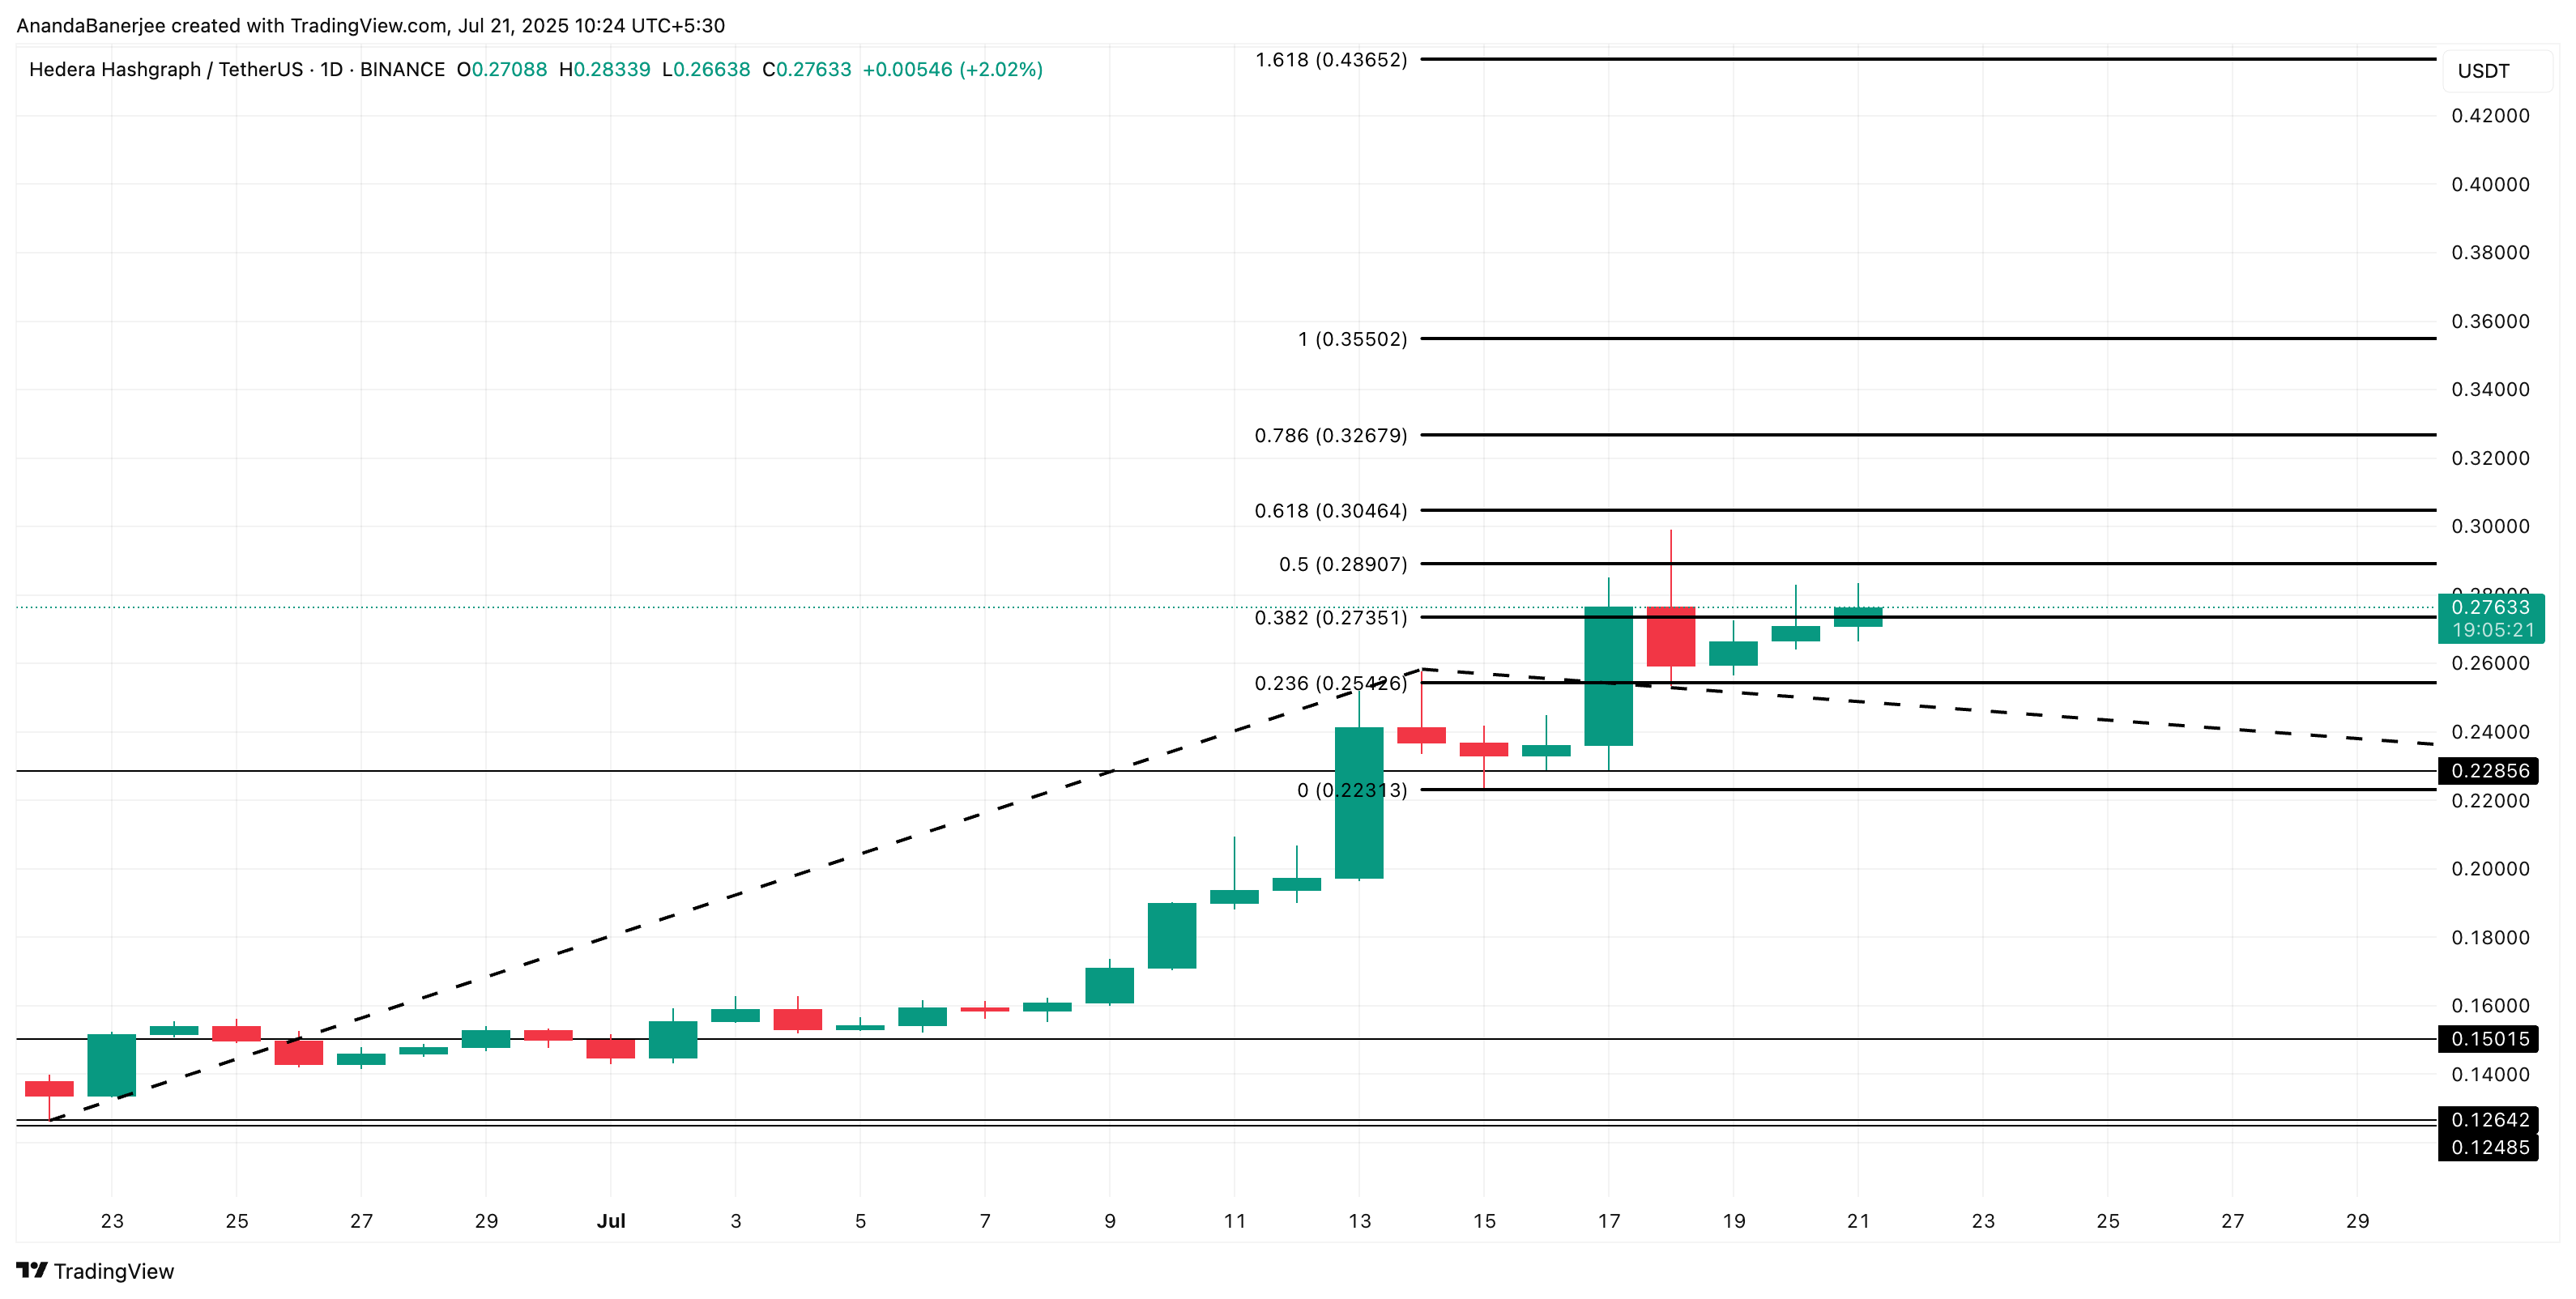
HBAR Price Action Hints at a Breakout Zone
From a technical perspective, HBAR is currently hovering around the 0.382 Fibonacci extension level at $0.27, after cleanly breaking above the 0.236 resistance or the $0.25 price level. This region has acted as a consolidation zone over the past few sessions, with price finding consistent support.
If this level holds, the next resistances lie at $0.28 (0.5 Fib) and $0.30 (0.618 Fib), followed by the $0.32 (0.786 Fib) level. A confirmed breakout from the 0.382 and 0.5 Fib levels could open up the HBAR price path toward $0.35+, which aligns with the 1.0 Fib extension and previous swing highs.
Fibonacci extension levels are used to identify potential targets or resistance zones by utilizing the previous impulse move and a subsequent price retracement. In this price chart, the $0.22 level is used as the retracement zone, as the current swing is still under development.
As $0.25 serves as one of the strongest support levels, a dip below it can invalidate the bullish trend for now. Also, if the HBAR price corrects below $0.22, the short-term trend might not remain bullish anymore.
Bitget, the leading cryptocurrency exchange and Web3 company, has released its 2025 Anti-Scam Research Report in partnership with blockchain security firms SlowMist and Elliptic.
The report reveals that global crypto scam losses surged to $4.6 billion in 2024, with deepfake technology and social engineering emerging as the dominant tactics behind high-value thefts. The publication marks the official launch of Bitget’s Anti-Scam Month, a month-long initiative dedicated to security education and ecosystem-wide awareness.
The report highlights how AI-powered scams have moved beyond phishing emails to include fake Zoom calls, synthetic videos of public figures, and Trojan-laced job offers. Among its key findings, the report identifies three primary scam categories—deepfake impersonation, social engineering schemes, and Ponzi-style projects cloaked in DeFi or NFT branding—as the leading causes of user loss. It also outlines how stolen funds are funneled through cross-chain bridges and obfuscation tools before reaching mixers or exchanges, complicating enforcement and recovery efforts.
Additional insights include case studies from major scam incidents in Hong Kong, the rising use of Telegram and X (Twitter) comment sections as phishing entry points, and the continued growth of professionally run fraud rings operating across borders.
“The biggest threat to crypto today isn’t volatility—it’s deception. That’s why Bitget has designated the entire month of June as Anti-Scam Month—an initiative to elevate industry standards and user awareness. This report is the flagship release within that effort. AI has made scams faster, cheaper, and harder to detect. At Bitget, we believe fighting back requires both technological rigor and ecosystem-wide collaboration. Our goal is to help users trade smarter, not just faster.” said Gracy Chen, CEO at Bitget.
The report also details how Bitget’s Anti-Scam Hub, innovative detection systems, and a $500M+ Protection Fund are being actively deployed to mitigate user risks. SlowMist provided detailed forensic insights into scam tactics, ranging from address poisoning to job offer Trojans, while Elliptic examined the laundering patterns of stolen cryptocurrency through cross-chain bridges and mixer platforms.
“Criminals are constantly evolving their methods of attack, using AI and finding new ways to scale their activities. This means that reciprocally, we are also working to scale our technology and blockchain capabilities to track and identify the new methods criminals are using. Our work with Bitget reflects a shared urgency to expose these evolving threats and give users the tools to protect themselves,” said Arda Akartuna, Lead Crypto Threat Researcher, Elliptic, APAC.
“This report reflects the real-world patterns we’re seeing on-chain every day. From phishing rings to fake staking dApps, the tactics may change—but the psychology is always the same. Users must be informed, skeptical, and security-minded at all times,” said Lisa, Security Operations Lead, SlowMist.
The report closes with actionable recommendations for both users and institutions, including scam red flag indicators and best practices for avoiding common traps in DeFi, NFT, and Web3 environments.
Established in 2018, Bitget is the world’s leading cryptocurrency exchange and Web3 company. Serving over 120 million users in 150+ countries and regions, the Bitget exchange is committed to helping users trade smarter with its pioneering copy trading feature and other trading solutions, while offering real-time access to Bitcoin price, Ethereum price, and other cryptocurrency prices.
Formerly known as BitKeep, Bitget Wallet is a leading non-custodial crypto wallet supporting 130+ blockchains and millions of tokens. It offers multi-chain trading, staking, payments, and direct access to 20,000+ DApps, with advanced swaps and market insights built into a single platform. Bitget is at the forefront of driving crypto adoption through strategic partnerships, such as its role as the Official Crypto Partner of the World’s Top Football League, LALIGA, in EASTERN, SEA and LATAM markets, as well as a global partner of Turkish National athletes Buse Tosun Çavuşoğlu (Wrestling world champion), Samet Gümüş (Boxing gold medalist) and İlkin Aydın (Volleyball national team), to inspire the global community to embrace the future of cryptocurrency.
Risk Warning: Digital asset prices are subject to fluctuation and may experience significant volatility. Investors are advised to only allocate funds they can afford to lose. The value of any investment may be impacted, and there is a possibility that financial objectives may not be met, nor the principal investment recovered. Independent financial advice should always be sought, and personal financial experience and standing carefully considered. Past performance is not a reliable indicator of future results. Bitget accepts no liability for any potential losses incurred. Nothing contained herein should be construed as financial advice. For further information, please refer to our Terms of Use.
As July comes to an end, several significant developments in the Bitcoin (BTC) market have emerged. Notably, profit-taking pressure has resurfaced in the final week of the month, raising concerns about a potential turning point in August.
Based on analysis from market experts and on-chain data, four main sources of selling pressure could soon shape Bitcoin’s trajectory. Let’s explore each factor in detail.
1. Profit-Taking from Reawakened “Dormant Whale” Wallets
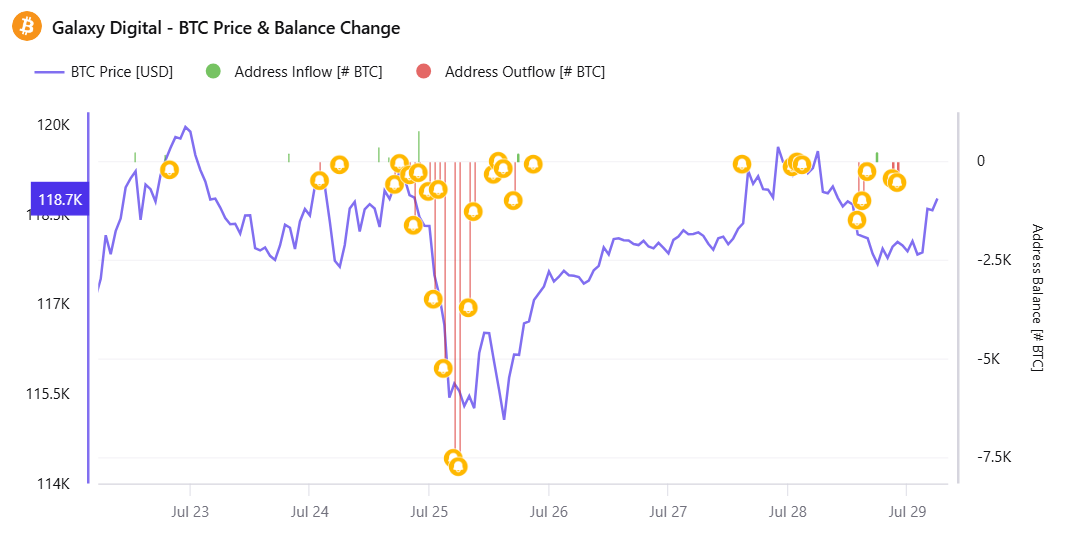
Bitcoin price and inflow/outflow activity from the Galaxy Digital wallet. Source: CryptoQuant
CryptoQuant data shows that large outflows from Galaxy Digital wallets often coincide with Bitcoin price corrections. On July 29, LookonChain continued to detect more outflows, sparking fears of another sell-off.
“Is Galaxy Digital helping clients sell BTC again? In the past 12 hours, Galaxy Digital has transferred out another 3,782 BTC ($447 million), most of which went to exchanges,” LookonChain reported.
Moreover, BeInCrypto reported that two additional dormant wallets—inactive for 6 to 14 years—have become active. SpotOnChain recently reported three dormant whale wallets, possibly tied to a single entity, that moved 10,606 BTC ($1.26 billion) after 3–5 years of inactivity.
An increasing number of awakened whale wallets appear to add selling pressure heading into August.
2. Signs of Selling Pressure from Long-Term Holders
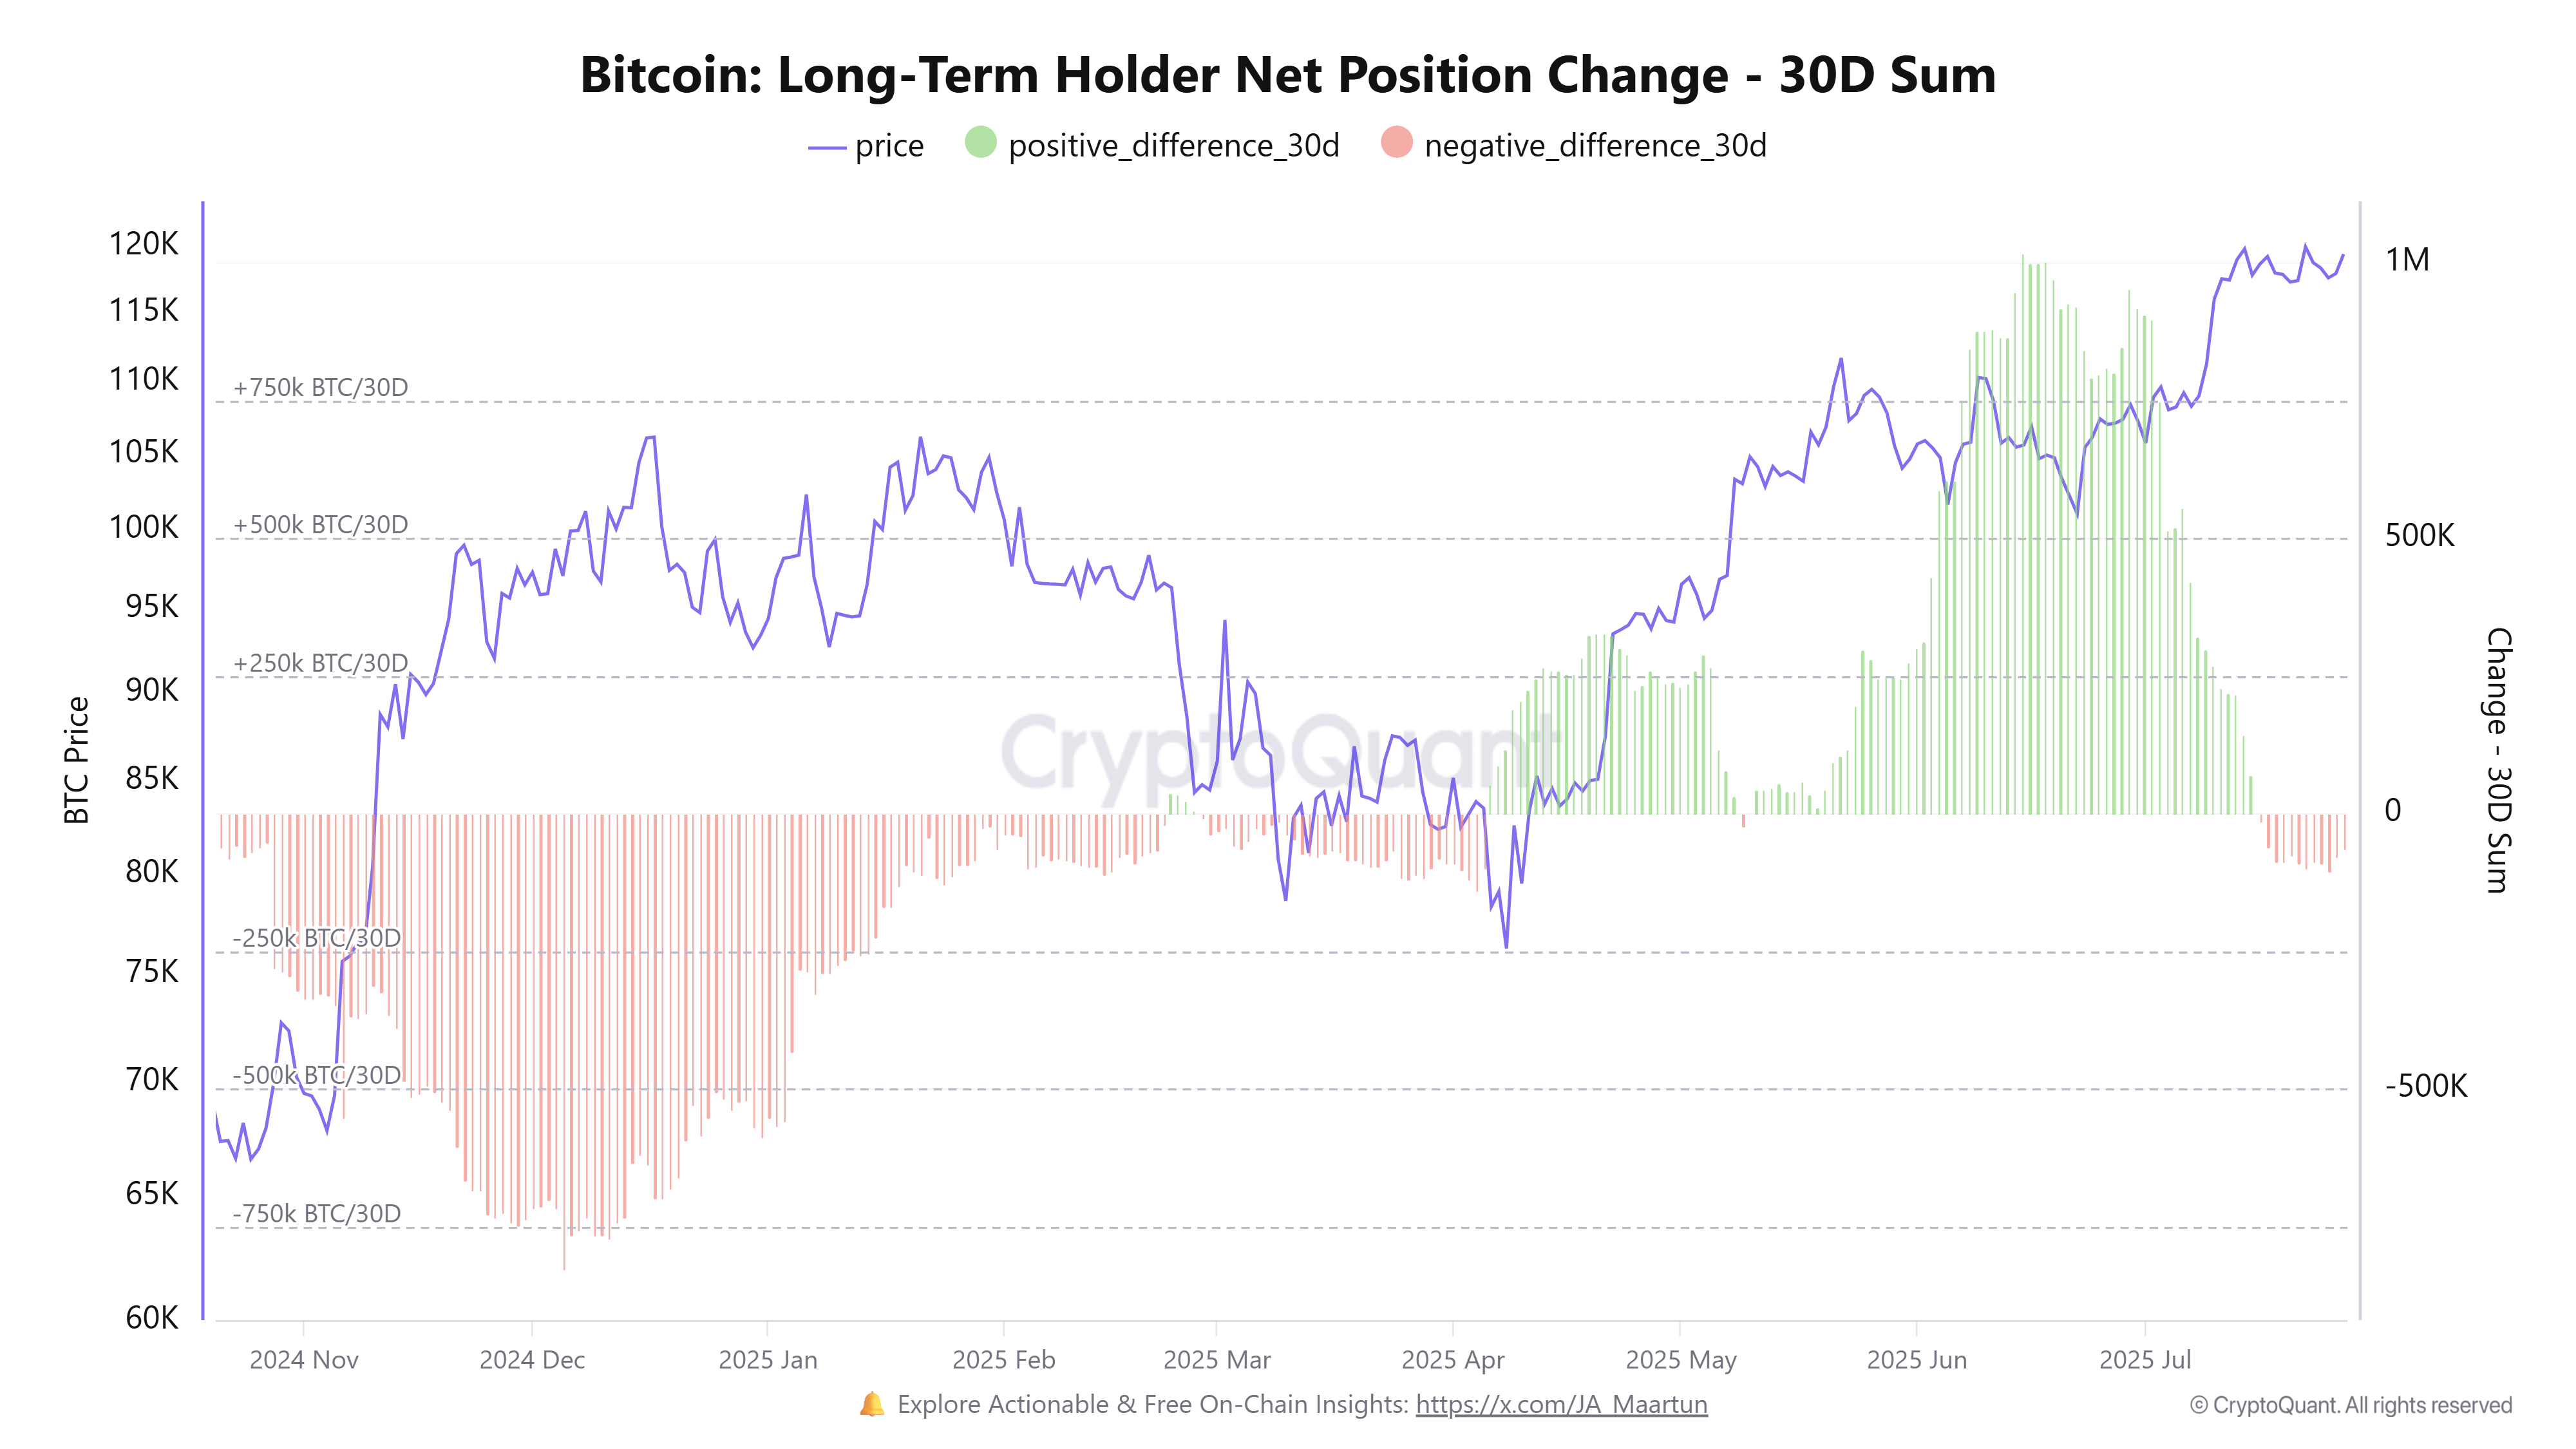
The second source of selling pressure is from Long-Term Holders (LTHs), who are often considered the backbone of the Bitcoin market.
According to a CryptoQuant report, LTHs began withdrawing funds as BTC hovered around the $120,000 mark at the end of July. This behavior may reflect a cautious mindset, where many investors prefer to lock in profits rather than continue holding through potential volatility.
Bitcoin Long-Term Holder Net Position Change. Source: CryptoQuant
“Long-term holders (LTHs) have started to turn net negative right at the $120K resistance — a historically important psychological level. This shift suggests that some investors who’ve held through previous cycles might be starting to realize profits,” analyst Burakkesmeci noted.
In Q1 2025, negative net positions from long-term holders helped drag BTC below $75,000. If this group continues to sell, it could create significant selling pressure, increasing the risk of a strong correction in August.
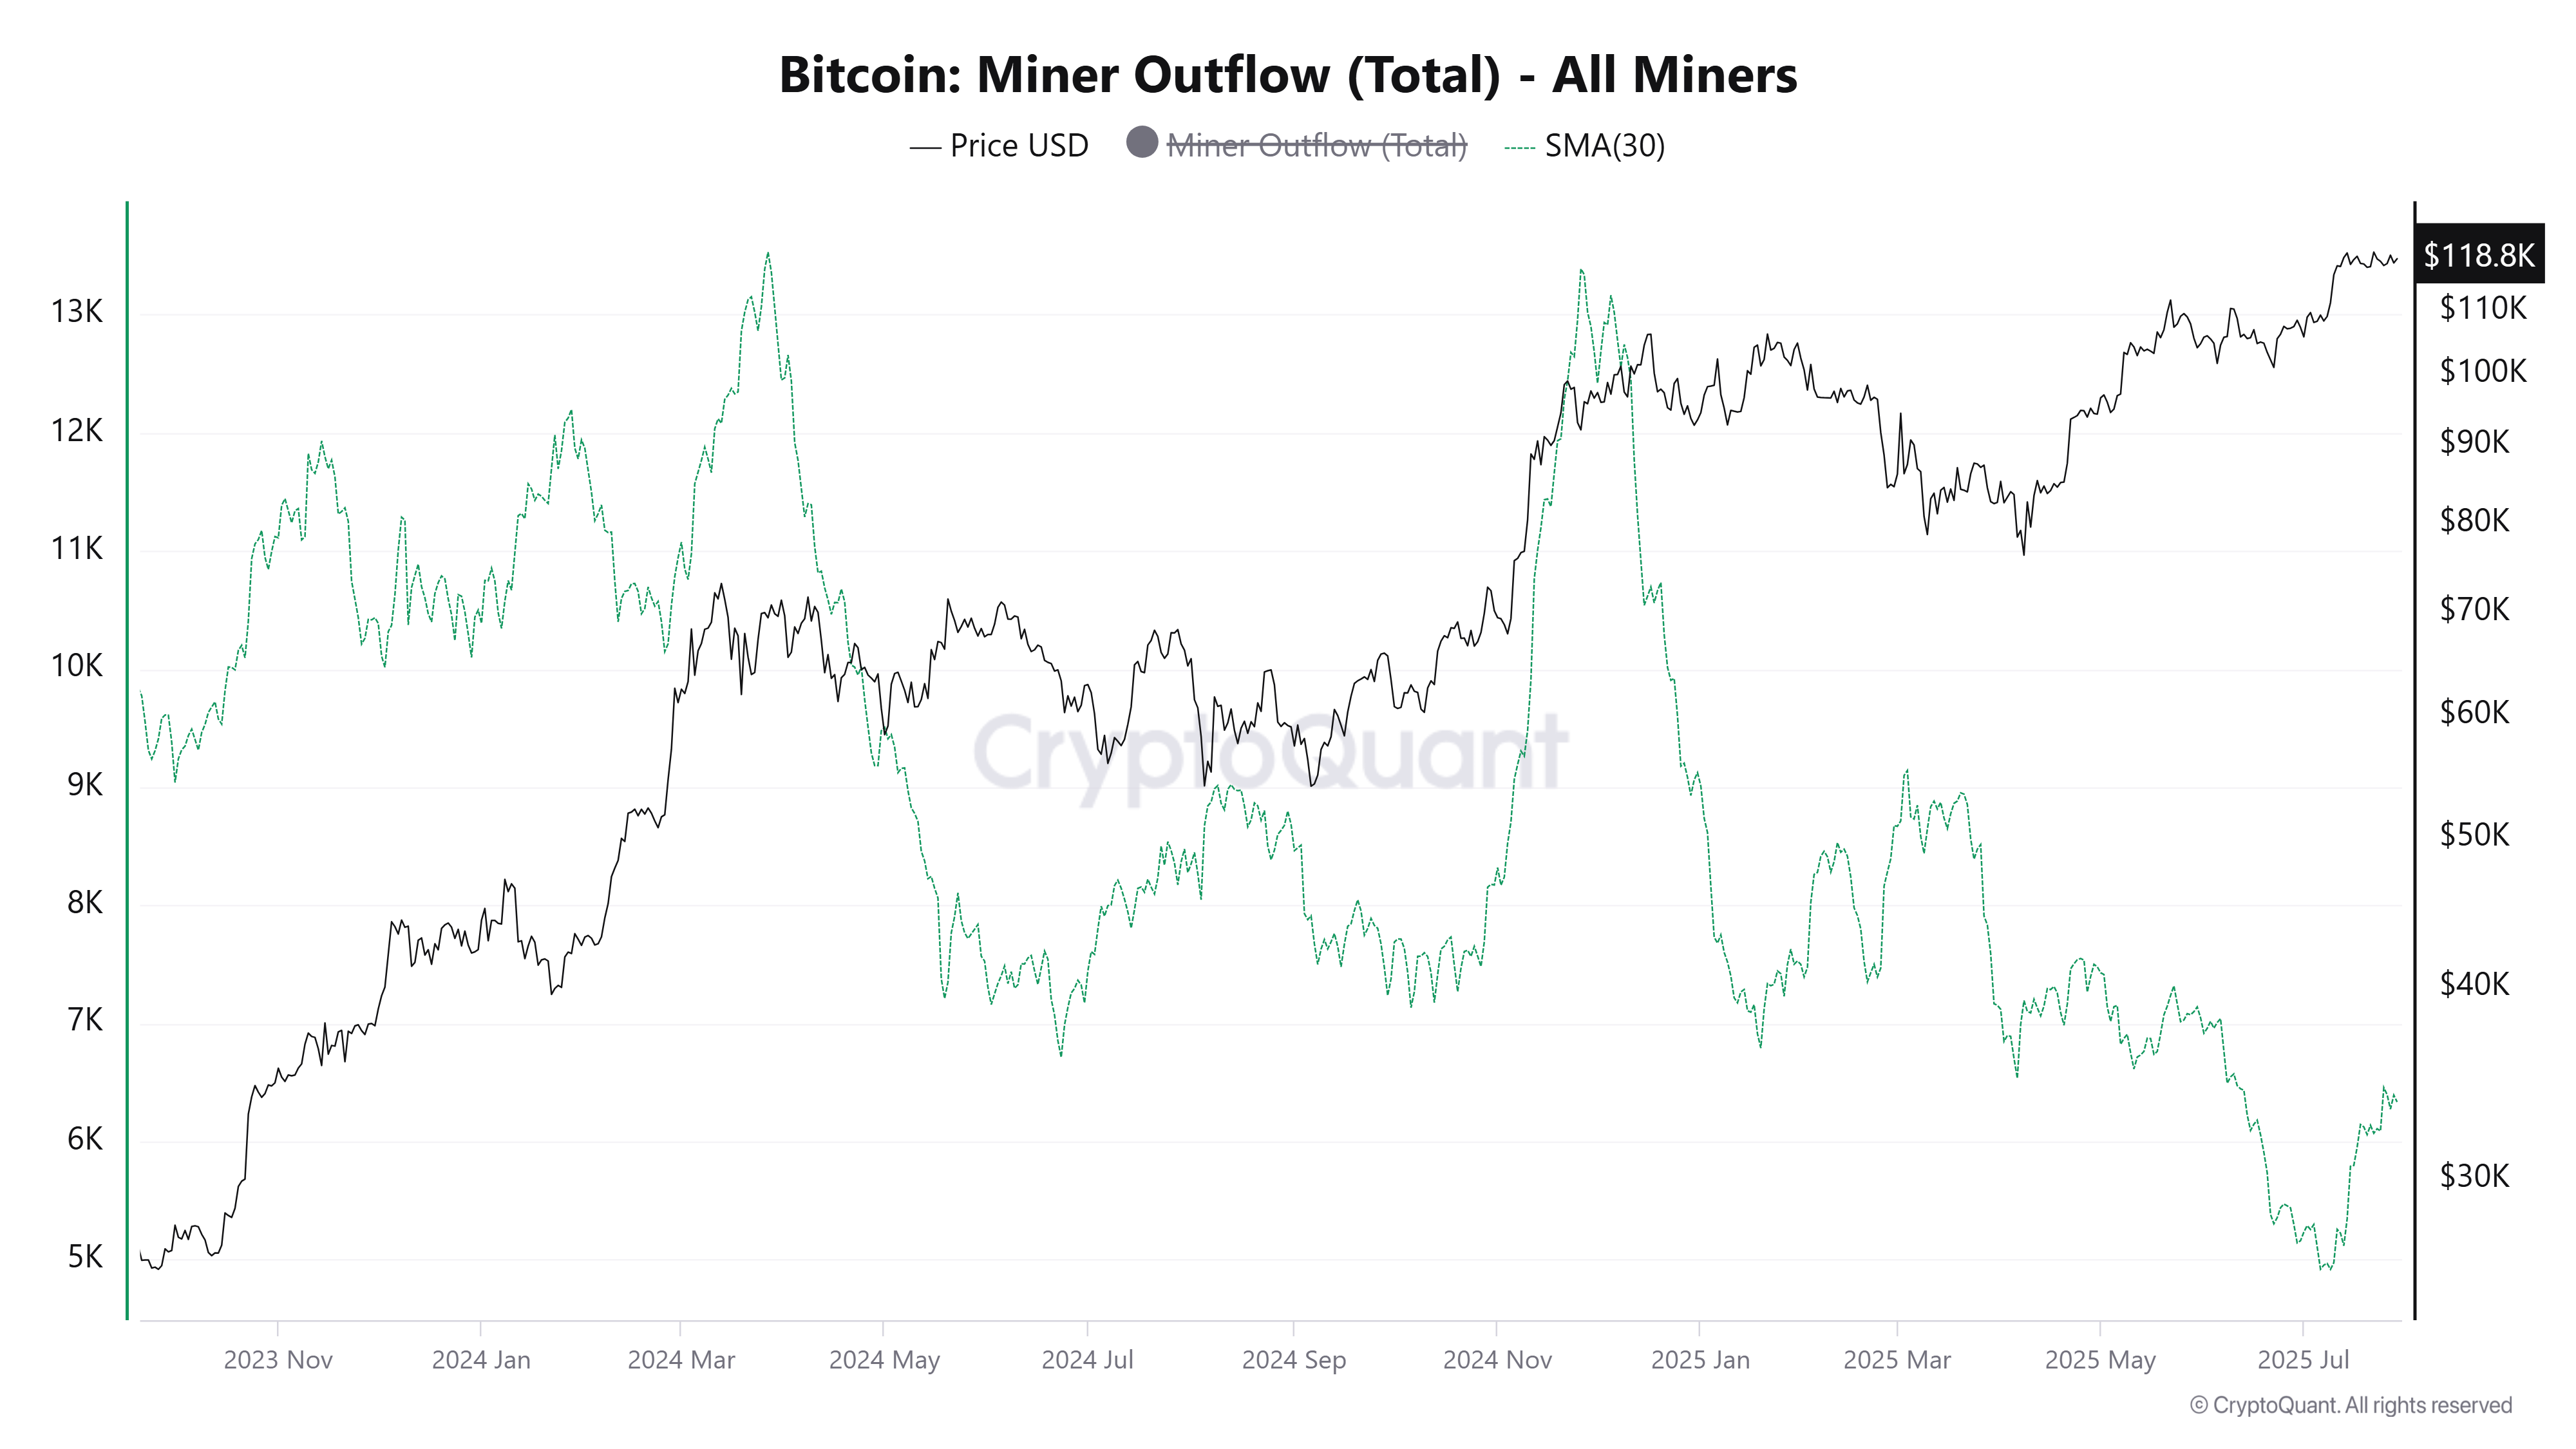
3. Miner Outflows Are Increasing
The third factor is rising miner outflows — a key indicator of selling pressure from Bitcoin miners.
CryptoQuant data shows that throughout July, BTC outflows from miner wallets started climbing again after a period of decline. This shift marks a possible trend reversal.
Miners often sell when they need liquidity to cover operational costs or when they want to lock in profits after a price rally. If this trend continues, it could amplify selling pressure, especially when combined with the activity from whales and long-term holders.
“The mean amount of coins per transaction sent from affiliated miners’ wallets. If miners send some proportion of their reserves at the same time, it could trigger a price drop,” CryptoQuant explained.
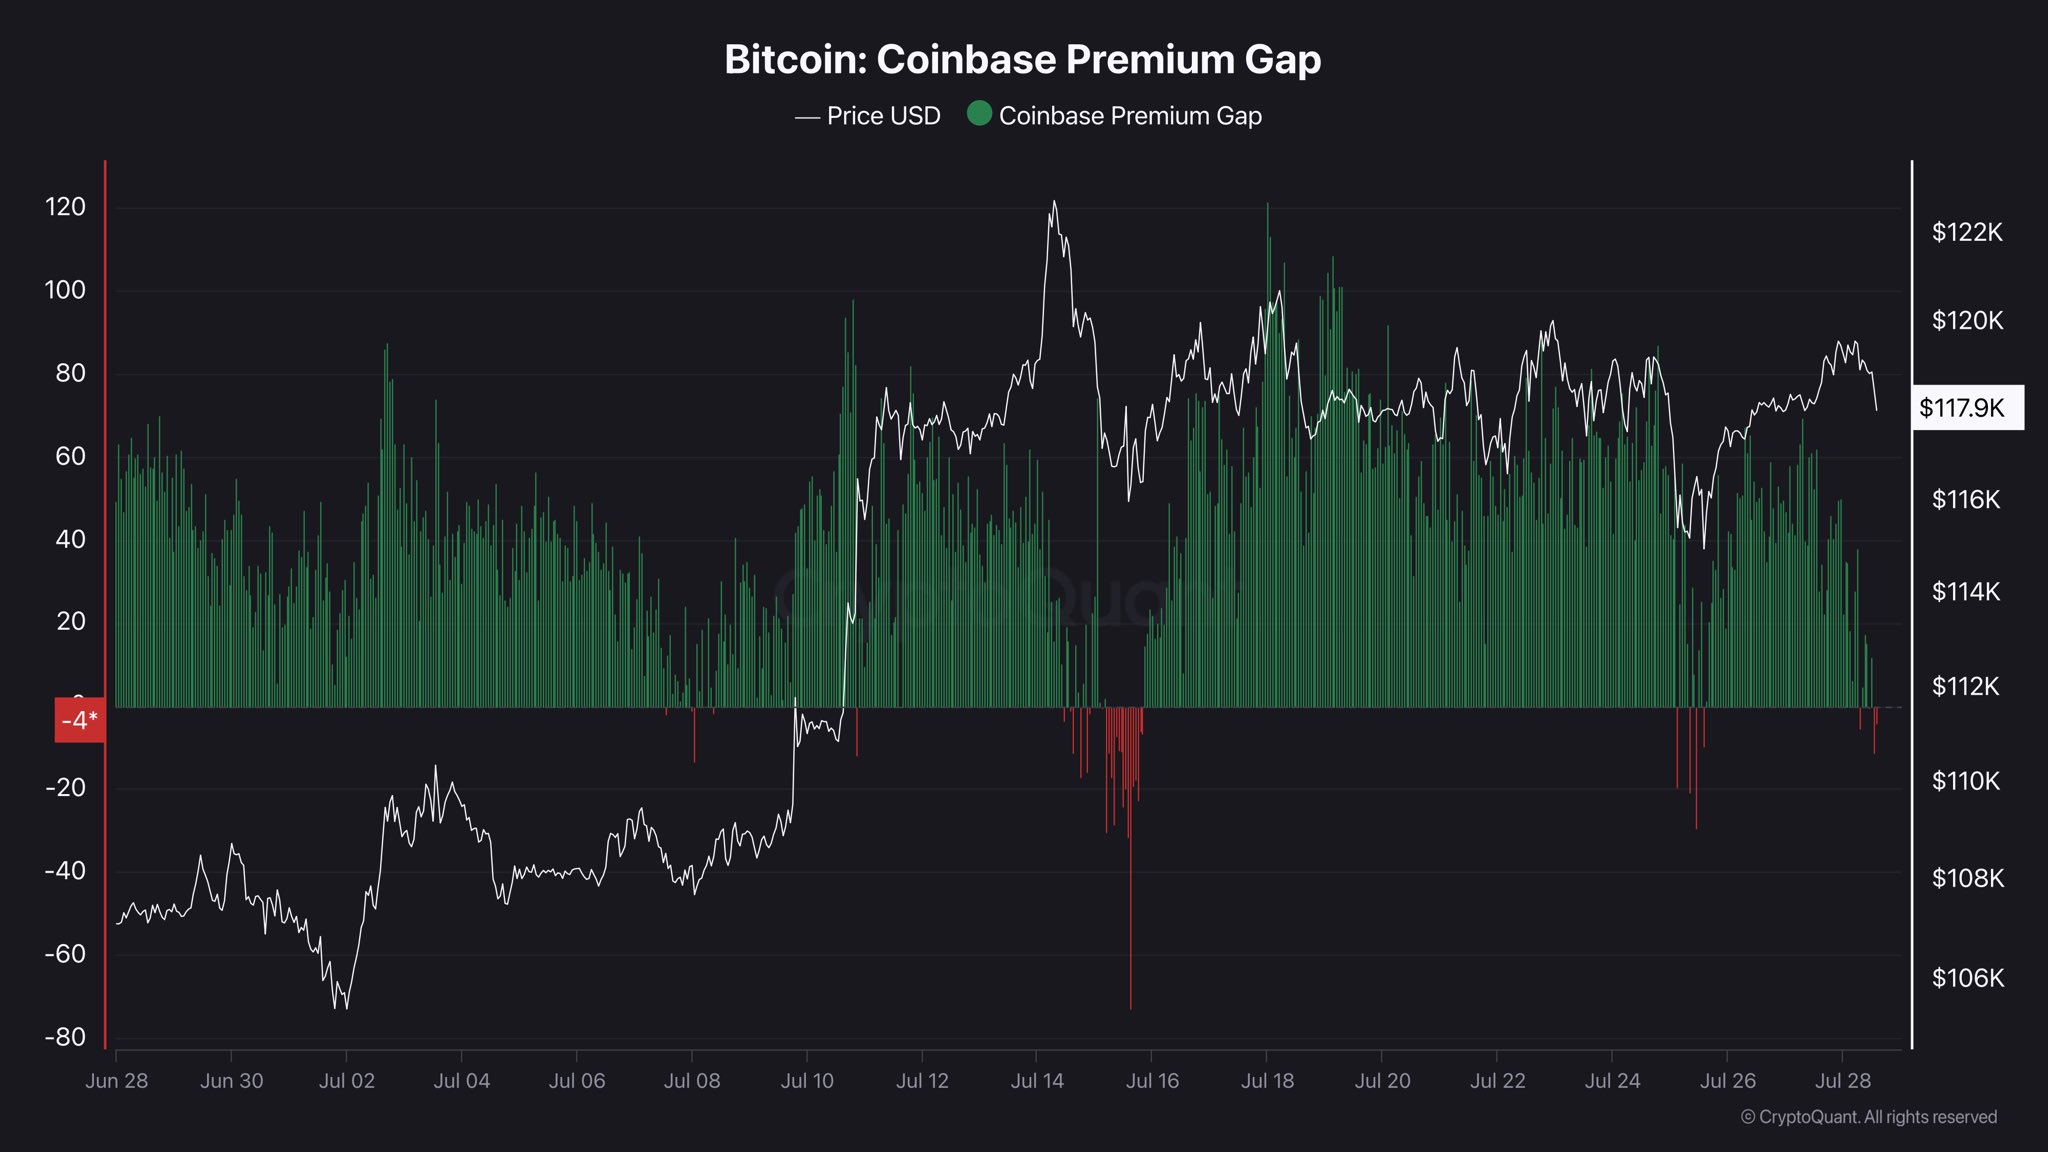
4. Selling Pressure from the US Investors
The Coinbase Premium indicator reflects the price gap between Coinbase and Binance. A negative premium means Bitcoin trades at a lower price on Coinbase, indicating weaker demand or stronger selling pressure in the US market.
This indicator essentially represents the behavior of US investors. Although it remained mostly positive, it turned negative at the end of July.
“Bitcoin Coinbase Premium Gap turned negative again. What does it mean? The demand in the US market is weakening. Caution is necessary,” analyst IT Tech commented.
Historically, a negative premium hasn’t always led to a trend reversal. However, it often signals a slowdown in upward momentum. If selling pressure continues to build, a negative outcome could unfold.
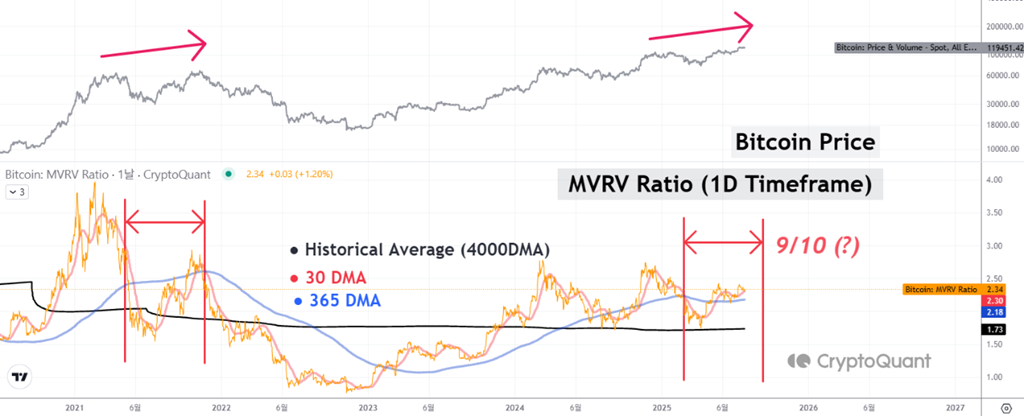
A Reversal Signal from the MVRV Ratio in August
Some analysts are adopting a more cautious stance for August, especially after Bitcoin recorded four straight months of gains.
According to Coinglass statistics, Q3 is historically the weakest quarter of the year. August, in particular, is often the worst-performing month within Q3.
CryptoQuant analyst Yonsei pointed out that the MVRV (Market Value to Realized Value) ratio is approaching a cycle-top threshold. This signal may appear by late August.
During the 2021 cycle, the MVRV ratio formed a double top that accurately predicted the market peak. If history repeats, August could mark Bitcoin’s local top before entering a correction or consolidation phase.
“In short, we’re entering a zone where optimism and caution must coexist. Let on-chain timing guide your strategy — now is the time to tighten risk management and stay nimble,” Yonsei concluded.
“However, the strong liquidity profile, matched with the market’s ability to handle large orders and growing demand from treasury companies, indicates the presence of sophisticated traders. These traders are more price agnostic, which should bode well for BTC’s price action heading into what can be a choppy month,” Kaiko stated.
Although whales, LTHs, and miners may trigger volatility, the current market structure could prevent a severe collapse.


LATEST: $LINK Rallies Nearly 40% in a Week as Whale Activity Surges

Whale transactions at their highest level in seven months, alongside profits not seen since late 2024.