On-chain data analysis shows the overall demand for Chainlink by whale investors has gradually increased in the last week.
LINK price has depicted a high correlation with BTC price in the past 30 days, amid rising bullish sentiment.
Chainlink (LINK) price has been battling short-term bearish sentiment after recording an impressive bullish breakout in April 2025. The mid-cap altcoin, with a fully diluted valuation of about $13.4 billion and a 24-hour average trading volume of about $261 million, had dropped around 9 percent in the last seven days to trade at $13.43 on Tuesday, May 6, during the late North American trading session.
However, the gradual rebound of LINK’s Futures Open Interest (OI) to about $583 million at the time of this writing, signals the rerun of robust bullish sentiment.
Robust Fundamentals for Chainlink Network
The Chainlink Network has grown significantly in the past year bolstered by the mainstream adoption by institutional investors. As Coinpedia reported, the Chainlink network reports more than a dozen DeFi integrations to its products. Moreover, the Chainlink ecosystem offers reliable on-chain oracle data to enable scalable development of web3 protocols.
For instance, AAVE’s GHO has grown by over 530 percent since adopting Chainlink’s cross-chain token standard to over $210 million.
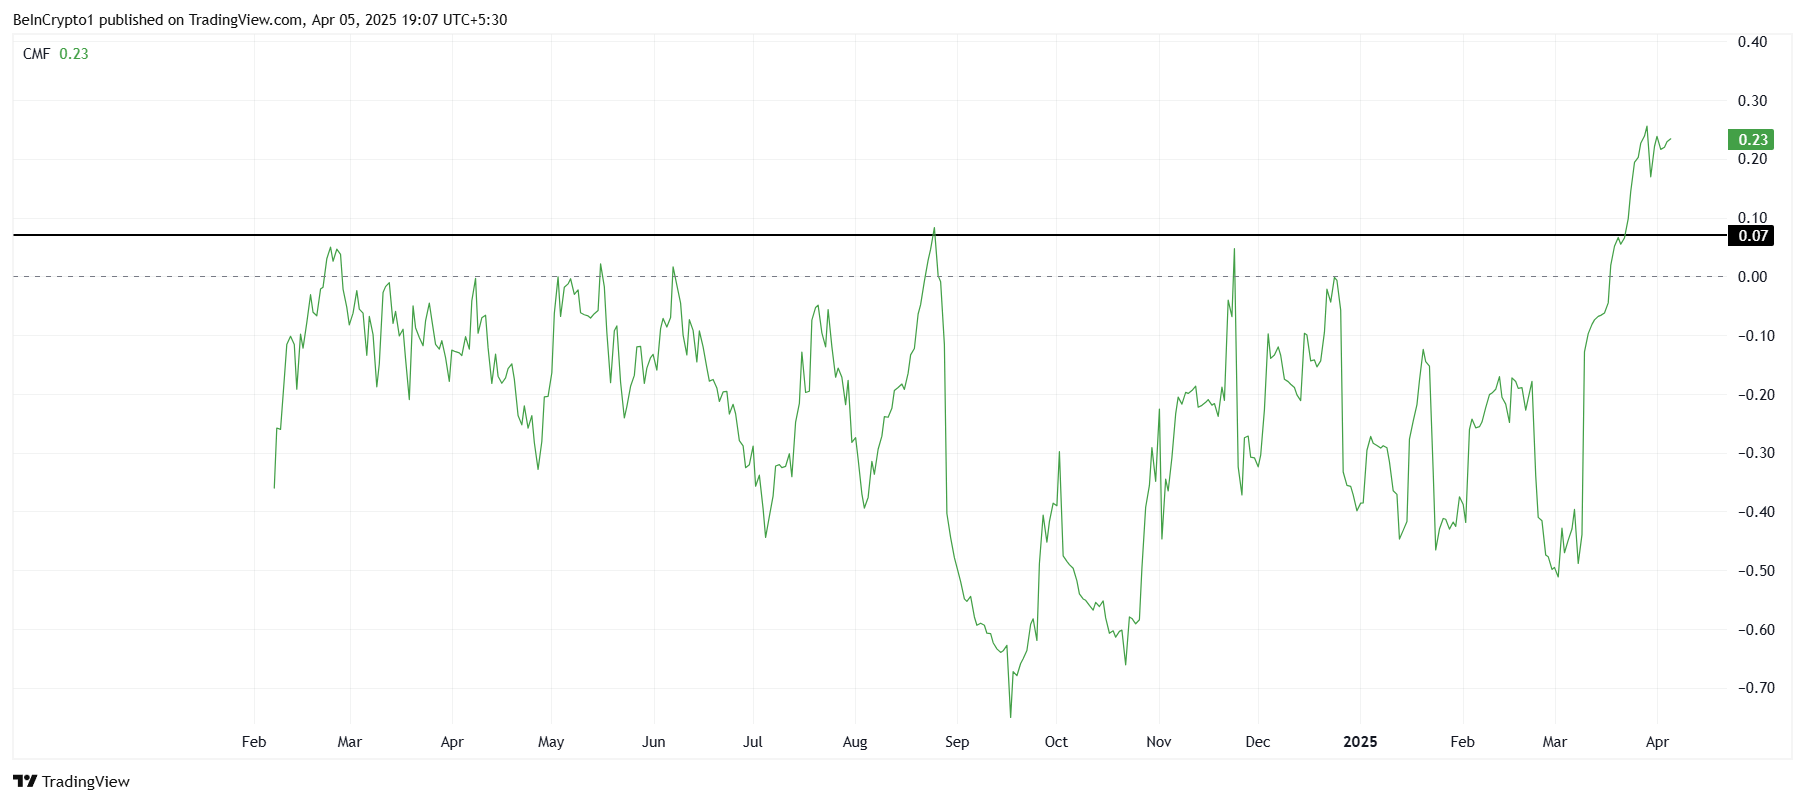
Meanwhile, on-chain data analysis from IntoTheblock shows that the Chainlink network recorded a $348.15 billion surge in large transaction volume during the past 30 days.
Midterm Expectations for LINK Price
In the four-hour timeframe, Chainlink’s price has been forming a bullish continuation pattern, characterized by a falling wedge in a rising market. At the time of this writing, LINK price had not confirmed a bullish breakout from the rising wedge, but the mounting pressure signals an imminent breakout.
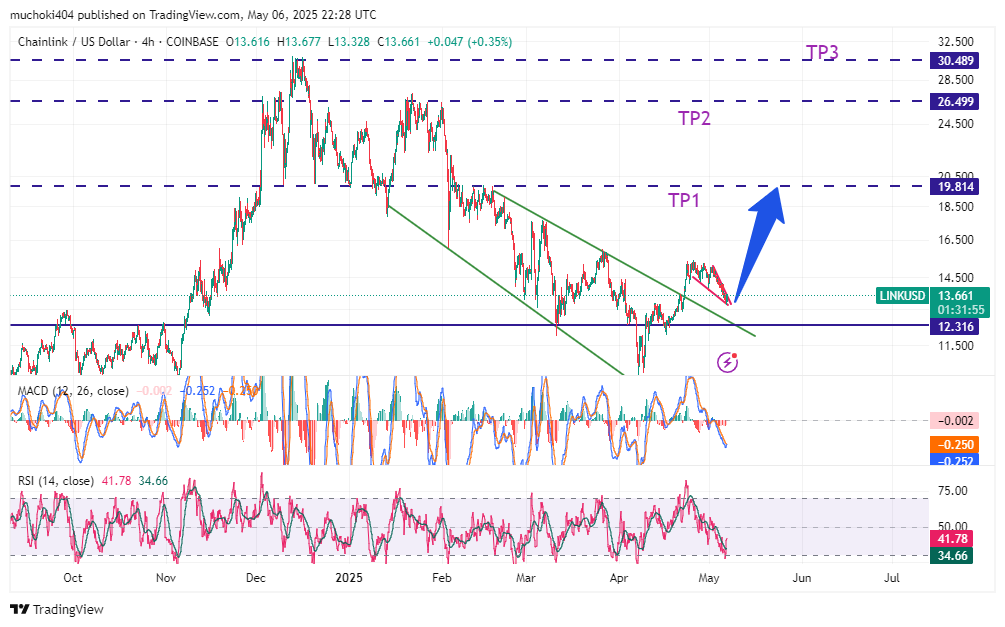
Furthermore, LINK price has recorded a 0.9 out of 1 price correlation with Bitcoin in the past 30 days. As a result, a consistent close above $14 in the coming days will propel a rally toward the next target of around $19 in the coming weeks.
Anchorage Digital has announced that it will offer investment giant BlackRock its array of institutional cryptocurrency custody solutions. The custody service provider will extend its services to a range of BlackRock’s spot crypto exchange-traded funds (ETFs) as part of the deal.
Anchorage and BlackRock Forge Partnership For Crypto Custody Solutions
According to the press release, Anchorage Digital says it is deepening its existing partnership with BlackRock by providing the investment behemoth with a slew of digital asset custody services. Per the announcement, the custody service will extend to cover rising retail and institutional demand for BlackRock’s crypto offerings.
BlackRock has tapped Anchorage Digital to occupy the role of an additional custodian for its range of spot crypto ETPs. Furthermore, Anchorage Digital will rehash its role as custodian in BlackRock’s sprawling fund empire with exposure to cryptocurrencies.
Under the arrangement, Anchorage will provide custodial services for spot crypto ETPs with over $50 billion in assets under management. BlackRock is the largest issuer of crypto ETPs, clinching UK FCA registration as a crypto asset firm.
“As BlackRock continues to bridge digital assets and traditional finance, we are excited by the opportunity to set a new standard for tailored access to the digital asset class,” said Anchorage Digital CEO Nathan McCauley.
Anchorage Digital has previously provided its custodial service to Cantor Fitzgerald’s $2 billion financing business. The firm’s customers extend to 21Shares, Visa, Copper, and Oasis Pro Markets.
A Raft Of Reasons Behind The Choice
BlackRock says choosing Anchorage Digital as a custodial service provider was an easy choice. Robert Mitchnick, BlackRock’s Head of Digital Asset noted that Anchorage Digital’s expertise in institutional-grade crypto custodial services makes it an ideal partner.
“After a thorough evaluation, Anchorage Digital clearly meets these standards, and we are excited to be expanding our network of eligible digital asset service providers with the addition of Anchorage Digital,” said Mitchnick.
Anchorage Digital provides firms with “bankruptcy-remote custody” while separating proprietary funds from customers’ assets. As an added layer of protection, Anchorage Digital uses biometric authentication in addition to storing private keys offline.
Furthermore, institutional investors are attracted to Anchorage given its reputation as home to the only US federally chartered crypto bank. Anchorage has previously teamed up with BlackRock for its BUIDL fund, fresh off a Solana expansion.
BlackRock is facing rising competition from its peers with Fidelity’s Solana ETF acknowledged by the US SEC as traditional investment firms jostle for crypto dominance.
Solana price has recently shown strong signs of recovery, leading analysts to predict a bullish breakout that could see the SOL price surpass $200.
Analysts anticipate that the current trend is a precursor of a significant bullish breakout as Trump tariffs fears end and the Bitcoin price recovers above the $94k resistance.
Is Solana Price Ready for a Bullish Breakout?
Solana price has been trading in a contained range-bound channel for several months, as depicted between October 2024 to April 2025. During this time, the cryptocurrency set the important support level at $147.48 and the price has been rebounding off this level of support.
According to Crypto General analyst, the price movement has formed an ascending triangle pattern. This pattern usually points to the bulls’ market continuation and can extend their move towards the upper resistance level, which is $288.51.
The ascending triangle implies that the price of Solana is steadily rising as the demand for the token also rises, with the formation of higher lows. This pattern is commonly regarded as an accumulation formation when buyers continuously drive the price up in anticipation of a breakout. A breakout above the $288.51 may open the door for more gains, taking SOL to $350 to $390 in the next few months.
Institutional Adoption Could Propel Prices Higher
Another reason that could further push Solana’s price up is the demand from institutional investors, such as SOL ETFs that have applied to the SEC and are waiting to be approved. Amid the swearing-in of a new SEC chair, the market anticipates an end to the uncertainties in regulations that may lead to the influx of institutional funds into Solana and other coins.
On a similar note, the high number of deployments on the Solana blockchain suggests that adoption and usage are also on the rise. As more developers build on the platform, the case for further growth in SOL’s value strengthens.
Several analysts, like Peter Brandt, have also stated that Solana could surpass Ethereum in the long term, which bolsters its long-term projections. Should institutional adoption increase, it could provide more upward pressure on Solana’s price and possibly even push it past $200.
Technical Indicators Suggest Bullish Outlook
To further support the bullish pressure, technical analysis of the SOLUSD price chart points to a significant bull run. From the 1-day price chart, the Bollinger Bands are expanding, which suggests the growing fluctuations in the SOL price. A
mid this trend, the price of SOL has crossed the upper Bollinger Band which is a sign of high volatility and uptrend action. If the price is above the middle band (blue line), it signals that this pattern may remain in control, which is a bullish signal.
SOLUSD 1-day price chart (Source: TradingView)
In addition, Solana’s chart shows a falling wedge formation. This pattern, a bullish reversal formed by converging trend lines with lower highs and higher lows, hints at a major move incoming.
Solana’s recent breakout above the upper trendline of this wedge could be the beginning of a significant upward move. After this breakout, analysts target $275 as a potential price zone, reflecting a substantial upside from the current price.
The cryptocurrency market has continued its downturn trend after the late 2024 rallies. Bitcoin (BTC) dropped 4 month low of below $77,000 on March 11 and Ethereum (ETH) has declined by more than 13% in the last week, falling from its December high of $4,000 to its current level of $1,875, putting great pressure on the major altcoins.
Five significant Real World Asset (RWA) tokens, including Chainlink (LINK) and Ondo (ONDO), have dropped to critical support levels during this downward crypto market. While OM remains resilient, trading in the green, ALGO has plummeted 2% and CPOOL surged 9%.
1. Mantra (OM)
In the OM daily chart, the price has plunged 0.38% today and touched the 50-day Moving Average (50MA) support at $6.2673 (shown in the green rectangle) and also touched the ascending trendline which usually has support below it. However, OM’s price has shown strength and is trading higher at $6.2.
Observing the historical price movements, similar tests of the support at 50MA (as shown in the purple circles) arms were followed by strong recoveries that brought strong rallies. If this scenario plays out, OM price may retest its all-time high (ATH) of $9.15 with possible consolidation thereafter.
2. Chainlink (LINK)
The chainlink price pattern shows two ascending diverging trend lines. The top side connects Chainlink’s higher highs and the bottom connects its lower highs over a certain period. This wedge can potentially lead to a strong rebound in most cases.
In Chainlink’s instance, the wedge was defined by the upper side connecting the largest swings since September 2022 and the lower side connecting the lowest points since June 2023. $LINK price has since found its way back down and is approaching the bottom of its megaphone pattern, suggesting a rebound.
If the rebound happens, the next level to watch is $30.81, the highest level in 2024. This target is nearly 135% above the current price and corresponds to the 50% Fibonacci Retracement level.
3. Ondo (ONDO)
ONDO’s weekly price chart shows an ascending spreading wedge pattern. The continuing correction started with its rejection of the upper trendline at $2.14 (the December 16 high), which set off a continuous fall toward the lower support trendline.
With today’s decline, ONDO price challenged the lower trendline support at $0.72 but is currently trading above $0.83, showing some resilience. If ONDO follows its historical price movement within the pattern, a major rebound toward the upper trendline of $3.03 is possible.
4. Algorand (ALGO)
Despite going through a bear market and failing to establish a decent rally since it, the Algorand price chart has a good historical correlation with major support and resistance levels. The purple circles indicate critical support retests, in each event the price bounced after reaching these levels. The orange circles are resistance levels. At present, ALGO price is at a crucial support level similar to previous cycles, which can be held and bounced.
Historically, this support has served as a major accumulation area and could result in a bounce to $0.60.
5. Clearpool (CPOOL)
The CPOOL price chart formig a rising wedge, which is usually a bearish pattern. The price has been moving between two ascending trendlines for the past few months, making higher highs and lower lows. Historically, $CPOOL saw a sharp rally after its first launch, hitting a peak of $2.57, before witnessing a major downtrend. Between 2022 and 2023, the price consolidated, forming a strong base, before beginning a slow recovery over 2024.
$CPOOL is currently testing the wedge’s lower support at $0.104. The RSI (Relative Strength Index) of 32.43 indicates CPOOL is on the verge of oversold conditions, suggesting a bounce is likely. Likewise, the CCI (Commodity Channel Index) of -148.79 indicates extreme downward momentum, but past behaviors from this level expect a price reversal. If CPOOL is maintained above the $0.09 support level, a bounce to $0.31 is likely to follow.
Conclusion
The RWA industry is expanding rapidly, with many projects gaining widespread attention on social media. As of March 9th, $LINK, $ONDO, and ALGO were the most prominent projects in RWA sectors by social interaction, according to statistics from Phoenix Group.
The Real-World Assets industry continues to expand at a rapid pace. It has a market cap of $30.13 billion, which is 1.10% of the total cryptocurrency market cap. With $11.9 billion, or nearly 69% of the market, tokenized private credit makes up the largest portion. At $3.5 billion, tokenized U.S. Treasury debt has also gained popularity.
The five cryptocurrencies are all near their significant support levels right now, which have historically led to recoveries. This will be a good time to accumulate the dip for traders. DYOR ( Do your Own Research) once entering the market.
The post Top 5 RWA Tokens At Critical Support: OM, LINK, ONDO, ALGO, And CPOOL Rebound? appeared first on Coinpedia Fintech News
RWA tokens