Cathie Wood, popular for her bets on crypto firms, has recently loaded 262,463 shares of Jack Dorsey’s Block Inc (NYSE: XYZ) on August 11, across three of its Ark Invest funds. This development just as Dorsey has been pushing for BTC adoption through the company’s subsidiaries like Cash App, Square, etc. Wood’s latest purchase comes
Crypto whales have begun to quietly shift their altcoin positions following Trump’s Liberation Day tariffs. Uniswap (UNI), Chainlink (LINK), and Ondo Finance (ONDO) have all seen declines in the number of wallets holding between 10,000 and 100,000 tokens.
While the sell-off hasn’t been dramatic, the timing and consistency across multiple tokens suggest growing caution or short-term repositioning. As these altcoins face key support and resistance levels, whale behavior could continue to shape their price trajectories in the coming days.
Uniswap (UNI)
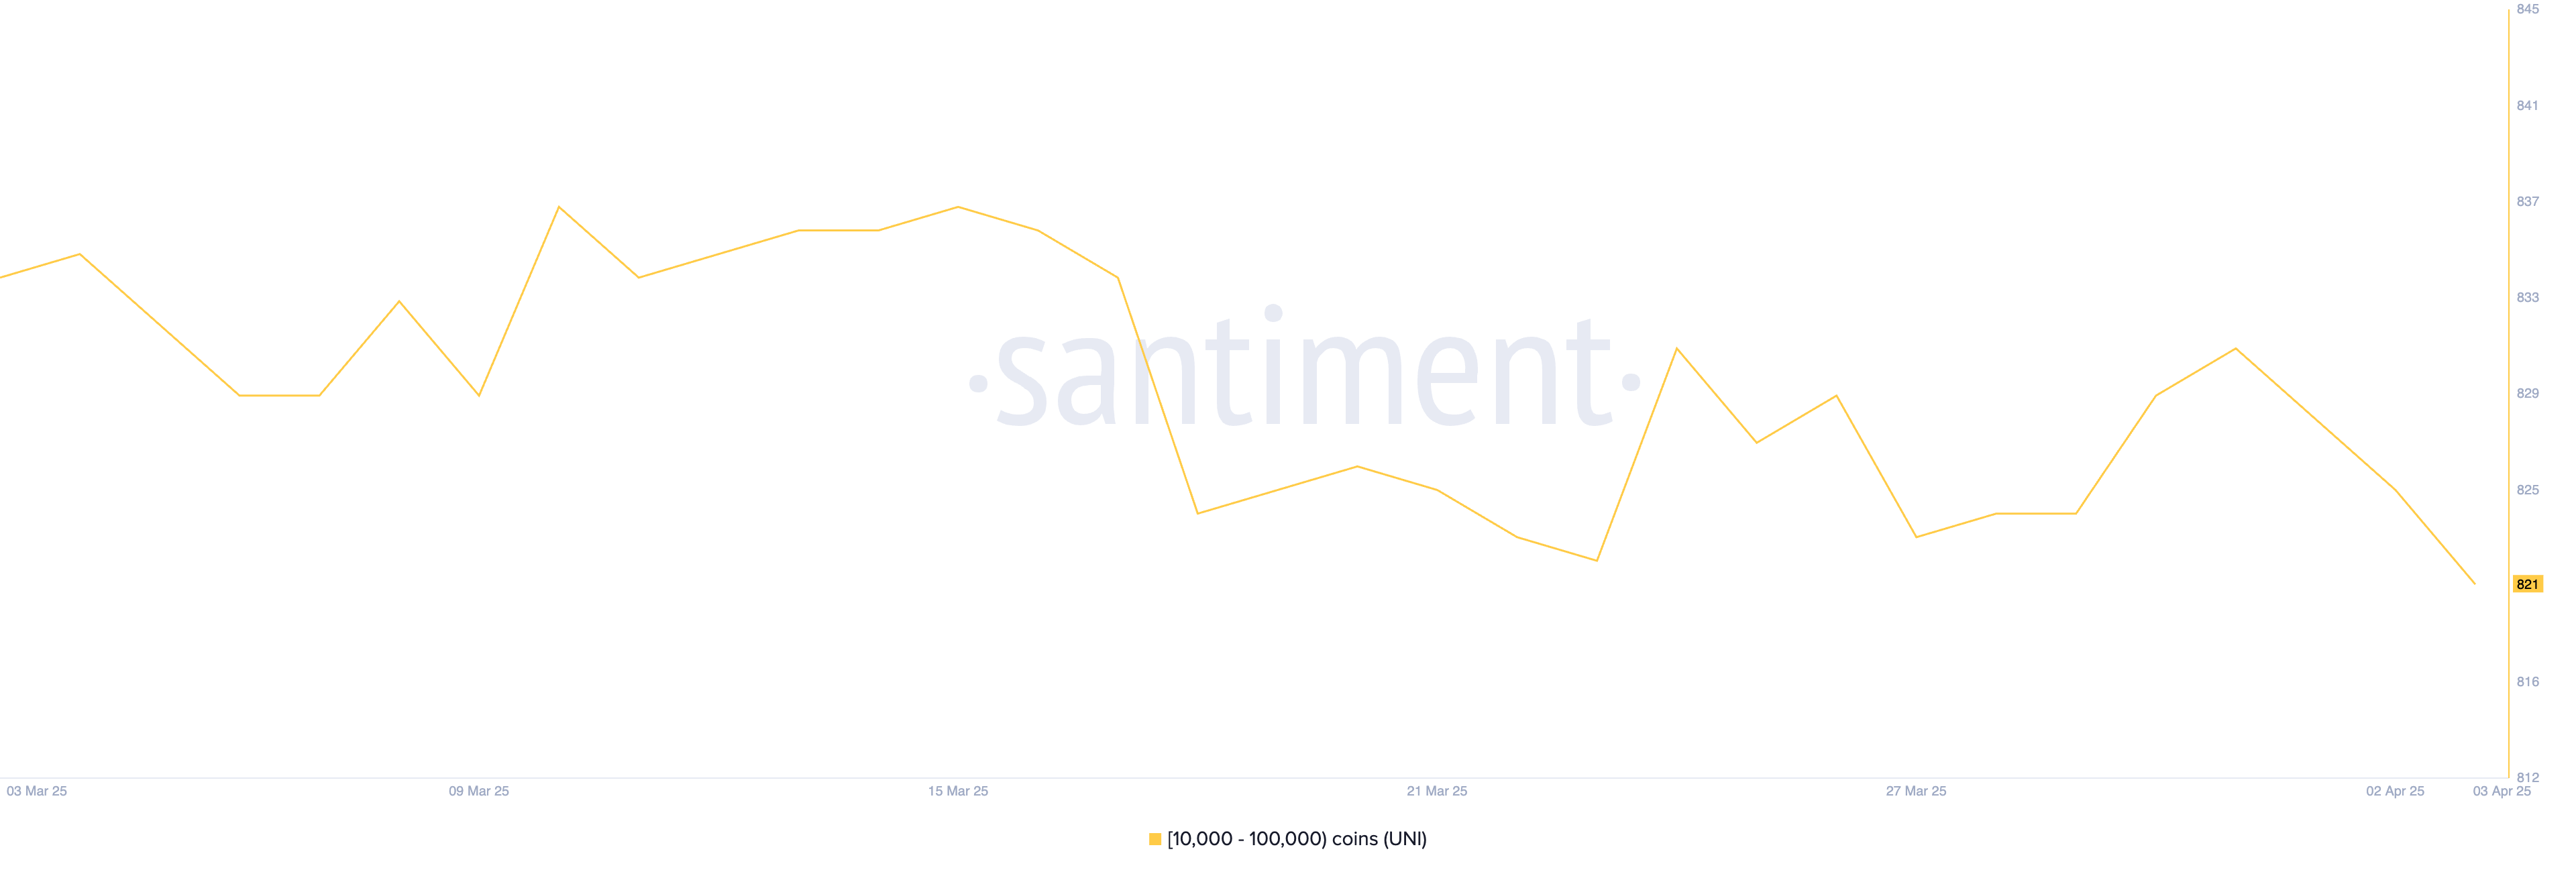
The number of Uniswap (UNI) addresses holding between 10,000 and 100,000 tokens has been steadily declining, a trend that began before Trump’s so-called Liberation Day and has continued in its aftermath.
Between April 2 and April 3 alone, this group of crypto whales dropped from 825 to 821, signaling a slight but notable reduction in confidence or positioning from a segment often seen as strategically reactive.
Number of Addresses Holding Between 10,000 and 100,000 UNI. Source: Santiment.
While this decline may seem modest, it reflects a broader sentiment of caution among larger UNI holders, which often precedes or reinforces price weaknesses.
Currently, UNI price remains in a clear downtrend, with growing risks of a drop toward the $5.50 level or even below it if bearish momentum continues. However, if the trend begins to reverse, the token could first test resistance at $5.97.
A successful breakout from there could push Uniswap higher toward $6.23, a level that would suggest a stronger recovery is underway.
For now, though, the decrease in whale-sized wallets and prevailing bearish momentum place the asset in a vulnerable technical position.
Chainlink (LINK)
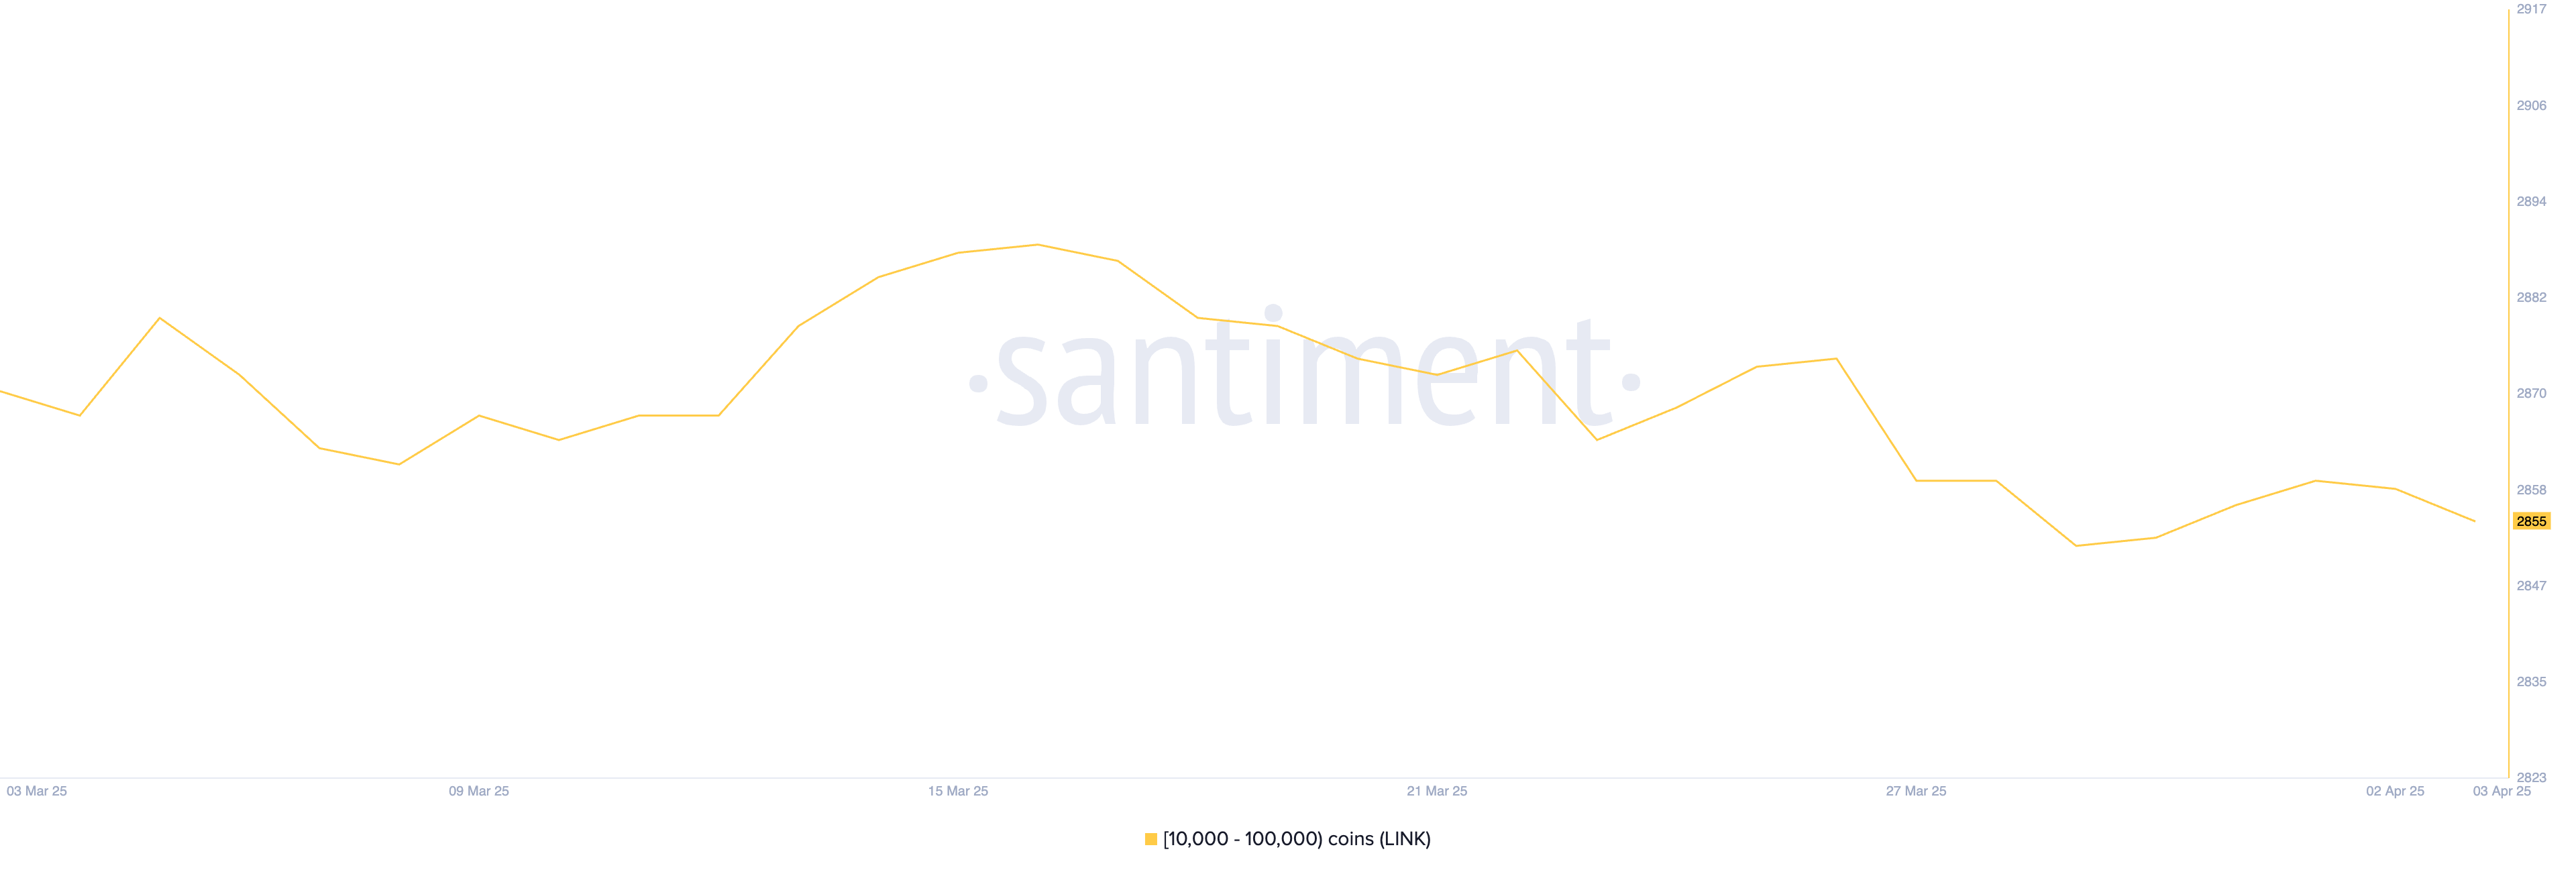
While the number of Chainlink (LINK) whale addresses—those holding between 10,000 and 100,000 LINK—only slightly declined after Trump’s Liberation Day, falling from 2,859 to 2,855, the context leading up to that matters more.
From March 29 to April 1, this group was actively accumulating, with the number of crypto whales rising from 2,852 to 2,860. This short burst of accumulation suggested growing confidence in LINK’s upside potential heading into the month.
The recent dip may simply reflect mild profit-taking or caution during the current correction rather than a broader shift in sentiment.
Number of Addresses Holding Between 10,000 and 100,000 LINK. Source: Santiment.
Technically, LINK is at a critical point. If the ongoing correction deepens, the token could fall below $12 for the first time since November 2024, with $11.85 as the key support to watch.
However, if the trend shifts and buyers regain control, LINK could first test resistance at $13. A break above that level would likely open the door for a move toward $13.45.
Ondo Finance (ONDO)
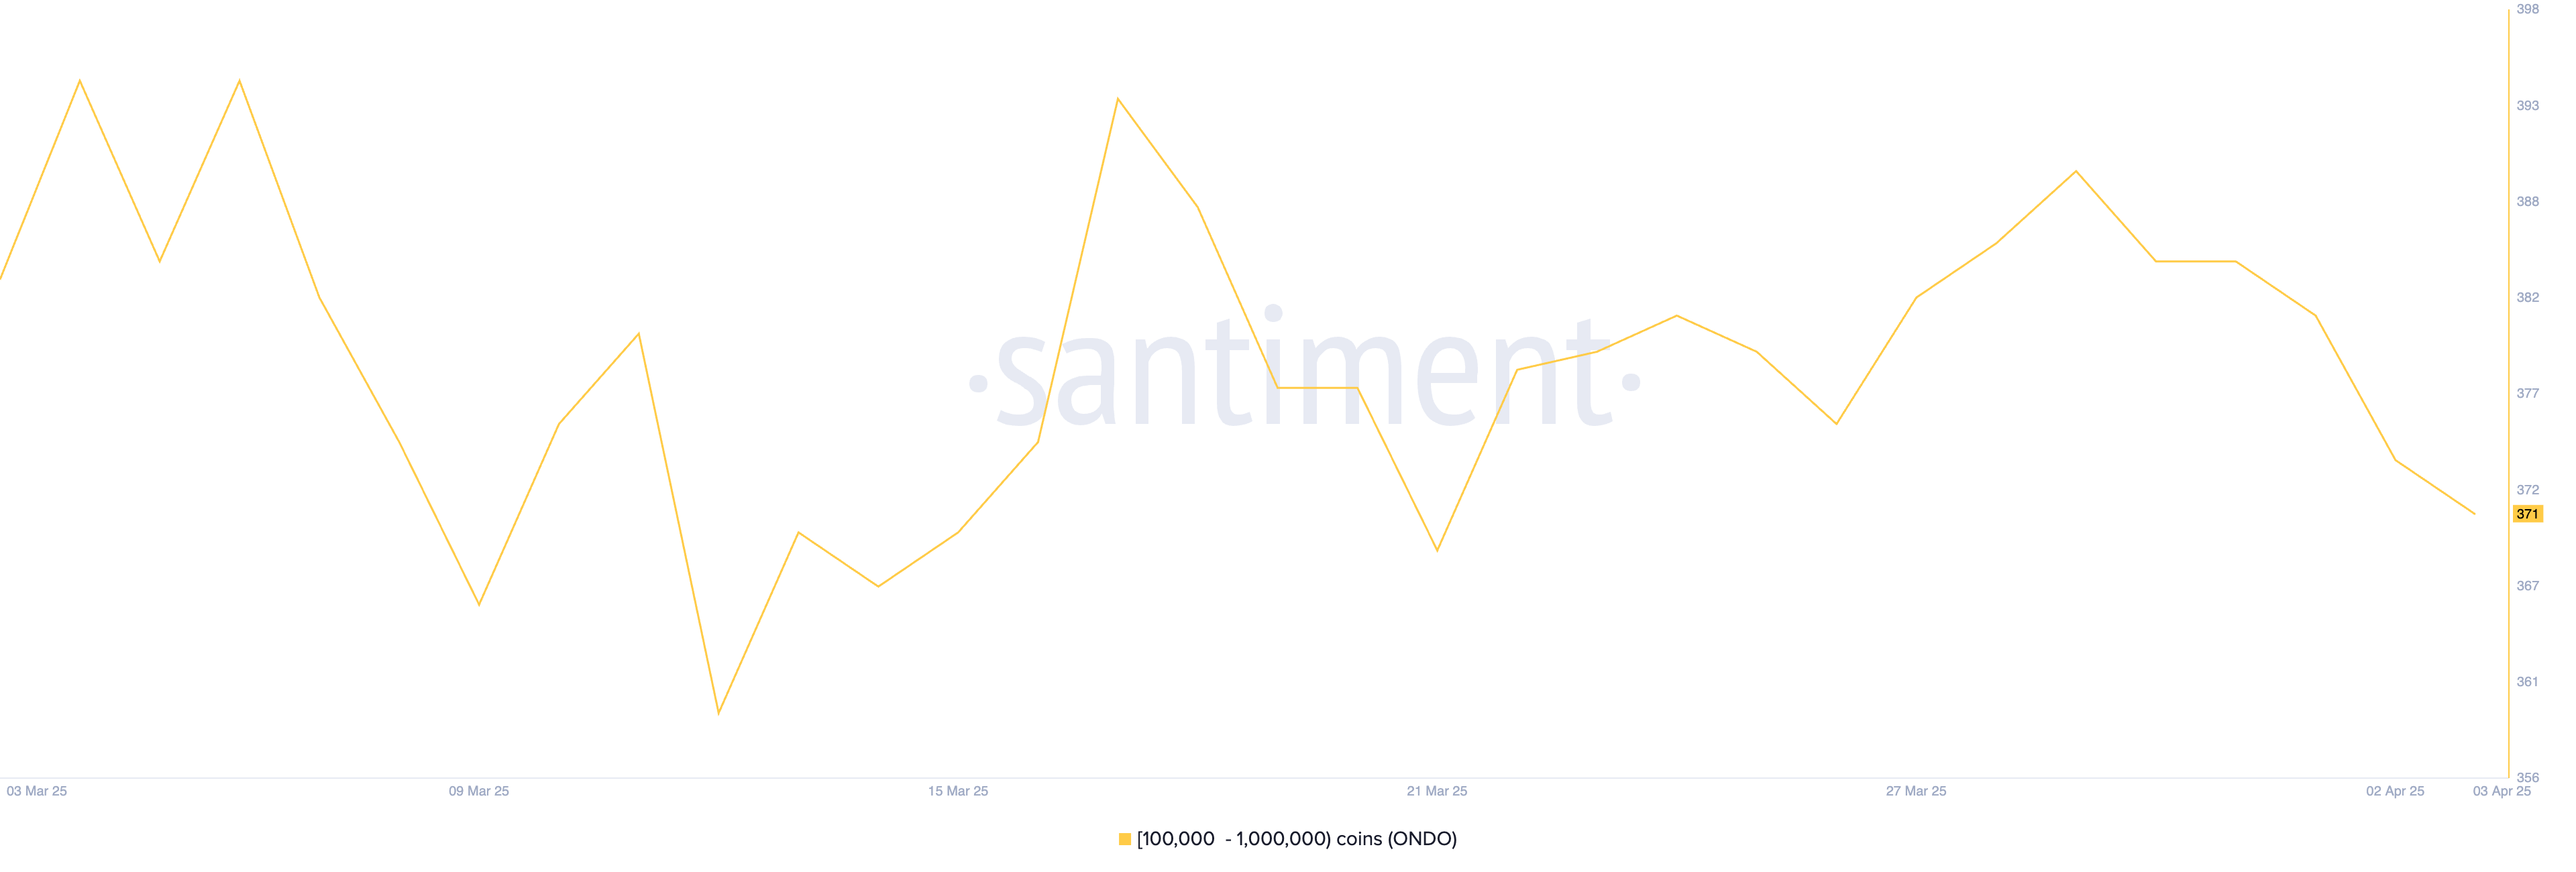
ONDO is showing a trend similar to Chainlink, with whale accumulation taking place between March 26 and March 29 as the number of addresses holding between 10,000 and 100,000 ONDO grew from 376 to 390.
This wave of accumulation pointed to growing interest and confidence from larger holders. However, after peaking, the number of whales started to drop, falling from 374 to 371 following Trump’s Liberation Day.
This decline, while subtle, may indicate a pause in optimism or a cautious shift in positioning among key players.
Number of Addresses Holding Between 100,000 and 1,000,000 ONDO. Source: Santiment.
From a price perspective, ONDO now sits at an important moment. If it can regain the bullish momentum seen last month, it could push through the resistance at $0.82, with the potential to climb further toward $0.90 or even $0.95 if strength persists.
However, if momentum continues to fade, downside risks increase, with support levels around $0.76 and $0.73 likely to be tested.
Bitcoin dominance has dropped almost 7% in the past month, breaking a key 3-year trendline. Meanwhile, popular crypto trader Crypto Rover shared a chart showing a striking similarity between Bitcoin dominance in 2021 and 2025
Back then, it led to one of the biggest altcoin rallies, and now, Rover believes history might be repeating.
2021 Chart Pattern Repeating Again
Recently, Crypto Rover shared, Bitcoin dominance chart, which formed a similar shape in both 2021 and 2025, a falling wedge. In 2021, this led to a sharp fall in dominance, triggering a major altcoin season where many smaller coins skyrocketed.
Now, in 2025, we’re seeing the same setup again. Bitcoin dominance recently peaked around 72%, and is now falling fast, currently sitting near 61%. Therefore, Rover suggests this could be just the beginning of another big drop, possibly to 52% or even lower.
If dominance keeps falling, more funds may flow into altcoins, just like what happened during the 2021 altseason.
Altcoins Already Outperforming Bitcoin
This trend isn’t just about charts, it shows a shift in trader interest. The crypto market is showing clear signs of a shift toward altcoins as Ethereum, SOL, XRP, and other altcoins have started to outperform Bitcoin.
According to Glassnode data shows that Ethereum’s perpetual futures trading volume has just passed Bitcoin’s, for the first time since the 2022 market low. This marks the biggest-ever shift in favor of Ethereum, suggesting that traders are now turning their attention more toward altcoins.
Altcoin Season Index Hit 37
According to Blockchain Center, Altcoin Season Index has dropped to 37, down from 55 on July 21, which means we’re not officially in altcoin season yet..
Despite it, the current trend suggests something could be building. If the pattern continues, altcoins might soon take the spotlight, even if Bitcoin stays in charge for now.
The post Bitcoin Dominance Drops Again, Is Altcoin Season Coming in August? appeared first on Coinpedia Fintech News
Bitcoin dominance has dropped almost 7% in the past month, breaking a key 3-year trendline. Meanwhile, popular crypto trader Crypto Rover shared a chart showing a striking similarity between Bitcoin dominance in 2021 and 2025 Back then, it led to one of the biggest altcoin rallies, and now, Rover believes history might be repeating. 2021 …
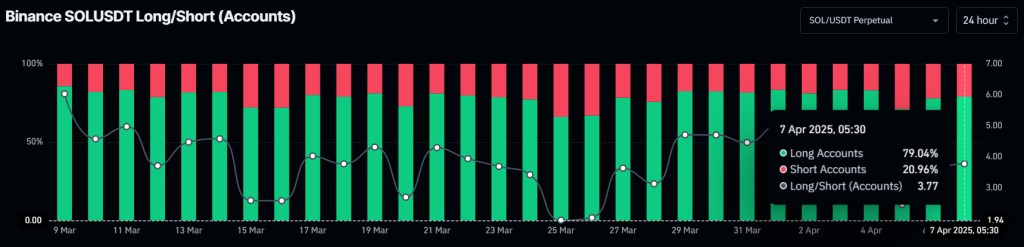
Solana (SOL), the world’s sixth-largest cryptocurrency by market cap, is gaining massive attention from Binance traders. Recently, data from the on-chain analytics firm Coinglass revealed that 79% of top traders on Binance are going long on SOL, despite the bearish market sentiment.
Source: Coinglass
Solana (SOL) Price Action and Upcoming Levels
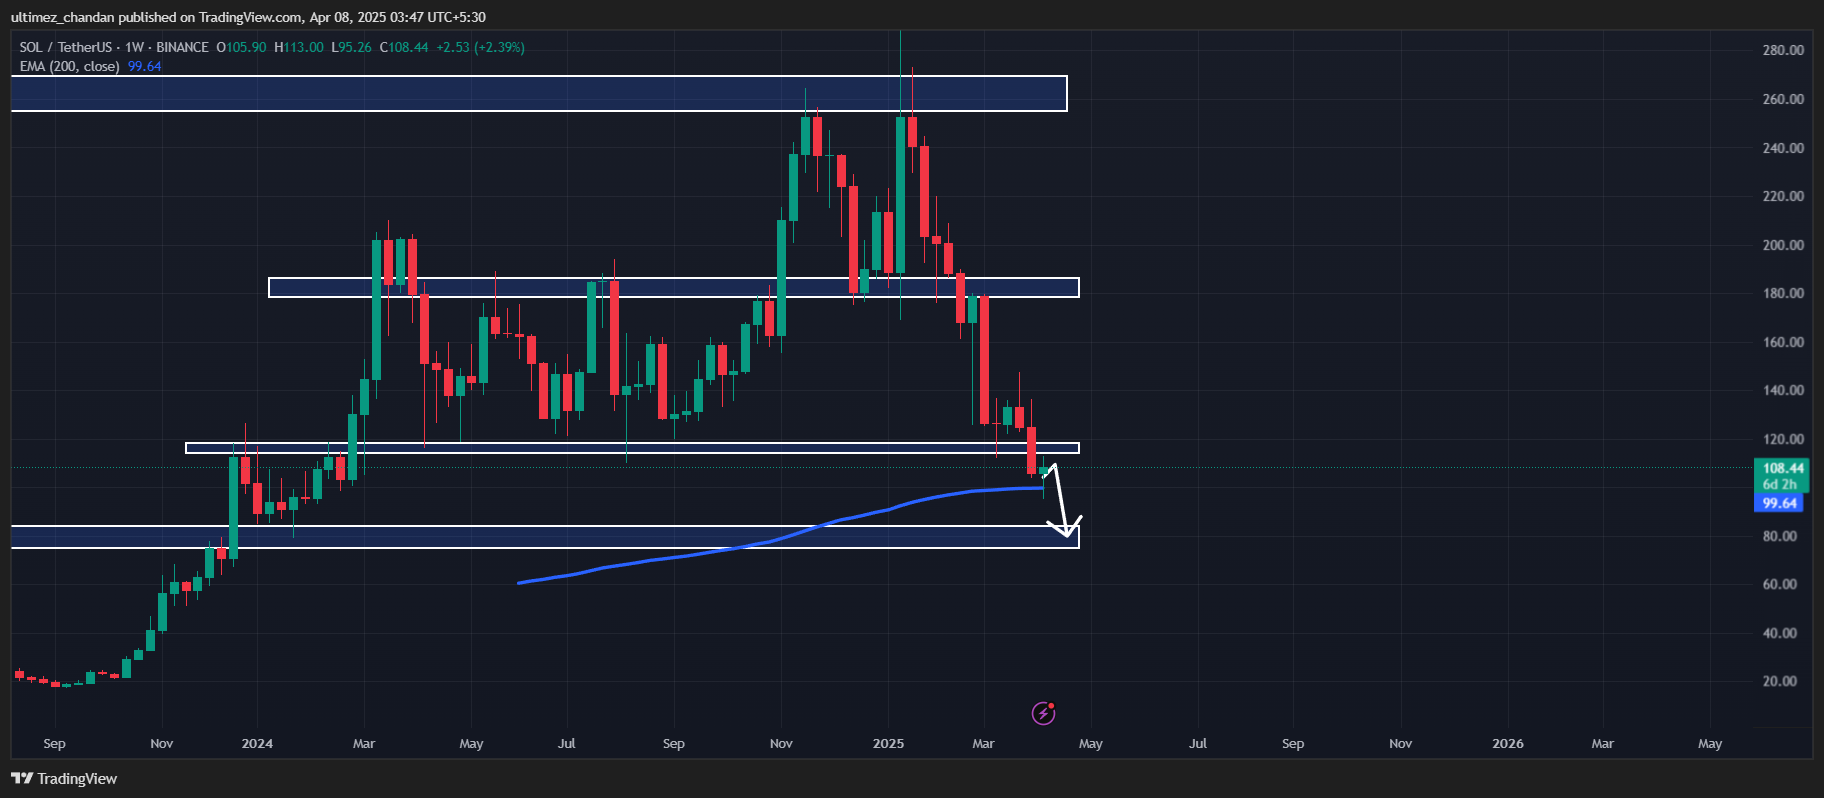
According to expert technical analysis, SOL appears bearish despite the ongoing price recovery. On April 6, 2025, SOL broke down from its prolonged key support level of $115 and also closed a daily candle below that level, a level it had held since March 2024.
Source: Trading View
This breakdown has pushed SOL into an extremely bearish phase. However, the ongoing price recovery appears to be a retest of the breakdown level.
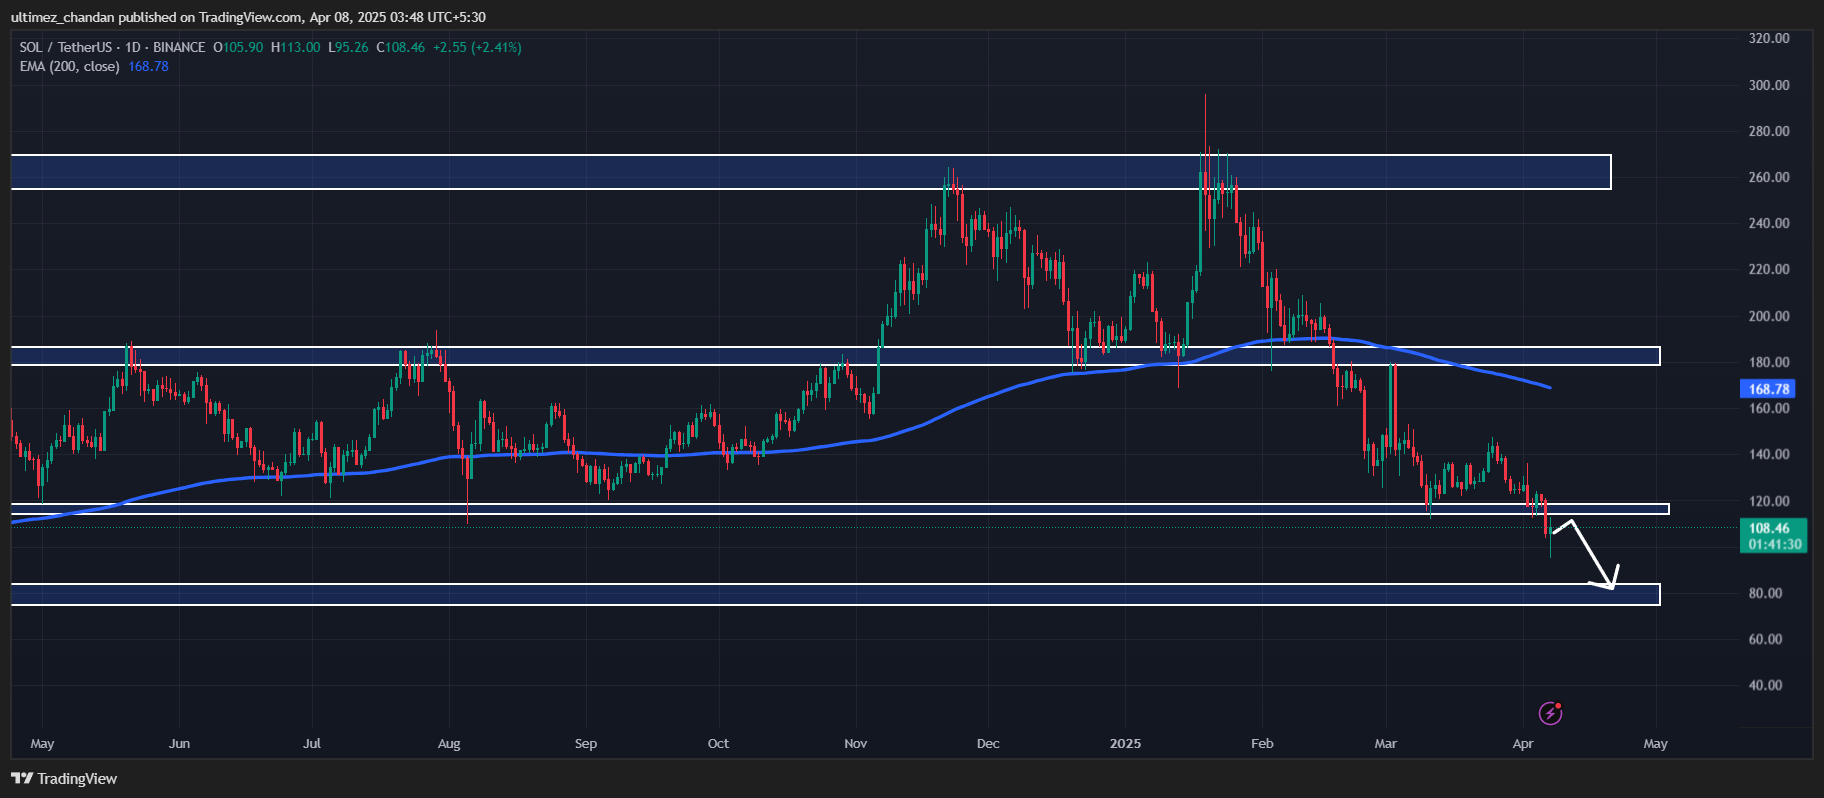
Based on the recent price action and historical momentum, if SOL remains below the $115 level, there is a strong possibility it could decline by 30% and reach the $77 level in the near future.
Source: Trading View
This bearish outlook is strongly supported by momentum indicators such as the Relative Strength Index (RSI) and the 200-day Exponential Moving Average (EMA) on the daily time frame.
Current Price Momentum
As of writing, SOL was trading near $107 and had registered a price drop of over 1% in the past 24 hours. Meanwhile, the asset showed a strong recovery, having hit a low of $95.6 during the Asian market session. Amid this significant price fluctuation and market volatility, SOL’s trading volume has skyrocketed by 185% during the same period.
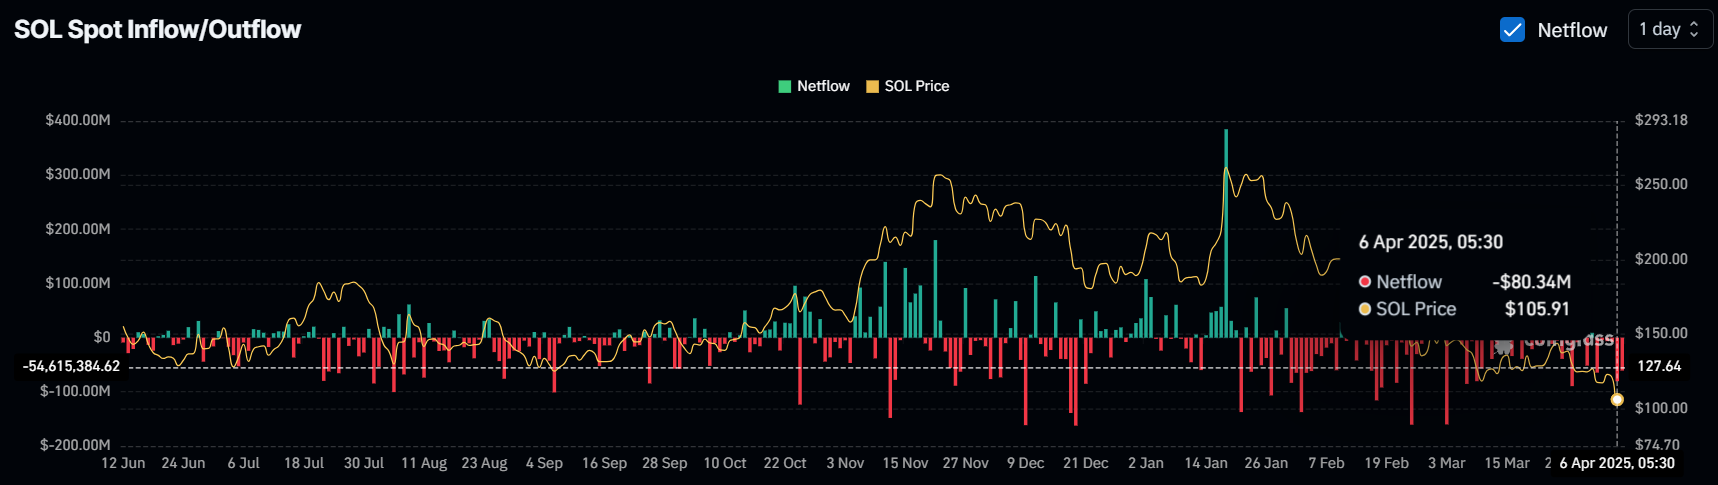
$140 Million Worth of SOL Outflow
While examining the on-chain metrics, it appears that whales, investors, and long-term holders have seized the opportunity to accumulate SOL at the current price level, according to the on-chain analytics firm Coinglass.
Source: Coinglass
Data from spot inflow/outflow reveals that exchanges have seen an outflow of approximately $140 million worth of SOL over the past 24 hours. This substantial outflow suggests potential accumulation and could lead to buying pressure.
However, due to the prevailing bearish sentiment, a strong upside rally may be difficult to achieve.
The post Solana (SOL) to $77 or What? Bulls and Bears Face Off appeared first on Coinpedia Fintech News
Solana (SOL), the world’s sixth-largest cryptocurrency by market cap, is gaining massive attention from Binance traders. Recently, data from the on-chain analytics firm Coinglass revealed that 79% of top traders on Binance are going long on SOL, despite the bearish market sentiment. Source: Coinglass Solana (SOL) Price Action and Upcoming Levels According to expert technical …