Solana Altcoin Saros Rises 1000% in March, Forms New All-Time Highs

Saros, the Solana-based altcoin, has been on an impressive uptrend over the past month. The token’s price has formed new all-time highs (ATHs) nearly every day throughout March. 

However, with the momentum showing signs of slowing, investors are wondering if this rally is nearing its end.

SAROS Refrains From Following Bitcoin

The correlation between Saros and Bitcoin (BTC) is currently negative, sitting at -0.43. This negative correlation has worked in Saros’ favor, as it allowed the altcoin to perform well during Bitcoin’s struggles throughout March. While Bitcoin faced significant declines, Saros was able to rally largely due to this inverse relationship.

The shifting dynamics between Bitcoin and Saros will be key to the future price movement of the altcoin. Should Bitcoin regain its upward momentum, Saros may face increased selling pressure. This is because the negative correlation that has benefited Saros may reverse, impacting the altcoin’s ability to maintain its upward trajectory. 

SAROS Correlation to Bitcoin
SAROS Correlation to Bitcoin. Source: TradingView

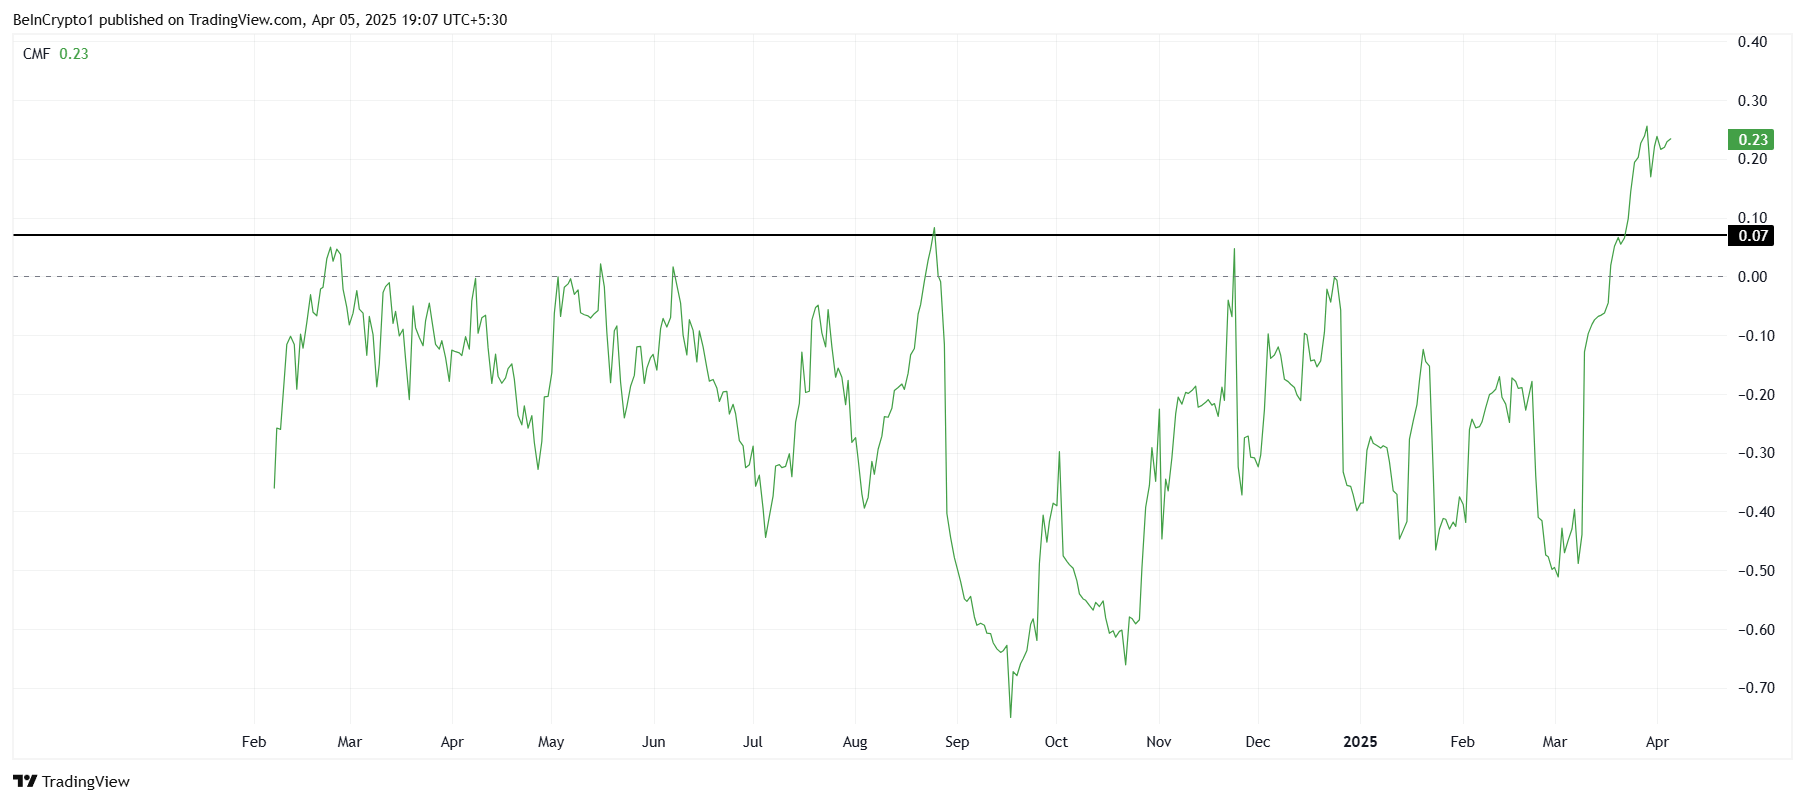
The overall macro momentum of Saros shows that investor interest has remained strong. The Chaikin Money Flow (CMF) indicator has been increasing steadily over the past month, signaling consistent inflows. 

Recently, it crossed the saturation threshold of 0.7, a level that has historically led to price corrections. This suggests that while Saros has experienced significant gains, the market may be nearing an overbought condition. If profit-taking begins, a price pullback is highly probable for the altcoin.

SAROS CMF
SAROS CMF. Source: TradingView

SAROS Price Rise Continues

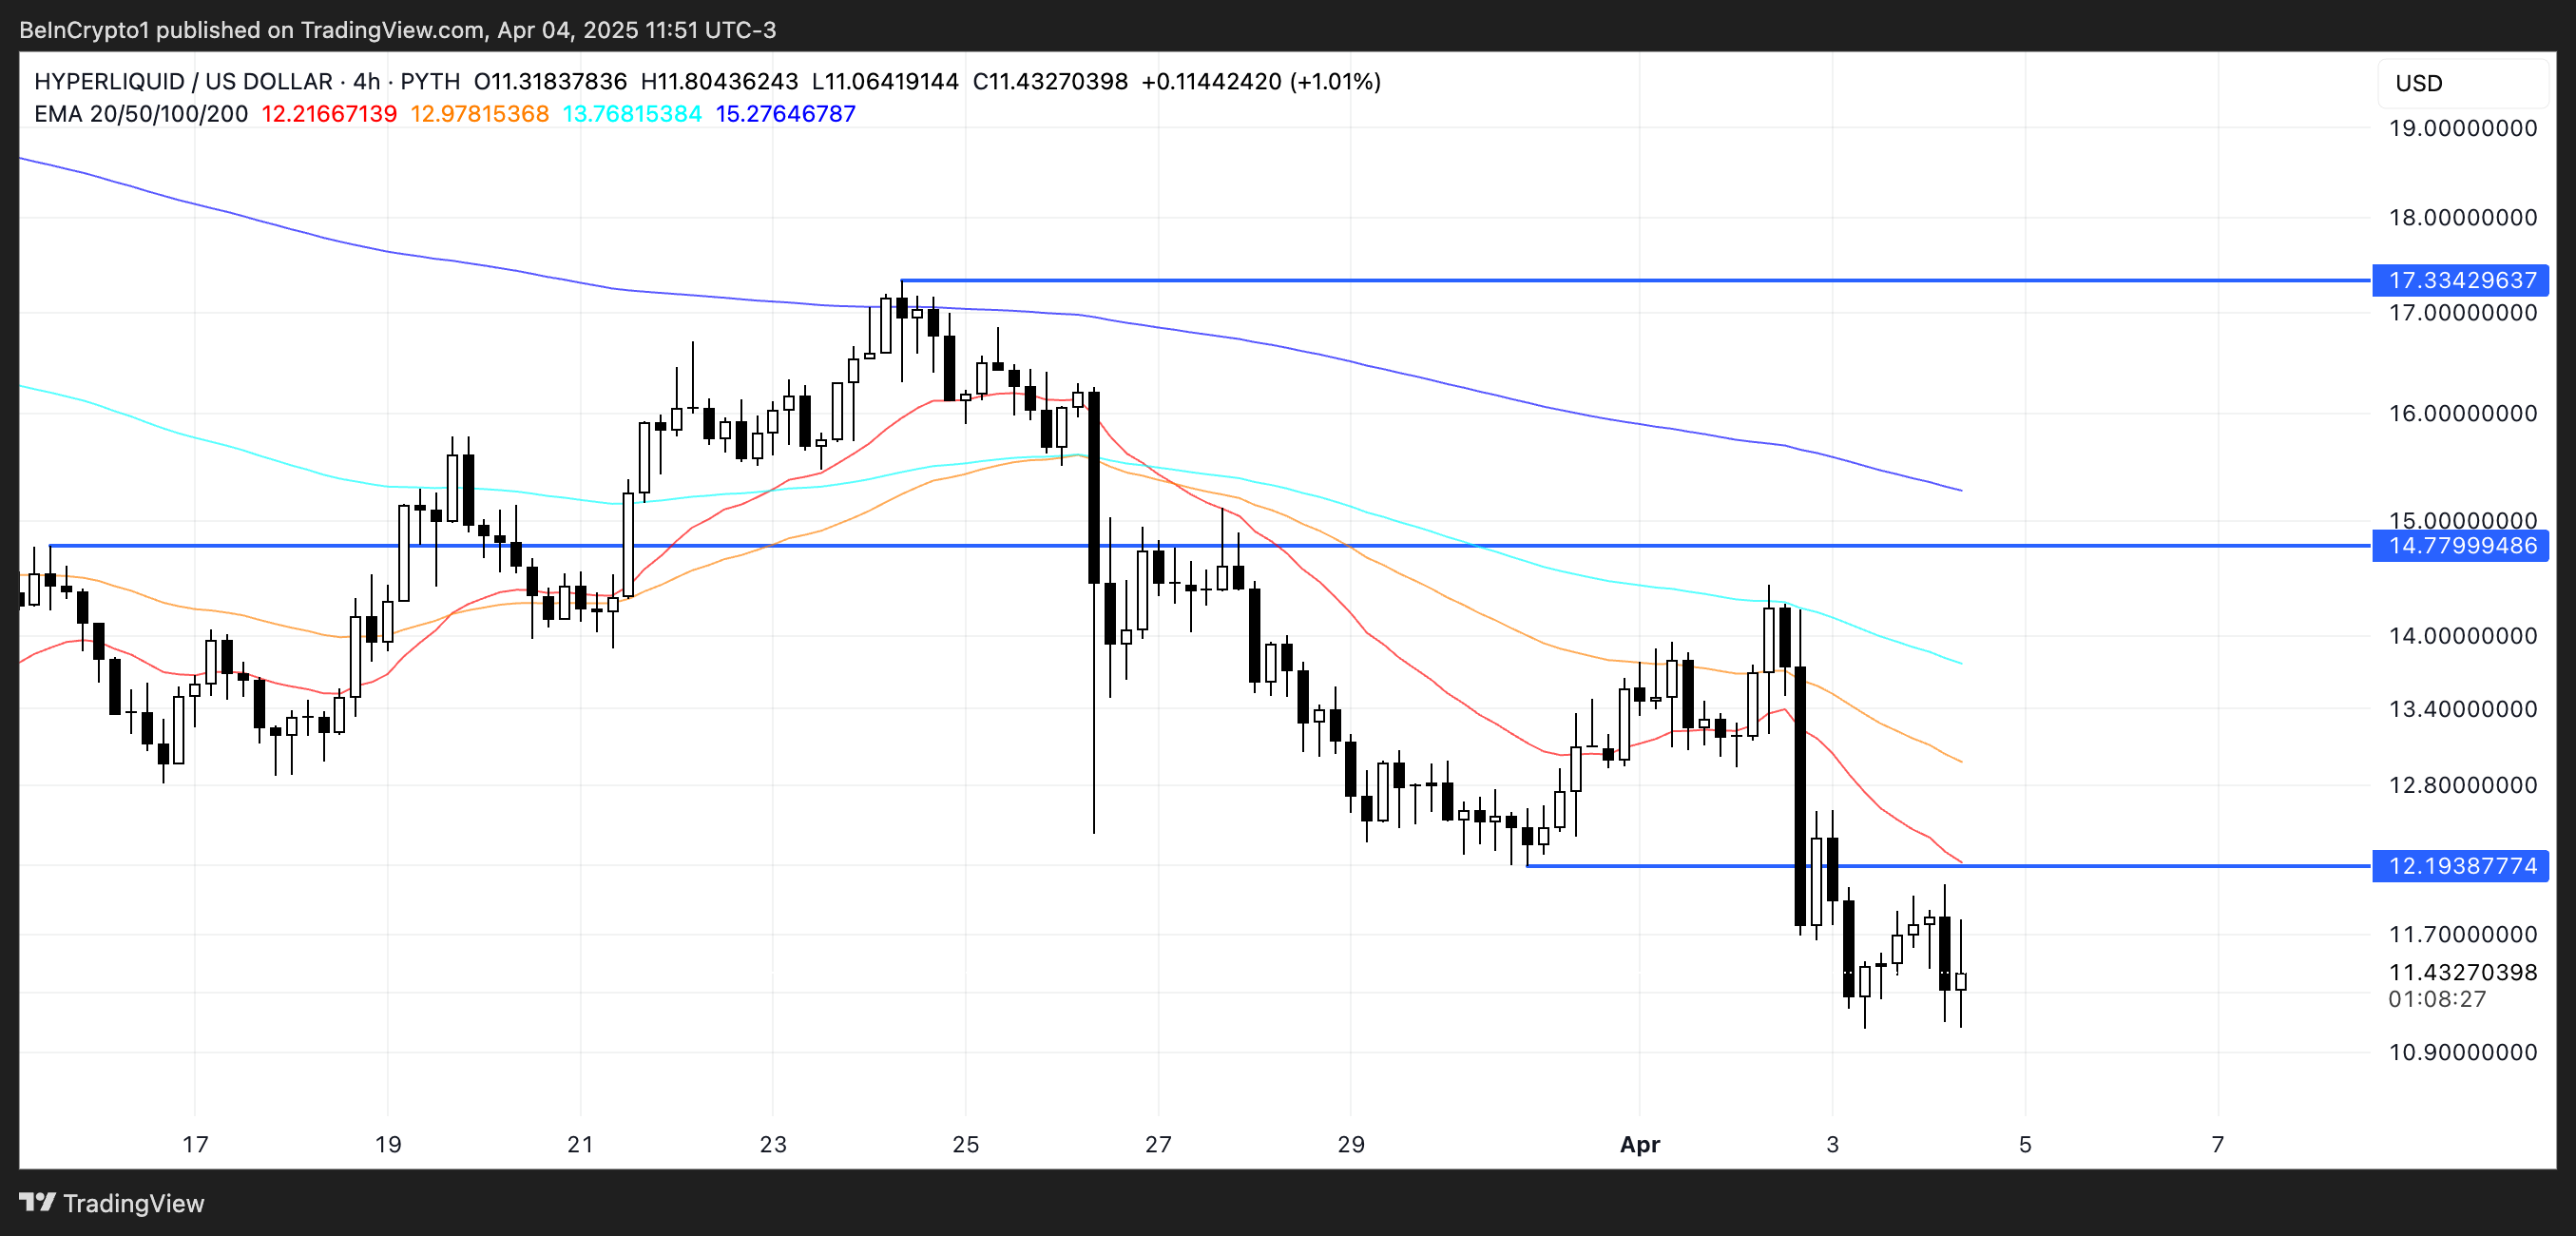
Saros has surged by an astounding 1,024% since the beginning of March, trading at $0.153 as of now. Throughout March, the altcoin has formed new ATHs almost daily, reflecting strong investor sentiment and demand. 

The current ATH stands at $0.163, and the momentum could continue pushing the price upwards, potentially reaching $0.200 if the uptrend remains intact. However, as the price continues to rise, the risk of profit-taking increases. 

SAROS Price Analysis.
SAROS Price Analysis. Source: TradingView

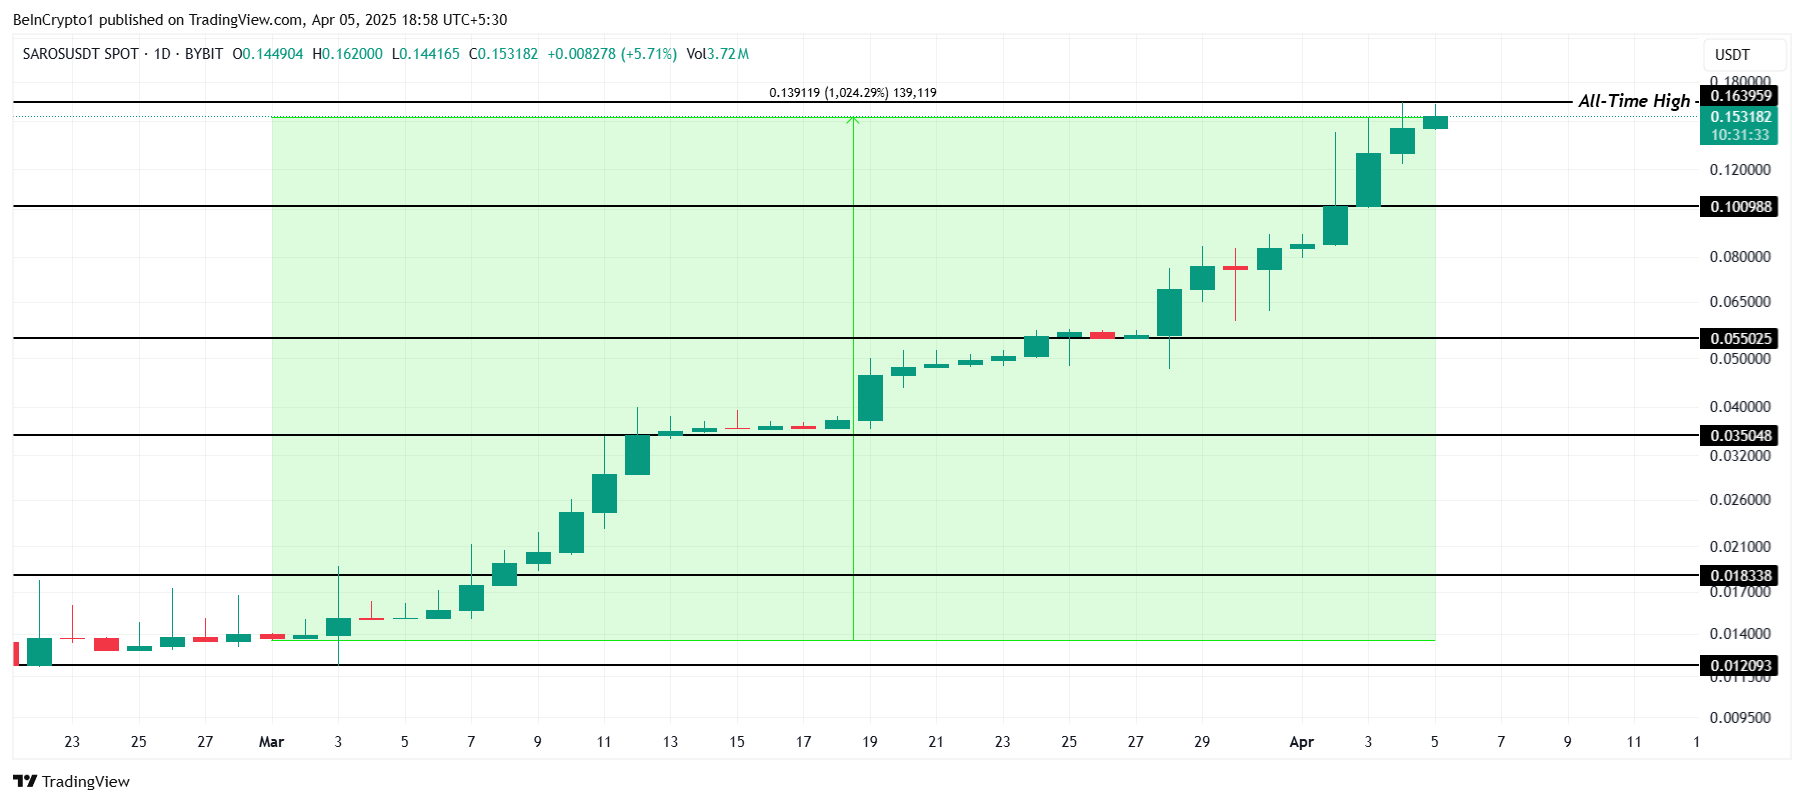
If Saros faces such a pullback, it could fall back towards the $0.100 support level. If the altcoin loses this key support, the price could drop further to $0.055, invalidating the bullish outlook. Investors should keep an eye on these levels as they will help determine whether the current rally is sustainable.

The post Solana Altcoin Saros Rises 1000% in March, Forms New All-Time Highs appeared first on BeInCrypto.

IMX Price Drops to 2-Year Low After 30 Million Tokens Are Sold; All-Time Low in Sight

Immutable’s (IMX) price has been on a significant downtrend recently, falling to multi-year lows. The token has suffered a sharp decline, and its price is currently hovering around $0.433. 

If the current trend continues, there is a possibility that IMX could form a new all-time low (ATL).

Immutable Investors Are Giving Up

The supply of Immutable on exchanges has risen dramatically in the past two weeks. A total of 30 million IMX tokens have been added, increasing the overall supply to 165 million IMX. This surge in supply is worth approximately $13 million and indicates a shift in investor sentiment. 

As investors begin to sell off their holdings, this suggests growing skepticism about the token’s future prospects. The trend has led to an increase in selling pressure, which further exacerbates the current price decline.

IMX Supply on Exchanges. Source: Santiment

The overall macro momentum for Immutable appears to be unfavorable at this point. Active addresses, which measure the number of unique addresses engaging with the network, are at a low level. The lack of participation reflects investor hesitation and reduced confidence in the token’s potential.

When fewer addresses are interacting with the network, it generally indicates a lack of new capital entering the market. As a result, this decline in activity has contributed to the negative sentiment surrounding IMX.

IMX Active Addresses
IMX Active Addresses. Source: Santiment

IMX Price Needs A Reversal

IMX price is down nearly 40% over the past two weeks, with the 30 million token sell-off playing a significant role in the decline. At the time of writing, the price is at $0.433, holding just above the critical support level of $0.400. If this support is broken, the price could fall further, potentially reaching $0.375 or below, resulting in a new all-time low.

The continued drawdown suggests that the token may not see a recovery soon unless the market conditions improve. If IMX manages to hold above $0.400, there is a slim chance it could stabilize before testing further resistance levels. However, breaking through the $0.400 support would likely lead to more losses.

IMX Price Analysis.
IMX Price Analysis. Source: TradingView

For a more optimistic scenario, IMX would need to reclaim the support level of $0.508. This could pave the way for a potential recovery, allowing the price to rise toward $0.684.

A successful breach of these levels could invalidate the bearish outlook and offer some hope for reversing recent losses.

The post IMX Price Drops to 2-Year Low After 30 Million Tokens Are Sold; All-Time Low in Sight appeared first on BeInCrypto.

Cosmos (ATOM) Surges 14% as Golden Cross Looms

Cosmos (ATOM) is gaining strong bullish momentum, jumping over 14% in the last 24 hours as technical indicators flash potential for further upside. The token’s Relative Strength Index (RSI) has surged from deeply oversold levels to nearly overbought territory, highlighting an aggressive wave of buying pressure.

On the Ichimoku Cloud chart, ATOM has broken above the cloud with bullish crossovers forming, suggesting a possible trend reversal is underway. As the price nears a key resistance zone, traders are watching closely to see if ATOM can maintain this breakout and push toward the $6 mark in April.

Cosmos RSI Is Close To Overbought Levels

Cosmos has seen a sharp surge in momentum, with its Relative Strength Index (RSI) climbing to 68.11 after sitting at just 29 only four days ago.

This rapid rise suggests strong buying pressure over a short period, signaling a dramatic shift in sentiment. The RSI is a momentum oscillator that measures the speed and change of price movements, with values ranging from 0 to 100.

Typically, a reading below 30 indicates an asset is oversold and may be due for a bounce, while a reading above 70 suggests it’s overbought and could be primed for a pullback.

ATOM RSI.
ATOM RSI. Source: TradingView.

With ATOM’s RSI now nearing the overbought threshold at 70, it indicates that the recent price run-up may be nearing exhaustion—at least in the short term.

While a breakout above 70 could signal a strong bullish continuation, such high RSI levels also come with caution, as traders may begin to take profits or reassess entry points.

If momentum holds, ATOM could push into overbought territory and extend its gains. However, if buyers begin to fade, the price could see some short-term cooling as the market digests the recent surge.

ATOM Ichimoku Cloud Shows A Bullish Setup

Cosmos is showing a bullish breakout on the Ichimoku Cloud chart. The price has decisively moved above the cloud, indicating a potential trend reversal.

The blue conversion line (Tenkan-sen) has sharply turned upward and now sits above the red baseline (Kijun-sen), which is a classic bullish crossover.

This alignment reflects growing short-term momentum and could support further upside if it holds.

ATOM Ichimoku Cloud.
ATOM Ichimoku Cloud. Source: TradingView.

Additionally, the Leading Span A (green cloud boundary) has started to curve upward, while Leading Span B (red boundary) is beginning to flatten.

This shift is causing the cloud ahead to thin out, signaling that bearish pressure is weakening. With the price above the cloud and the lagging span (Chikou) clear of recent price action, the overall setup leans bullish.

Will Cosmos Rise To $6 In April?

With the recent price surge, Cosmos price is approaching a key resistance level at $5, and a breakout above it could pave the way for further gains toward $5.5 and even $6.

The current alignment of the EMA lines shows growing bullish momentum, and a golden cross—where a short-term EMA crosses above a longer-term EMA—appears to be forming. If confirmed, this signal could attract more buyers and reinforce the potential for a continued upward move, especially if volume supports the breakout.

ATOM Price Analysis.
ATOM Price Analysis. Source: TradingView.

However, if ATOM fails to maintain its momentum and the price gets rejected at resistance, the trend could reverse toward key support levels.

The first area to watch is around $4.83, and a breakdown below that could lead to further losses. $4.47 and $4.17 are potential downside targets.

The post Cosmos (ATOM) Surges 14% as Golden Cross Looms appeared first on BeInCrypto.

Hyperliquid (HYPE) Slides 16% In One Week And Nears $11 Support

Hyperliquid (HYPE) is under pressure, down 16% over the past seven days as technical indicators increasingly point toward bearish control. Momentum has weakened sharply, with the Relative Strength Index (RSI) dropping below 40 and showing no signs of strong buying interest since late March.

At the same time, the Directional Movement Index (DMI) shows sellers gaining dominance, with a rising ADX suggesting a potential strengthening of the downtrend. As HYPE approaches key support levels, the market now waits to see if bulls can mount a recovery—or if further downside is ahead.

Hyperliquid DMI Shows Sellers Are In Control

According to its Directional Movement Index (DMI), Hyperliquid is showing early signs of a developing trend, with the Average Directional Index (ADX) rising from 21.5 to 23.6.

The ADX measures the strength of a trend regardless of its direction. Readings below 20 typically indicate a weak or range-bound market, while values above 25 suggest the presence of a strong trend.

With the current ADX moving closer to that 25 threshold, it suggests that trend strength is building—but hasn’t fully confirmed yet—indicating that traders should be on alert for potential continuation in price action.

HYPE DMI.
HYPE DMI. Source: TradingView.

Meanwhile, the +DI and -DI lines, which represent bullish and bearish directional movement, respectively, have shifted significantly.

The +DI has dropped sharply from 25.68 to 12.79, while the -DI has surged from 11.29 to 23.4, indicating that bearish momentum has clearly overtaken bullish pressure. This shift suggests that sellers are gaining control of the market, and unless the +DI line can reverse and regain ground, HYPE could be at risk of further downside.

If the current dynamics continue, this, combined with the rising ADX, could signal the start of a stronger bearish trend.

Hyperliquid RSI Shows The Lack Of Buying Momentum

Hyperliquid has seen its Relative Strength Index (RSI) fall significantly over the past two days, dropping from 63.03 to 39.39.

The RSI is a momentum oscillator that measures the speed and magnitude of recent price changes, ranging from 0 to 100.

Readings above 70 typically indicate that an asset is overbought and may be due for a correction, while readings below 30 suggest it is oversold and could be primed for a rebound. Levels between 30 and 70 are considered neutral, but directional shifts within this range often reflect changing momentum.

HYPE RSI.
HYPE RSI. Source: TradingView.

With HYPE’s RSI now sitting at 39.39, the indicator suggests weakening bullish momentum and growing bearish pressure. The fact that the RSI hasn’t touched or exceeded the 70 mark since March 24 signals a lack of strong buying conviction in recent weeks.

This downward trend in RSI may indicate that the market is cooling off. Unless buyers step in to reverse this trajectory, HYPE could continue to face selling pressure.

If the RSI continues to drift toward 30, it would raise the possibility of further downside or consolidation in the short term.

Will Hyperliquid Fall Below $11 Soon?

Hyperliquid price is currently at an important threshold, with action leaning bearish but potential for a rebound still on the table.

If the current downtrend continues, HYPE could soon dip below the $11 mark.

HYPE Price Analysis. Source: TradingView.

This would align with the recent drop in momentum indicators like the RSI and the growing bearish pressure seen in directional movement data.

However, if buyers manage to step in and shift momentum, HYPE could attempt to reclaim higher levels. A break above the immediate resistance at $12.19 would be the first sign of recovery, potentially opening the door for a move toward $14.77.

If bullish momentum accelerates, the rally could extend as far as $17.33, which would mark a full reversal of the current bearish structure.

The post Hyperliquid (HYPE) Slides 16% In One Week And Nears $11 Support appeared first on BeInCrypto.

Bitcoin Price Correlation with M2 Money Supply Signals a Bullish Q2 

The global M2 money supply has surged to an all-time high of $108.4 trillion, raising fresh questions about Bitcoin’s next move. 

The milestone comes amid escalating economic uncertainty following former President Donald Trump’s new “Liberation Day” tariffs and China’s swift retaliatory measures, which together have roiled global markets.

What is M2 and Why Does It Matter for Bitcoin?

Despite the extreme volatility over the past two weeks, Bitcoin’s average value has remained almost unchanged. 

Analysts claim that Bitcoin’s latest volatility reflects macroeconomic fears and fluctuating long/short ratios – but the largest cryptocurrency is nowhere near a bear market

This is largely due to the historical correlation between rising M2 levels and significant Bitcoin rallies.

M2 is a broad measure of a country or region’s money supply. It includes physical cash, checking and savings deposits, and other liquid assets that can be quickly converted to cash. 

Bitcoin and M2 Money Supply Chart
Bitcoin and M2 Money Supply Chart In the Past Year. Source: BGeometrics

When M2 increases, it typically signals greater liquidity in the financial system. It simply means more money that often seeks returns in riskier assets such as equities, real estate, or cryptocurrencies like Bitcoin.

Past surges in the M2 money supply have preceded major Bitcoin rallies. Following the COVID-era stimulus programs in 2020-2021, the US M2 supply jumped by over 25%. 

This correlated with Bitcoin’s rise from under $10,000 in mid-2020 to an all-time high of over $69,000 by November 2021. Analysts point to a similar pattern today, albeit with a lag.

“Market proponents say that Trump’s tariffs are primarily a negotiation strategy, and their effect on businesses and consumers will remain manageable. Adding to the uncertainty are the inflationary pressures that could challenge the US Federal Reserve’s rate-cutting outlook. Also, resolving the debt ceiling remains a pressing issue, as the Treasury currently relies upon ‘extraordinary measures’ to meet US financial obligations. The exact timeline for when these measures will be exhausted is unclear, but analysts anticipate they may run out after the first quarter,” said Maksym Sakharov, Co-Founder of WeFi Deobank.

Also, Bitcoin’s price often trails global M2 growth by roughly two months. 

With M2 accelerating since late February and the current spike taking it to its highest level ever, market watchers suggest that Bitcoin could see a delayed but strong upside if liquidity continues to expand.

However, macroeconomic headwinds could temper near-term gains. Trump’s tariff shock and China’s tit-for-tat response have already triggered the steepest Wall Street losses in five years. 

Investors may delay allocating capital to high-volatility assets until trade tensions stabilize.

Still, with M2 surging and Bitcoin supply capped, the setup for a renewed bullish move remains in place. That is if historical patterns hold and markets regain confidence.

The post Bitcoin Price Correlation with M2 Money Supply Signals a Bullish Q2  appeared first on BeInCrypto.

3 Altcoins Crypto Whales Are Selling After Trump’s Liberation Day Tariffs

Crypto whales have begun to quietly shift their altcoin positions following Trump’s Liberation Day tariffs. Uniswap (UNI), Chainlink (LINK), and Ondo Finance (ONDO) have all seen declines in the number of wallets holding between 10,000 and 100,000 tokens.

While the sell-off hasn’t been dramatic, the timing and consistency across multiple tokens suggest growing caution or short-term repositioning. As these altcoins face key support and resistance levels, whale behavior could continue to shape their price trajectories in the coming days.

Uniswap (UNI)

The number of Uniswap (UNI) addresses holding between 10,000 and 100,000 tokens has been steadily declining, a trend that began before Trump’s so-called Liberation Day and has continued in its aftermath.

Between April 2 and April 3 alone, this group of crypto whales dropped from 825 to 821, signaling a slight but notable reduction in confidence or positioning from a segment often seen as strategically reactive.

Number of Addresses Holding Between 10,000 and 100,000 UNI.
Number of Addresses Holding Between 10,000 and 100,000 UNI. Source: Santiment.

While this decline may seem modest, it reflects a broader sentiment of caution among larger UNI holders, which often precedes or reinforces price weaknesses.

Currently, UNI price remains in a clear downtrend, with growing risks of a drop toward the $5.50 level or even below it if bearish momentum continues. However, if the trend begins to reverse, the token could first test resistance at $5.97.

A successful breakout from there could push Uniswap higher toward $6.23, a level that would suggest a stronger recovery is underway.

For now, though, the decrease in whale-sized wallets and prevailing bearish momentum place the asset in a vulnerable technical position.

Chainlink (LINK)

While the number of Chainlink (LINK) whale addresses—those holding between 10,000 and 100,000 LINK—only slightly declined after Trump’s Liberation Day, falling from 2,859 to 2,855, the context leading up to that matters more.

From March 29 to April 1, this group was actively accumulating, with the number of crypto whales rising from 2,852 to 2,860. This short burst of accumulation suggested growing confidence in LINK’s upside potential heading into the month.

The recent dip may simply reflect mild profit-taking or caution during the current correction rather than a broader shift in sentiment.

Number of Addresses Holding Between 10,000 and 100,000 LINK.
Number of Addresses Holding Between 10,000 and 100,000 LINK. Source: Santiment.

Technically, LINK is at a critical point. If the ongoing correction deepens, the token could fall below $12 for the first time since November 2024, with $11.85 as the key support to watch.

However, if the trend shifts and buyers regain control, LINK could first test resistance at $13. A break above that level would likely open the door for a move toward $13.45.

Ondo Finance (ONDO)

ONDO is showing a trend similar to Chainlink, with whale accumulation taking place between March 26 and March 29 as the number of addresses holding between 10,000 and 100,000 ONDO grew from 376 to 390.

This wave of accumulation pointed to growing interest and confidence from larger holders. However, after peaking, the number of whales started to drop, falling from 374 to 371 following Trump’s Liberation Day.

This decline, while subtle, may indicate a pause in optimism or a cautious shift in positioning among key players.

Number of Addresses Holding Between 100,000 and 1,000,000 ONDO.
Number of Addresses Holding Between 100,000 and 1,000,000 ONDO. Source: Santiment.

From a price perspective, ONDO now sits at an important moment. If it can regain the bullish momentum seen last month, it could push through the resistance at $0.82, with the potential to climb further toward $0.90 or even $0.95 if strength persists.

However, if momentum continues to fade, downside risks increase, with support levels around $0.76 and $0.73 likely to be tested.

The post 3 Altcoins Crypto Whales Are Selling After Trump’s Liberation Day Tariffs appeared first on BeInCrypto.

Satoshi Nakamoto’s 50th Birthday: 5 Facts About Bitcoin’s Creator

April 5, 2025, marks what would be the 50th birthday of Satoshi Nakamoto—the pseudonymous creator of Bitcoin. This alleged birthday is based on the date listed in his P2P Foundation profile. 

While Nakamoto’s true identity remains unconfirmed, his legacy continues to shape the digital financial landscape. Here are five facts about the elusive Bitcoin architect:

April 5 Wasn’t Random

Nakamoto listed April 5, 1975, as his birthday—exactly 42 years after the US government banned private gold ownership under Executive Order 6102 on April 5, 1933, to stabilize the dollar. 

Bitcoin, by contrast, was designed to be a decentralized, deflationary alternative to fiat currency. Notably, BTC difficulty adjustment happens every 2016 block—2016 being 6102 in reverse.

Satoshi Nakamoto’s Bitcoin Fortune Remains Untouched

Satoshi’s wallet, believed to hold 1.096 million BTC, has remained untouched since early 2010. Over the past decade, its value has risen more than 333-fold, now exceeding $91 billion. 

Despite the wallet’s inactivity, CoinJoin transactions are regularly sent to its address. Some view this as an act of homage or a method of obfuscation.

Satoshi Nakamoto's Bitcoin Holdings
Satoshi Nakamoto’s Bitcoin Holdings. Source: Arkham

Still No Definitive Identity

In March 2024, a UK court ruled that Australian computer scientist Craig Wright is not Satoshi, calling his claims “deliberately false.” 

An October 2024 HBO documentary controversially pointed to Canadian developer Peter Todd, who strongly denied any connection. 

More recently, internet theories have speculated on Jack Dorsey’s possible ties, though no evidence supports the claim. Nakamoto’s identity remains the internet’s most persistent mystery.

The Genesis Block’s Silent Message

Embedded in Bitcoin’s first block is the headline: “The Times 03/Jan/2009 Chancellor on brink of second bailout for banks.” The line is from a UK newspaper.

It is seen as a critique of centralized monetary policy and remains one of Nakamoto’s only public statements beyond technical documentation.

bitcoin genesis block
Bitcoin Genesis Block. Source: Wikipedia

Bitcoin’s Design Still Holds

Fifteen years after its launch, Bitcoin remains secure and deflationary by design. Nakamoto’s codebase, while modified and improved by the open-source community, still forms the foundation of the network, securing over $1.6 trillion in value.

The post Satoshi Nakamoto’s 50th Birthday: 5 Facts About Bitcoin’s Creator appeared first on BeInCrypto.

What To Expect From Ethereum (ETH) in April?

The leading altcoin, Ethereum, experienced a challenging month in March, marked by a series of bearish trends that reflected a broader market slowdown. 

However, as the market begins to show signs of recovery, the key question for April remains: Can Ethereum regain its bullish momentum?

Ethereum’s March Woes: Price Crash, Activity Slump, and Growing Supply Pressure

On March 11, Ethereum plummeted to a two-year low of $1,759. This prompted traders to “buy the dip,” triggering a rally to $2,104 by March 24. 

However, market participants resumed profit-taking, causing the coin’s price to fall sharply for the rest of the month. On March 31, ETH closed below the critical $2,000 price level at $1,822. 

Amid ETH’s price troubles, the Ethereum network also experienced a severe decline in activity in March. Per Artemis, the daily count of active addresses that completed at least one ETH transaction fell by 20% in March.

As a result, the network’s monthly transaction count also plummeted. Totaling 1.06 million during the 31-day period in review, the number of transactions completed on Ethereum fell by 21% in March. 

Ethereum Network Activity
Ethereum Network Activity. Source: Artemis

Generally, as more users transact and engage with Ethereum, the burn rate (a measure of ETH tokens permanently removed from circulation) increases, contributing to Ether’s deflationary supply dynamic. However, when user activity drops, ETH’s burn rate reduces, leaving many coins in circulation and adding to its circulating supply. 

This was the case for ETH in March when it saw a spike in its circulating supply. According to data from Ultrasound Money, 74,322.37 coins have been added to ETH’s circulating supply in the past 30 days.

Ethereum's Circulating Supply.
Ethereum’s Circulating Supply. Source: Ultrasound Money

Usually, when an asset’s supply spikes like this without a corresponding demand to absorb it, it increases the downward pressure on its price. This puts ETH at risk of extending its decline in April.

What’s Next for Ethereum? Expert Says Inflation May Not Be a Major Concern

In an exclusive interview with BeInCrypto, Gabriel Halm, a Research Analyst at IntoTheBlock, noted that ETH’s current inflationary trends “may not be a major red flag” to watch out for in April.

Halm said:

“Even though Ethereum’s supply has recently stopped being deflationary, its annualized inflation rate is still only 0.73% over the last month, which is still dramatically lower than pre-Merge levels and lower than that of Bitcoin. For investors, this moderate level of inflation may not be a major red flag, provided that network usage, developer activity, and institutional adoption remain robust.”

Moreover, regarding whether Ethereum’s declining network activity has played a significant role in its recent price struggles, Halm suggested that its impact may be overstated.

“Historically, from September 2022 to early 2024, Ethereum’s supply remained deflationary, yet the ETH/BTC pair still trended lower. This suggests that macroeconomic and broader market forces can play a far more significant role than token supply changes alone.”

ETH/BTC Market Cap Comparison.
ETH/BTC Market Cap Comparison. Source: IntoTheBlock

On what ETH holders should anticipate this month, Halm said:

“Ultimately, whether Ethereum dips or rallies in April will likely depend more on market sentiment and macro trends than on its short-term supply dynamics. Still, it’s essential to keep an eye on network developments that could spur renewed activity and reinforce ETH’s leading position in the broader crypto landscape.”

The post What To Expect From Ethereum (ETH) in April? appeared first on BeInCrypto.

Binance Dominates 94% of Crypto Airdrops and Staking Rewards

A new report shows that Binance almost has a monopoly in the CEX market in terms of crypto airdrop distribution and staking rewards. In 2024, the exchange received $2.6 billion of a total of $2.7 billion in rewards, amounting to 94% of the entire market segment.

In an exclusive press release shared with BeInCrypto, Binance also revealed that it’s making substantial changes to its airdrop services to improve user experience and make participation easier.

Binance Leads the Market in Crypto Airdrops

Binance, the world’s largest crypto exchange, has become the go-to platform for airdrops and staking rewards. It launched the HODLer airdrop program less than a year ago, providing many new projects with a comprehensive platform to reward early adopters.

In the past year, the exchange has become synonymous with the latest airdrops, as most users are accessing their rewards through the platform.

Exchanges with Most Launchpool Rewards and Airdrops in 2024
Exchanges with Most Launchpool Rewards and Airdrops in 2024. Source: CoinMarketCap

Based on this impressive performance in the airdrop sector, Binance has substantially upgraded a few of its services. The platform has revamped its Launchpool and BNB Earn pages, making it easier for users to both track and participate in airdrops.

“With these upgrades, we’re making it easier than ever for users to unlock the full potential of BNB and participate in high-quality token launches. The redesigned Binance Launchpool and BNB pages reflect our commitment to user education, simplicity, and maximizing rewards,” said Jeff Li, VP of Product at Binance.

The updated BNB page will give Binance users key benefits, such as real-time information on airdrops across its platforms, including Launchpool, Megadrop, and HODLer Airdrops.

Users will also see features like trading fee discounts, VIP perks, and a historical rewards section. These improvements are designed to help the firm maintain its significant dominance while continuing to focus on integrity.

Hopefully, these improvements will allow the firm to maintain its significant dominance while maintaining its usual integrity. Last month, Binance Research identified some systemic problems with airdrops in general, and the exchange seems particularly concerned with its reputation.

The post Binance Dominates 94% of Crypto Airdrops and Staking Rewards appeared first on BeInCrypto.

Binance’s CZ Is Advising Kyrgyzstan On Crypto and Blockchain Adoption

Changpeng “CZ” Zhao, former CEO of Binance, is advising Kyrgyzstan on becoming a crypto hub. He signed an agreement with the Kyrgyz National Investment Agency to build the nation’s Web3 capacities.

A cornerstone of this plan is Kyrgyzstan’s A7A5 stablecoin, pegged to the Russian ruble and focused on emerging markets. CZ claimed that he has been advising several governments “officially and unofficially” regarding crypto.

CZ Helps Kyrgyzstan Drive Crypto Adoption

Countries worldwide are becoming more interested in crypto integration lately. Although Kyrgyzstan has not been a particular hub for crypto activity, it is trying to turn a new leaf.

According to the latest announcements, the country is developing a new A7A5 stablecoin pegged to the Russian ruble. Kyrgyzstan’s crypto turn is also being influenced by Changpeng “CZ” Zhao, the founder of Binance.

“A Memorandum of Understanding has been signed between the National Investment Agency under the President of the Kyrgyz Republic and Changpeng Zhao (CZ). In accordance with the Memorandum, the parties intend to cooperate in the development of the cryptocurrency and blockchain technology ecosystem in the Kyrgyz Republic,” claimed President Sadyr Zhaparov.

CZ is a very influential figure in crypto and has been involved with a few official governments in his career. For example, last month, allegations surfaced that he was working with President Trump to establish a new dollar-backed stablecoin.

Meanwhile, CZ acknowledged his business in Kyrgyzstan, claiming that he introduced President Zhaparov to X, the social media site.

“I officially and unofficially advise a few governments on their crypto regulatory frameworks and blockchain solutions for gov efficiency, expanding blockchain to more than trading. I find this work extremely meaningful,” CZ claimed via social media.

Although CZ’s connection with Kyrgyzstan’s new A7A5 stablecoin is not fully known, it would align with his recent alleged Trump dealings.

Zhaparov’s statement claimed that the Binance founder will provide infrastructural, technological support, technical expertise, and consulting services on crypto and blockchain technologies.

Also, the president went on to state that this agreement with CZ will strengthen Kyrgyzstan’s standing in the growing Web3 environment. The long-term plan is to help create new opportunities for Kyrgyz businesses and society as a whole.

Presumably, this will involve some cooperation with Russia, as A7A5’s press release mentions “a new class of digital assets tied to the Russian economy.” This stablecoin is bucking significant tradition by aligning with the ruble instead of the dollar.

However, this is part of its strategy to focus on emerging markets. This novel experiment could demonstrate new market opportunities and challenge the dominance of USD-pegged stablecoins in the region.

The post Binance’s CZ Is Advising Kyrgyzstan On Crypto and Blockchain Adoption appeared first on BeInCrypto.