Retard Finder Coin Posts 140% Jump Amid Musk Tie-Up Rumors | Meme Coins To Watch Today

The crypto market is facing massive volatility today, and amid this noise, some meme coins are able to pick up pace on recovery. One such coin is said to have ties with Tesla founder and US Department of Government Efficiency (DOGE) head Elon Musk.

BeInCrypto has analyzed two other meme coins for investors to watch and note which direction they are taking.

Retard Finder Coin (RFC)

  • Launch Date – March 2025
  • Total Circulating Supply – 961.43 Million RFC
  • Maximum Supply – 1 Billion RFC
  • Fully Diluted Valuation (FDV) – $39.83 Million

RFC price surged by 141% over the past 24 hours, continuing its uptrend this week. The meme coin gained attention after Elon Musk’s interactions with its official X (formerly Twitter) page. This triggered a speculative surge in interest, helping RFC capitalize on the increased attention and rising market sentiment.

Musk’s indirect association with Retard Finder Coin has sparked speculation, although no direct evidence confirms his involvement. Despite this uncertainty, RFC’s price has risen to $0.040. If the speculation continues, the altcoin could see further gains, potentially reaching the $0.050 resistance level in the short term.

RFC Price Analysis.
RFC Price Analysis. Source: TradingView

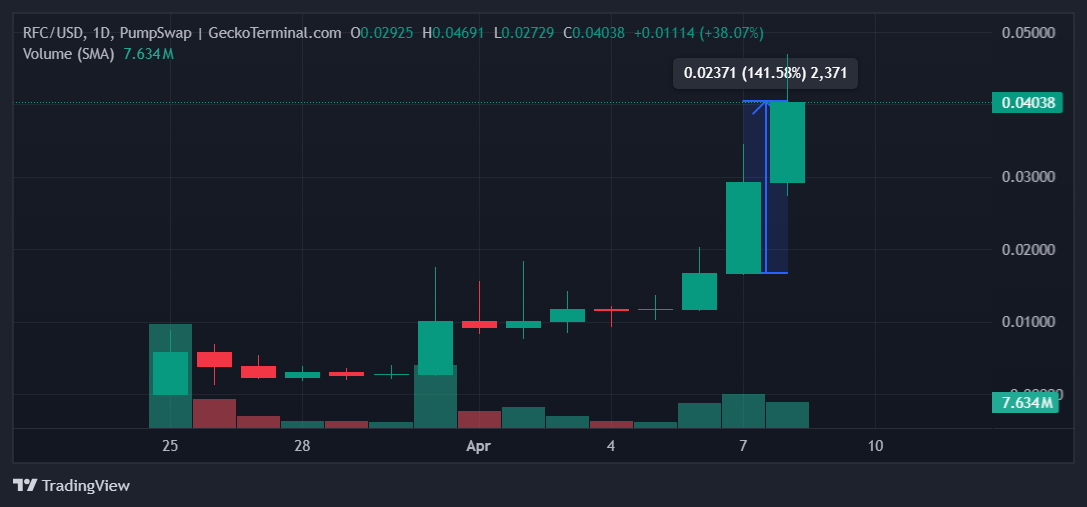
Despite its recent rise, RFC remains a meme coin with inherent volatility. The altcoin faces the risk of rapid selling by investors, which could lead to a quick price pullback. If this occurs, RFC might fall to $0.030 or even $0.020, making it crucial for investors to approach with caution.

Fartcoin (FARTCOIN)

  • Launch Date – October 2024
  • Total Circulating Supply – 999.99 Million FARTCOIN
  • Maximum Supply – 1 Billion FARTCOIN
  • Fully Diluted Valuation (FDV) – $588.26 Million

FARTCOIN saw a 32% rise in the last 24 hours, trading at $0.591. The meme coin is now nearing the resistance level of $0.600. If this momentum continues, FARTCOIN could break through this barrier and continue its upward movement, heading toward new highs in the coming sessions.

In the past, the $0.600 resistance has halted FARTCOIN’s rally, preventing further price gains. However, if the current bullish trend persists, FARTCOIN could overcome this barrier and rise toward $0.693. This level marks the next target for the altcoin, supported by positive market sentiment and strong investor interest.

FARTCOIN Price Analysis.
FARTCOIN Price Analysis. Source: TradingView

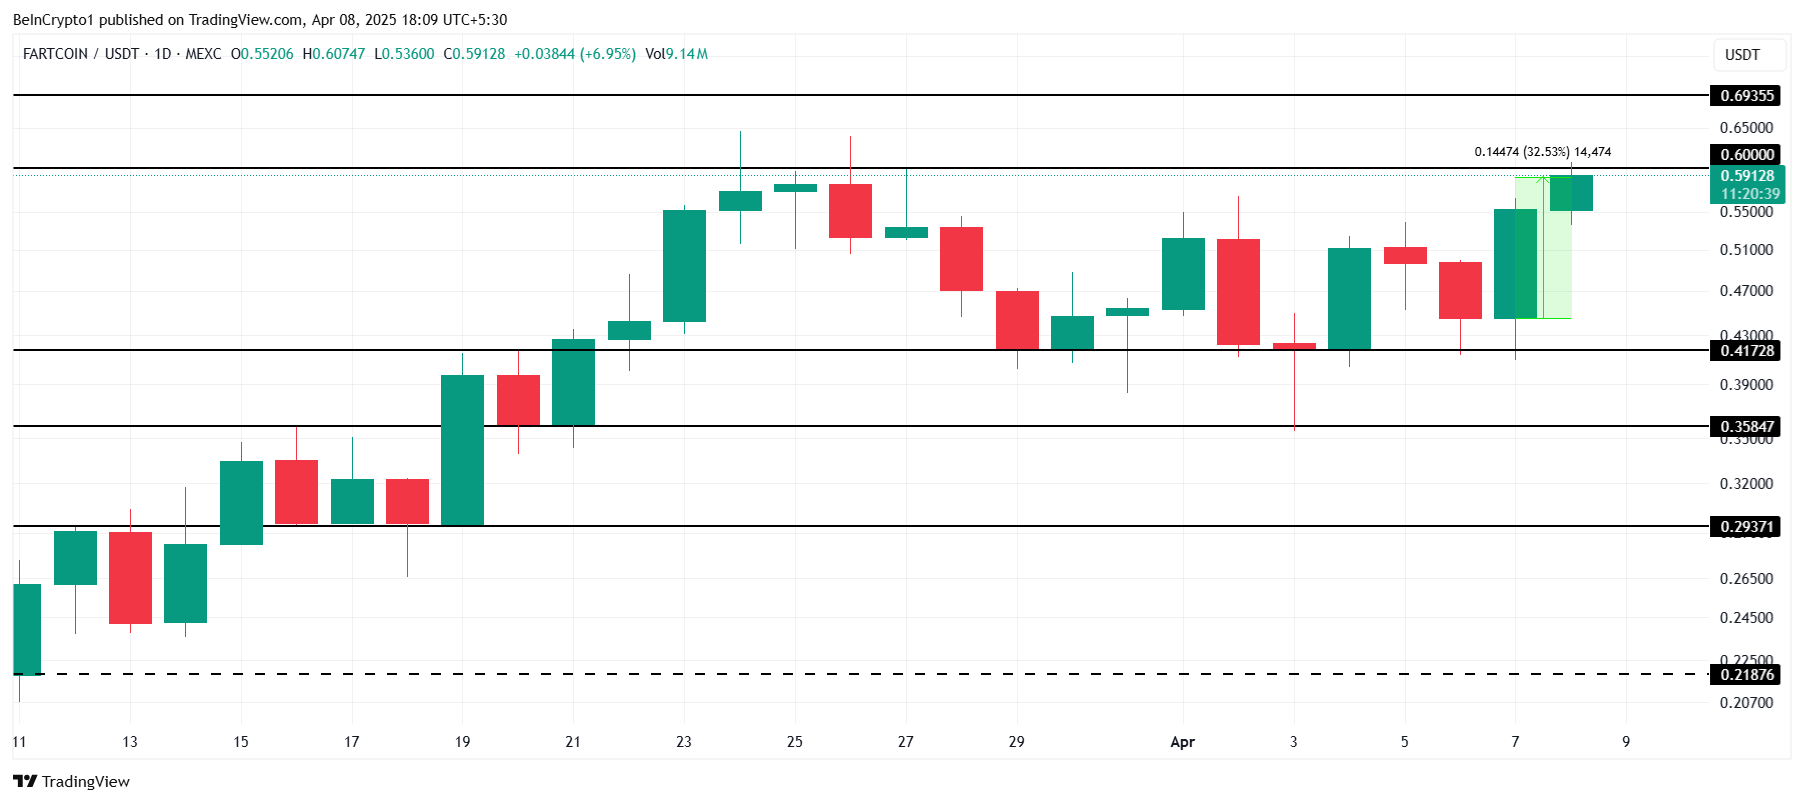
If the resistance level proves too strong, FARTCOIN may experience a pullback. A failure to breach $0.600 could lead to a decline back to $0.417 or even lower, erasing recent gains. This scenario would invalidate the bullish outlook and extend the downtrend if selling pressure intensifies.

Mog Coin (MOG)

  • Launch Date – July 2023
  • Total Circulating Supply – 390.5 Trillion MOG
  • Maximum Supply – 420 Trillion MOG
  • Fully Diluted Valuation (FDV) – $135.64 Million

MOG price surged by 25% in the last 24 hours, providing relief after a steep 50% decline during March’s end. This recovery signals the potential for further growth as the meme coin attempts to regain momentum and distance itself from recent losses. The recent rise could lead to more positive movements.

At the time of writing, MOG is trading at $0.000000346, just below the key resistance level of $0.000000370. If it breaches this level, MOG could gain enough momentum to push toward $0.000000433. This breakthrough would mark a significant recovery and extend its upward trend further in the coming days.

MOG Price Analysis.
MOG Price Analysis. Source: TradingView

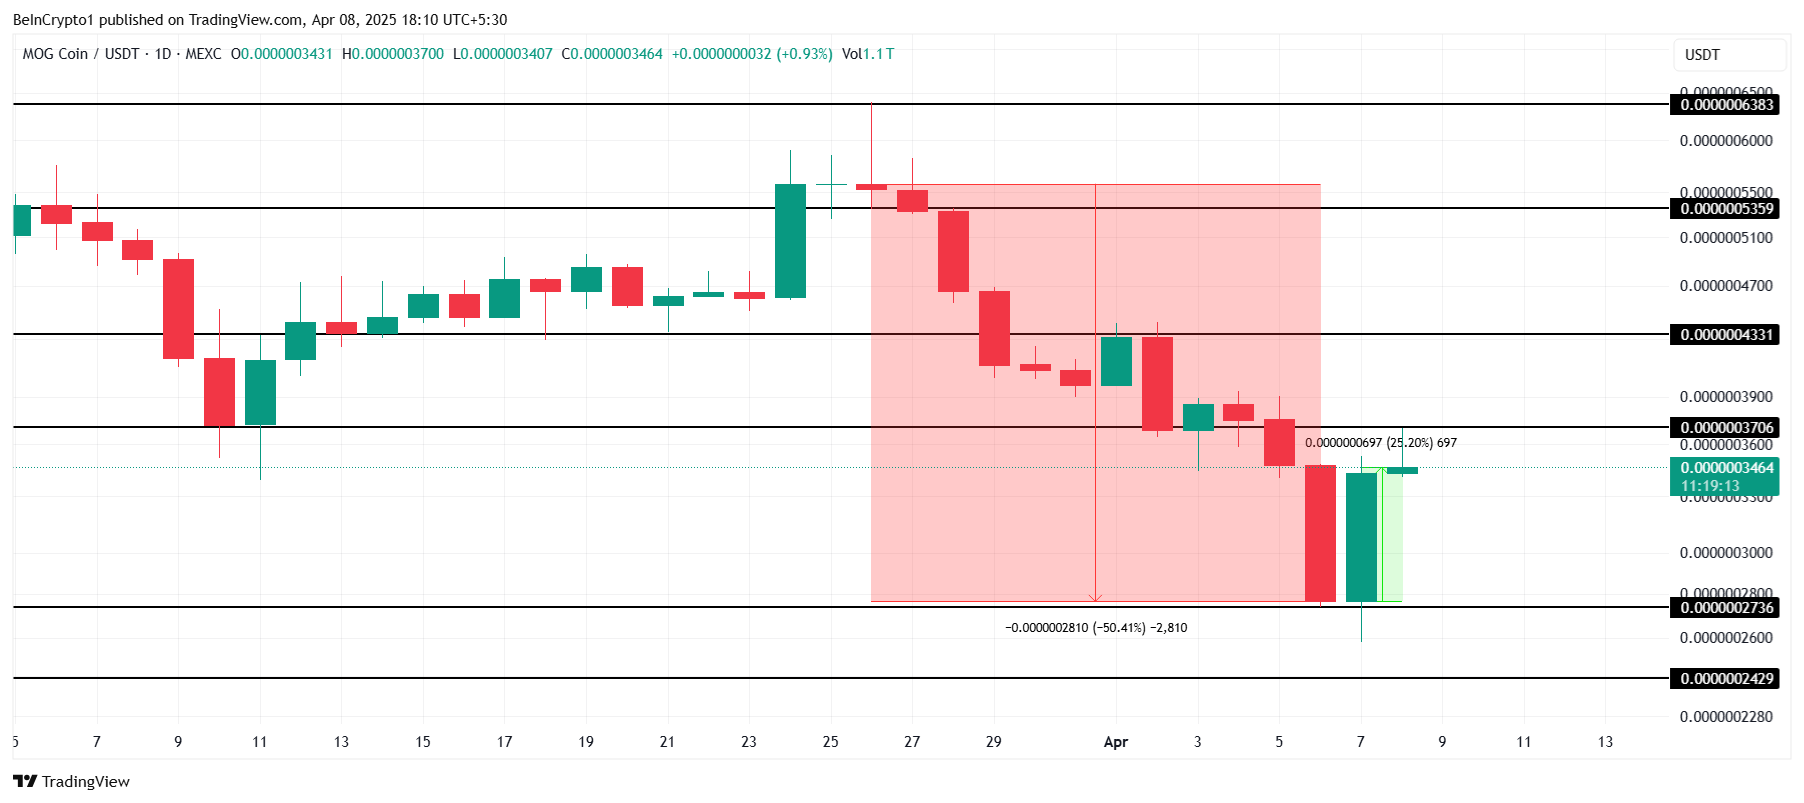
However, if MOG fails to breach $0.000000370, the altcoin may experience a decline. The next major support lies at $0.000000273, and if this level is tested, it could wipe out recent gains. In such a scenario, the bullish outlook would be invalidated, signaling a continued struggle for the meme coin.

The post Retard Finder Coin Posts 140% Jump Amid Musk Tie-Up Rumors | Meme Coins To Watch Today appeared first on BeInCrypto.

XRP Could Overtake Ethereum by 2028, says Standard Chartered | US Crypto News

Welcome to the US Morning Briefing—your essential rundown of the most important developments in crypto for the day ahead.

Grab a coffee to see why Standard Chartered thinks XRP could soon leapfrog Ethereum, how Tether’s institutional pivot might reshape the stablecoin market, and how players like BlackRock, Galaxy Digital, and the Federal Reserve could shape crypto’s next chapter.

Standard Chartered says XRP Set to Outperform, Could Overtake Ethereum by 2028

As global trade tensions intensify, Standard Chartered sees a silver lining for crypto investors, urging them to focus on long-term winners poised to benefit from the disruption.

“Tariff noise creates the opportunity to look for long-term value/pick winners in Digital Assets for the next leg higher. Today we add XRP to that list of winners (BTC and AVAX other identified winners, ETH identified loser). XRP’s core use is as a cross-border and cross-currency payments platform. That part of Digital Assets is undergoing a shift higher in volumes, something we see continuing. By the end of 2028 we see XRP’s market cap overtaking Ethereum’s. That will make XRP the second largest (non-stablecoin) Digital Asset at that time. Keep looking for winners and HODLing those you already own”, Geoff Kendrick, Standard Chartered’s Head of Digital Asset Research, in an email to BeInCrypto.

Kendrick also pointed to Bitcoin’s resilience as a signal of what’s to come for the broader crypto market.

Tariff mess will be over soon, and Bitcoin’s solid performance during the noise tells us a leg higher for the asset class will follow” he said.

He also points out important points about the recent performance of XRP:

“XRP price rose 6x in the two months following Trump’s election victory, the strongest performance among the top 15 digital assets by market cap. This reflected market expectations that the SEC would drop its appeal of a court ruling concerning Ripple, as well as the potential for XRP ETFs to be approved under new SEC leadership.”

It’s also important to point out that Ripple recently announced the acquisition of prime broker Hidden Road for $1.25 billion to expand institutional services.

But Kendrick believes the fundamentals — not just politics — are driving XRP’s momentum.

“We think these gains are sustainable, not just because of recent leadership changes at the SEC but also because XRP is uniquely positioned at the heart of one of the fastest-growing uses for digital assets – facilitation of cross-border and cross-currency payments. In this way, XRPL is similar to the main use case for stablecoins such as Tether: blockchain-enabled financial transactions that have traditionally been done through traditional financial (TradFi) institutions. This stablecoin use has grown 50% annually over the past two years, and we expect stablecoin transactions to increase 10x over the next four years. We think this bodes well for XRPL’s throughput growth, given the similar use cases for stablecoins and XRPL.”

Tether’s Big Play: Institutional-Grade Stablecoin Targets US Market

With institutional adoption accelerating, Tether’s plan to launch a US-focused, institutional-grade stablecoin could be a defining moment for stablecoins — and a major step toward mainstream crypto integration.

Charles Wayn, co-founder of decentralized Web3 super-app Galxe, told BeInCrypto that:

“The news that Tether is planning to launch an institutional-grade stablecoin for the US market is fantastic for the crypto industry. Tether pioneered stablecoins with its first launch over a decade ago in 2014, and its flagship product — USDT — is now the third largest cryptocurrency in the world. Unlike its rival, USDC, USDT has never been formally audited, leading to frequent questions over its balance sheet. Nonetheless, it remains the industry’s favored stablecoin, shown by its market cap of over $144 billion, which is well over double the size of USDC’s $60 billion.”

Wayn believes this move, along with Tether’s push for transparency, positions the company as a future leader in institutional crypto adoption.

“As such, this move, combined with other recent news that Tether is seeking a full audit from a Big Four accounting firm, shows that the company is not only willing to be compliant but also be a leader in institutional adoption. While USDT sadly did not pass the EU’s directive on stablecoins under MiCA, this new product will likely be designed to pass new legislation coming from the US.”

He adds that institutional momentum — fueled by players like BlackRock — reinforces why now is a pivotal moment for stablecoins and broader market stability.

“As such, there is little doubt that USDT will work hard to launch its new product in good time. As we see huge institutions like BlackRock further entering the market with another $66 million purchase of Bitcoin last week, along with the rapid growth of its RWA BUIDL fund, institutional adoption is now taking off rapidly.”

Crypto Chart of the Day

Total Stablecoin Market Cap and BTC Price. Source: Coinglass.

Stablecoins total market cap is currently close to its all-time highs, above $210 billion.

Byte-Sized Alpha

– Analysts warn that a return to Quantitative Easing in 2025 could ignite a massive crypto rally, potentially pushing Bitcoin toward $1 million and sparking a surge in altcoins.

Zero inflows into Bitcoin ETFs and declining futures interest hint at fading investor confidence, though rising put contracts and positive funding rates point to cautious optimism.

Galaxy Digital secures SEC approval to reorganize and move toward a May 2025 Nasdaq listing, signaling renewed confidence in crypto amid improving US policy support.

– Binance Research shows that during tariffs, RWA tokens outperform Bitcoin, as rising macro pressures weaken BTC’s role as a diversification asset.

MicroStrategy’s pause in Bitcoin buying last week, amid $5.91 billion in unrealized losses, signals growing caution and raises questions about liquidity, debt, and broader institutional confidence.

Potential Fed rate cuts could breathe new life into crypto by boosting risk appetite and weakening the dollar, though uncertainty remains amid Larry Fink’s skepticism.

The post XRP Could Overtake Ethereum by 2028, says Standard Chartered | US Crypto News appeared first on BeInCrypto.

Solana’s (SOL) 7% Rally Could Unwind as Traders Bet Against Uptrend

Solana has posted a 7% increase in the past 24 hours, aligning with the broader market’s recovery. While this surge may appear promising, technical and on-chain data suggest that the coin could face significant resistance. 

Despite the recent rally, SOL risks shedding these gains and could fall below the $100 mark if bearish pressures dominate.

Solana’s Price Surge Lacks Momentum

While impressive, SOL’s current rally largely reflects the broader market trend rather than demand for the altcoin. The bearish divergence formed by its Chaikin Money Flow (CMF) shows this.

At press time, SOL’s CMF is below the zero line at -0.09, indicating a lack of buying momentum among SOL market participants. 

SOL CMF.
SOL CMF. Source: TradingView

The CMF indicator measures money flow into and out of an asset.  A bearish divergence emerges when the CMF is negative while the price is climbing. The divergence signals that despite the upward movement, there is more selling pressure than buying interest, suggesting weak bullish momentum. 

This indicates that SOL’s current price rally may lack sustainability and could be at risk of reversing or stalling as new demand remains scarce. 

Further, the coin’s long/short ratio highlights that its market participants lean more heavily toward the short side. At press time, this stands at 0.97.

SOL Long/Short Ratio
SOL Long/Short Ratio. Source: Coinglass

The long/short ratio measures the balance between long positions (betting on price increases) and short positions (betting on price decreases) in the market. When the ratio is below zero like this, it indicates that there are more short positions than long positions.

This suggests that bearish sentiment remains dominant in the SOL market, and its futures traders are anticipating a decline in the asset’s price.

Solana in Crucial Zone: Will $95 Hold or Lead to a Steeper Decline?

During Monday’s intraday trading session, SOL plummeted to a 12-month low of $95.26. Although it has since rebounded to trade at $108.77 at press time, the lingering bearish bias leaves the coin at risk of shedding these gains.

If SOL witnesses a pullback, it could break below the support at $107.88. If it falls back below $100, the coin’s price could fall toward $79.

SOL Price Analysis.
SOL Price Analysis. Source: TradingView

On the other hand, if the uptrend continues, backed by a surge in new demand, SOL’s price could breach the resistance at $111.06 and climb toward $130.82.

The post Solana’s (SOL) 7% Rally Could Unwind as Traders Bet Against Uptrend appeared first on BeInCrypto.

Bitcoin and US Stock Markets Hinge on Trump-China Tariff Deal Hopes

Crypto and TradFi markets had a strong opening today, as Bitcoin briefly jumped 5% due to optimism about a tariff deal. China and institutional investors in the US wish to avoid a trade war if possible.

Despite these encouraging signs, no deal has actually been reached, and Bitcoin also suffered subsequent losses. The whole market is in a state of flux until the situation becomes more clear.

How Will Bitcoin Perform Under Tariffs?

The crypto markets are full of fear right now, and it’s difficult to determine a safe bet moving forward. Since the market suffered huge liquidations yesterday, it opened with cautious optimism today.

This trend was particularly influenced by Bitcoin, which briefly jumped around 5% due to hopes about a potential deal on Trump’s tariffs.

bitcoin price chart
Bitcoin Daily Price Chart. Source: TradingView

The price of Bitcoin has fluctuated wildly due to the tariffs as speculation about a sell-off increases. However, the whole market is in a chaotic state right now.

Today, the Dow Jones Industrial Average surged 1,285 points, or 3.4%, while the S&P 500 and Nasdaq Composite both jumped 3.4% and 3.3%, respectively. Nonetheless, hundreds of stocks have fallen 20% or more.

Stock Market Reacts to Tariffs
Stock Market Reacts to Tariffs. Source: The Kobeissi Letter

Meanwhile, Bitcoin has a few advantages that can protect it from tariff volatility. For example, a recent report from Binance Research claims that the least risky cryptoassets are the most insulated from drops.

This includes RWAs and centralized exchanges, but Bitcoin is a close third.

Furthermore, the markets are very optimistic about a deal to avoid the tariffs. Yesterday, rumors of a pause triggered a trillion-dollar rally, highlighting traders’ desperation for good news.

Despite the retaliatory tariffs, China is similarly eager to avoid a full-blown trade war with the US. Trump claimed that he is making progress with China and South Korea, fueling optimism.

Nonetheless, it’s important not to overstate Bitcoin’s chances of success under tariffs. Despite the hopes on both sides of the Pacific, China confirmed that it’s prepared to fight a trade war if Trump forces its hand.

This might explain Bitcoin’s price drops despite its strong performance since yesterday. Ultimately, all we can do is wait and hope.

The post Bitcoin and US Stock Markets Hinge on Trump-China Tariff Deal Hopes appeared first on BeInCrypto.

SUI Price Falling 30% Triggers Outflows And Skepticism As Losses Extend

SUI has experienced significant volatility in recent weeks, with its price fluctuating amidst a 30% decline. This decline has been accompanied by rising outflows as investors and traders react to the altcoin’s uncertain short-term outlook. 

However, despite these challenges, SUI has managed to hold above the crucial $2.00 support level.

SUI Traders Are Skeptical

Data from futures markets reveals that SUI recently experienced a two-month high in short liquidations, contributing to a total of $12 million in liquidations over a single day. These liquidations reflect the increased skepticism among traders, as many were forced to close their positions amid a rising bearish sentiment. The liquidations highlight the challenges faced by SUI traders, whose bullish outlook failed to materialize.

Despite the short liquidations, the volatility and liquidation events may have contributed to investor caution. The actions of traders, who quickly pulled their positions in the face of adversity, further underscore the uncertain sentiment surrounding the asset. With this pressure on traders, the market could see less buying activity in the near term, keeping bullish momentum subdued.

SUI Liquidations.
SUI Liquidations. Source: Coinglass

On a broader scale, the Chaikin Money Flow (CMF) indicator, which tracks capital inflows and outflows, signals rising skepticism about SUI’s price trajectory. Since the beginning of the month, the CMF has moved below the zero line, reflecting more outflows than inflows. This suggests that investors are hesitant, and the lack of buying pressure could hinder any immediate price recovery.

Given that the CMF is an essential indicator of market sentiment, its position below zero adds weight to concerns regarding SUI’s current market position. As the outflows continue, skepticism is likely to persist, making it more difficult for the altcoin to achieve sustained upward movement. 

SUI CMF
SUI CMF. Source: TradingView

SUI Price Is In Danger

SUI’s price currently stands at $2.04, having dipped 30% over the past ten days. Despite this drop, the altcoin has managed to hold above the $2.00 support level, indicating some resilience. 

If the bearish sentiment continues, SUI could face a further decline, with $1.75 potentially acting as the next level of support. Should the current trend persist, SUI’s inability to maintain its position above $2.00 could lead to additional losses. 

SUI Price Analysis.
SUI Price Analysis. Source: TradingView

However, if SUI secures $2.22 as support and rallies from there, it could reclaim upward momentum and push past the resistance at $2.47. Should SUI surpass $2.77, the bearish outlook would be invalidated, opening the door for potential growth.

The post SUI Price Falling 30% Triggers Outflows And Skepticism As Losses Extend appeared first on BeInCrypto.

Will Ethereum (ETH) Price Fall to $1,000 in April?

Ethereum (ETH) is down almost 6% in the last 24 hours, intensifying a week of sharp declines. With the price below $1,500, market watchers are increasingly questioning whether ETH could fall to $1,000 in April.

Mounting concerns around liquidations, declining network activity, and bearish technicals are fueling the debate. As investor sentiment wavers, the next few days could prove critical for Ethereum’s short-term trajectory.

If ETH Falls Below $1200, Nearly $342 Million Will Be Liquidated

Ethereum is currently hovering just above the $1,500 mark, down more than 15% over the past week as bearish pressure intensifies across the crypto market.

The recent downturn has sparked concern among traders, especially with ETH struggling to hold key support levels. Standard Chartered recently stated that XRP could overtake Ethereum by 2028.

The decline reflects broader risk-off sentiment and uncertainty surrounding altcoins, with Ethereum now teetering dangerously close to levels that could trigger a major wave of liquidations.

Ethereum Liquidations.
Ethereum Liquidations. Source: DeFiLlama.

According to on-chain data, if ETH falls below $1,200, it could trigger liquidations totaling approximately $342 million across leveraged positions.

Liquidation occurs when traders who borrowed capital to go long on Ethereum are forced to sell their holdings due to falling prices. This effectively amplifies the downside and adds more selling pressure.

Weighing in on the situation, investor Peter Schiff took to X, warning that he doesn’t think it will take long before Ethereum crashes below $1,000 — a level not seen since January 2021.

Ethereum TVL Is Down 43% Since December

Ethereum’s total value locked (TVL) has been in sharp decline since peaking at $86.6 billion in December — its highest level since mid-2022.

As of now, Ethereum’s TVL has dropped to $49.34 billion, marking a steep 43% decrease in just a few months.

This decline highlights waning user activity and capital outflows from Ethereum-based protocols, raising fresh concerns about the network’s short-term momentum.

Ethereum TVL.
Ethereum TVL. Source: DeFiLlama.

TVL measures the total capital deposited into decentralized finance (DeFi) protocols on a blockchain and serves as a key indicator of ecosystem health and investor confidence.

A rising TVL generally signals growing trust and usage of DeFi applications, while a falling TVL suggests declining demand and reduced engagement.

Ethereum’s TVL is now hovering at multi-month lows, which could be a bearish signal for ETH’s price. This reflects reduced utility and less capital circulating through the network, both of which could put further downward pressure on the asset if the trend continues.

Ethereum Is Currently 70% Down From Its All-Time High

Ethereum’s price has been trading below $2,000 since March 26, and its technical indicators don’t look promising.

The current setup of its Exponential Moving Averages (EMAs) shows a bearish formation, with short-term EMAs positioned below the longer-term ones — a classic signal of ongoing downside momentum.

This suggests that sellers are still in control, and the market could be bracing for further correction.

ETH Price Analysis.
ETH Price Analysis. Source: TradingView.

If bearish momentum continues, Ethereum may retest support near $1,400. A breakdown below that level could trigger a deeper sell-off, with Ethereum price potentially sliding toward $1,000 in April — a key psychological and historical level.

However, if bulls regain control and reverse the trend, ETH could first challenge resistance at $1,749.

A breakout above that would open the door for a test of $1,954, and if momentum stays strong, Ethereum could push past the $2,000 barrier and aim for $2,104.

The post Will Ethereum (ETH) Price Fall to $1,000 in April? appeared first on BeInCrypto.

OM Price Remains Positive as MANTRA Announces $108 Million RWA Fund

MANTRA is planning to launch a $108,888,888 Ecosystem Fund to drive RWA innovation over the next four years and help accelerate projects in MANTRA’s blockchain ecosystem.

MANTRA’s native token OM has shown significant resilience in the current market downturn. OM is currently the only altcoin among the top 30 tokens to have posted positive gains over the past 24 hours. 

MANTRA’s RWA Ecosystem Fund

MANTRA, a Layer-1 blockchain for asset tokenization, is heavily invested in the RWA market. Since its mainnet launch in 2024, it has carried out major partnerships and planned to tokenize huge volumes of assets.

Today, it announced the launch of a $108,888,888 Ecosystem Fund to propel RWA innovation in its blockchain ecosystem.

“In an era where blockchain technology is revolutionizing finance, the MEF will serve as a catalyst for groundbreaking projects that drive real-world adoption through a focus upon the tokenization of real world assets. We are opening doors for visionary founders and teams to join us in building and creating a thriving ecosystem,” claimed John Patrick Mullin, founder and CEO.

Mullin delivered these comments in an exclusive press release shared with BeInCrypto. MANTRA plans to deploy this fund over the next four years, working with “a strong network of partners and investors” to maximize RWA growth.

The firm also claimed that its new license approvals in Dubai will allow it to facilitate advanced financial services.

MANTRA successfully obtained a Virtual Asset Service Provider (VASP) license, which will allow it to act as a crypto exchange and offer broker-dealer, management, and Investment Services. With these tools, the network can direct RWA investment.

Since the RWA Fund announcement, the OM token has actually performed quite well today. Given the wide-scale liquidations across the crypto market due to Trump’s tariff threats, OM has gained over 2% in the past 24 hours.

In fact, MANTRA’s native token is the only cryptocurrency among the top 30 to have any positive gains. It’s also among the top 5 highest gainers in the market today.

mantra (OM) price chart
MANTRA (OM) Daily Price Chart. Source: BeInCrypto

Overall, investors seem extremely confident in MATRA’s growth and the network’s continuous development. The project’s latest investment fund reflects its commitment to influencing positive developments in the RWA ecosystem.

Meanwhile, the find will likely encourage more RWA projects to launch or shift to the network, increasing MANTRA’s utility. According to DefiLlama, the network only has $4.2 million in total value locked (TVL).

With this fund, the project’s main goal will be to improve participation and long-term engagement on the blockchain.

The post OM Price Remains Positive as MANTRA Announces $108 Million RWA Fund appeared first on BeInCrypto.

What Crypto Whales Are Buying After the Black Monday Crash

Crypto whales are making quiet moves in Ethereum (ETH) and Optimism (OP), while accumulation remains stagnant—or even negative—across most other major coins. Between April 4 and 6, both ETH and OP saw a notable increase in large wallet holders despite a harsh market correction.

This behavior often signals early confidence from institutional players, hinting at potential reversals ahead. With ETH nearing $1,400 and OP trading at three-year lows, the next few days could be pivotal if whale accumulation translates into renewed bullish momentum.

Ethereum (ETH)

Between April 5 and April 6, crypto whales accumulated ETH. The number of Ethereum whale wallets—those holding between 1,000 and 10,000 ETH—increased from 5,340 to 5,388, signaling a quiet accumulation phase during the broader market correction.

Tracking these large holders is crucial, as their behavior often precedes major market moves; when whales accumulate, it can indicate growing confidence in the asset’s long-term value and hint at a potential trend reversal.

Number of Addresses Holding Between 1,000 and 10,000 ETH.
Number of Addresses Holding Between 1,000 and 10,000 ETH. Source: Santiment.

If Ethereum’s current downtrend continues, ETH price could break below $1,400 for the first time since January 2023, opening the door to deeper losses.

However, the recent uptick in whale activity suggests some optimism beneath the surface. If momentum shifts and ETH manages to reclaim $1,748, it could rise further toward $1,938 and, with a strong enough rally, even retest the $2,000 mark—restoring a key psychological and technical level for bulls.

Optimism (OP)

The number of Optimism whale wallets—holding between 10,000 and 1,000,000 OP—rose from 4,138 on April 4 to 4,151 on April 6, suggesting that large holders are accumulating despite the ongoing market correction.

This increase in whale activity may indicate long-term confidence in the project, even as the broader market faces heavy selling pressure.

In periods of uncertainty like now, such accumulation can be an early sign of a potential price reversal, as institutional or high-net-worth investors often act ahead of retail sentiment.

Number of Addresses Holding Between 10,000 and 1,000,000 OP.
Number of Addresses Holding Between 10,000 and 1,000,000 OP. Source: Santiment.

Currently trading near its lowest levels in nearly three years, OP is under significant downward pressure. If the correction persists, the token could break below the $0.50 support level.

However, if the recent whale accumulation reflects a shift in momentum, OP could rebound to test resistance at $0.65.

A breakout from that level may open the path toward $0.77 and, in a stronger recovery, even retest $0.84.

The post What Crypto Whales Are Buying After the Black Monday Crash appeared first on BeInCrypto.

XRP Eyes Rebound After Hitting Oversold Levels

XRP is down over 5% in the past 24 hours but is currently attempting a rebound, trying to push above the $2 level. After touching deeply oversold RSI levels earlier today, the token is showing early signs of recovery amid shifting macro headlines.

Despite a bearish setup on the Ichimoku Cloud, a short-term bounce is not off the table if momentum builds. However, strong resistance zones remain overhead, and whether XRP can sustain this rebound will depend on both technical breakouts and broader market sentiment.

XRP RSI Is Going Up After Touching Oversold Levels

XRP’s Relative Strength Index (RSI) is currently sitting at 44.24, bouncing back after briefly plunging to 17.80 earlier today—its lowest level in weeks, with its price rebounding after news about Trump considering a 90-day pause in tariffs for all countries except China.

Just a day ago, the RSI was at 46.97, reflecting the sharp volatility XRP has experienced during the recent market sell-off. The RSI is a momentum indicator that ranges from 0 to 100, typically used to identify whether an asset is overbought (above 70) or oversold (below 30).

XRP RSI.
XRP RSI. Source: TradingView.

An RSI reading of 44.24 places XRP in neutral territory, suggesting that the selling pressure may be easing, but momentum remains weak. Importantly, XRP hasn’t crossed into overbought territory for nearly three weeks, signaling a lack of sustained bullish momentum.

If the RSI continues to climb and breaks above 50, it could indicate growing strength and potential price recovery. However, if it stalls or turns lower, XRP may continue to struggle for direction in the short term.

XRP Ichimoku Cloud Shows a Bearish Setup, But A Recovery Could Be On The Horizon

The Ichimoku Cloud chart for XRP shows a bearish structure. The price is trading well below the Kumo (cloud), indicating strong downward momentum.

Both the Tenkan-sen (blue line) and Kijun-sen (red line) are sloping down and currently positioned above the price, acting as dynamic resistance levels.

The cloud ahead is red and wide, suggesting continued bearish pressure and little immediate sign of a trend reversal.

XRP Ichimoku Cloud.
XRP Ichimoku Cloud. Source: TradingView.

However, the recent bullish candle pushing toward the Tenkan-sen hints at a possible short-term bounce or relief rally.

For a true trend shift, XRP would need to break above both the Tenkan-sen and Kijun-sen and eventually enter or surpass the cloud—a scenario that remains distant given the current formation.

Overall, the Ichimoku setup reinforces the broader weakness, with any upside likely facing strong resistance from the cloud and key lines.

Could XRP Break Above $2.20 Soon?

XRP price recently broke below the $1.80 mark for the first time since November 2024, reflecting heavy market pressure and a sharp sell-off. However, the asset has shown signs of recovery in the past few hours, attempting to regain momentum.

If this rebound gains strength, XRP could push toward resistance at $2.02, and a successful breakout may open the path to higher levels around $2.23.

XRP Price Analysis.
XRP Price Analysis. Source: TradingView.

On the flip side, if XRP fails to sustain its current recovery, the price could drop back below $1.80 and revisit support near $1.61.

A breakdown from that level would increase bearish pressure, potentially dragging the price down toward the $1.50 zone.

The post XRP Eyes Rebound After Hitting Oversold Levels appeared first on BeInCrypto.

Can the Federal Reserve’s Interest Rate Cuts Revive Crypto Markets?

The Federal Reserve is having a closed-door meeting today to discuss potentially cutting interest rates. This would help crypto in a few ways, spurring risky investments and possibly even weakening the dollar.

Fed Chair Jerome Powell has been hesitant to cut rates, but he is under a lot of pressure. BlackRock’s CEO Larry Fink is currently pessimistic about rate cuts, claiming that they may even increase this year.

Will the Fed Consider Rate Cuts?

Trump’s tariff threats have the entire market in freefall, as billions have been liquidated from crypto and TradFi alike. The rumor of a 90-day pause on tariffs caused a dramatic rally earlier today.

Soon after, the White House denied the rumors, resulting in a crash. However, the Federal Reserve is having a closed-door meeting today, and it may plan to cut interest rates:

“A closed meeting of the Board of Governors of the Federal Reserve System at will be held 11:30 am on Monday, April 7, 2025. The following matters of official Board business are tentatively scheduled to be considered at that meeting: review and determination by the Board of Governors of the advance and discount rates to be charged by the Federal Reserve Banks,” the Fed’s website read.

There are many reasons why the Federal Reserve could cut interest rates. High rates make fixed-income investments more attractive, drawing capital away from riskier assets like stocks and cryptocurrencies, while low rates make these assets more attractive.

Rate cuts have often corresponded with market rallies, especially with ZIRP after the 2008 crash.

Now that most of the market is predicting a recession, the Federal Reserve could cause a rally with these rate cuts. The crypto market recently hoped for rate cuts, which the FOMC quickly rejected.

Fed Chair Jerome Powell initially signaled that he was reluctant to cut rates at this moment, but pressure has been building for him to do so. Unfortunately, that may not matter yet.

Larry Fink, BlackRock’s pro-crypto CEO, has been very pessimistic about possible cuts. In a recent televised interview, he claimed that most CEOs believe the US is already in a recession and that the country is currently not a “global stabilizer” in the markets.

Under these conditions, he stated that there’s a 0% chance of 4 to 5 rate cuts and that rates may even increase.

Are Interest Rate Cuts Always Bullish for Crypto?

When the Federal Reserve cuts interest rates, it isn’t a bullish signal across the board. They also tend to weaken the US dollar as its yield advantage diminishes relative to other currencies.

This would also be good for crypto, considering its use as a store of value, but the Fed isn’t particularly interested in that. The industry won’t be the deciding factor either way.

Still, other commentators have been highly skeptical of Fink’s claim. Powell is under a lot of pressure to cut rates, so raising them would buck market expectations. Investors are betting on multiple rate cuts, and these hypothetical cuts may be priced to a certain extent.

fed interest rate cut projection 2025
Fed Interest Rate Cut Projection 2025. Source: CME FedWatch

Looking back at previous cycles, periods of rate cuts have often coincided with market rallies. For instance, during the post-2008 recovery, rate cuts revived equity and emerging asset classes.

Overall, lower rates typically mean easier access to credit, leading to more liquidity in the market. This extra liquidity can help drive up demand for riskier assets, including cryptocurrencies.

So, If the FOMC signals a shift toward lower interest rates, this could boost overall market confidence. As traditional markets begin to stabilize and recover, crypto markets might experience a rebound.

Investor sentiment, already shaken by the recent sell-offs and heightened volatility, could turn more optimistic with the prospect of easing monetary conditions.

Most importantly, institutional investors, who have been cautious during the current volatile period, may adjust their strategies in a lower-rate environment.

With lower fixed-income yields, portfolio managers could increase their allocation to alternative assets, including cryptocurrencies, to achieve higher returns. This influx of institutional capital could lend credibility to the crypto market and help drive a recovery.

The post Can the Federal Reserve’s Interest Rate Cuts Revive Crypto Markets? appeared first on BeInCrypto.