Zora Announces Token Launch Date, Airdrops 10% of Total Supply
Zora Network — a dedicated layer-2 solution for NFTs — has officially announced the ZORA token airdrop, scheduled for April 23, 2025.
Launched in 2020, Zora has raised $60 million from investors such as Coinbase Ventures and Haun Ventures. The airdrop comes amid a cooling NFT market and ongoing debates around “content coins.”
Zora to Launch ZORA Token on April 23: Key Details
According to Zora’s official announcement, the airdrop will take place on April 23. It will be a retroactive airdrop aimed at users who have actively engaged with the platform.
The snapshot data splits into two phases:
- The first phase spans from January 1, 2020, to March 3, 2025.
- The second covers March 3, 2025, to April 20, 2025.
Zora plans to allocate 10% of its total 10 billion token supply—that is, 1 billion ZORA—for this airdrop. The Zora team will hold 18.9% of the supply, and strategic advisors and development supporters will control over 26%.

Moreover, Binance revealed it would list ZORA on Binance Alpha on April 23. Binance also announced an airdrop of 4,276 ZORA tokens to eligible users.
“Exclusively for users who have totally purchased at least $50 on Alpha using Spot or Funding accounts on Binance Exchange between 00:00:00 March 22, 2025 (UTC) to 23:59:59 April 20, 2025 (UTC),” Binance stated.
Currently, ZORA is trading at around $0.03 on pre-market platforms, which allow token trading before the official launch. This price suggests the airdrop is worth about $30 million. Zora Network’s fully diluted market cap sits at around $300 million.
Zora is more than an NFT marketplace. It also functions as a protocol that enables third parties to build and sell NFTs. One notable example is its recent integration with Base, Coinbase’s layer-2 project.
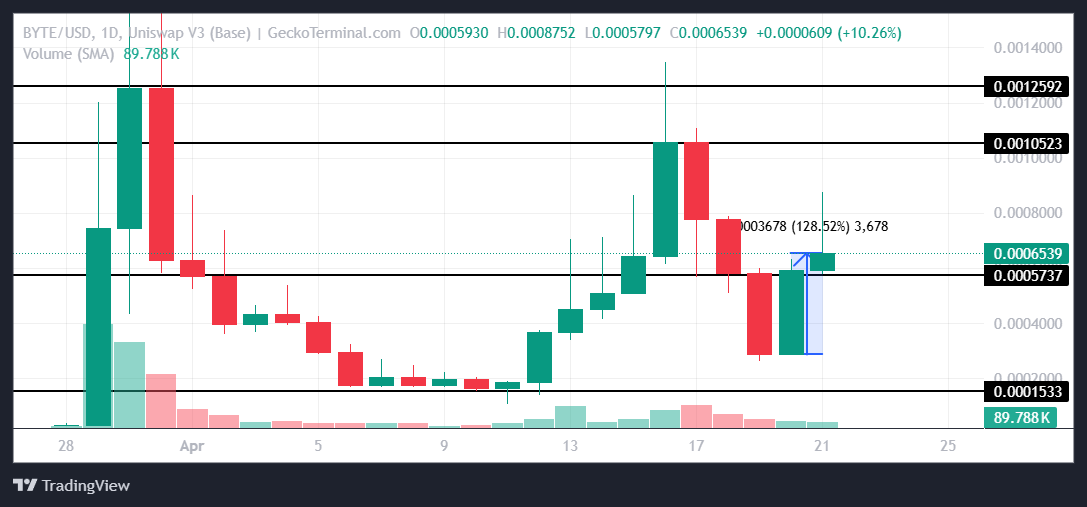
According to a recent report from BeInCrypto, Base used Zora to tokenize a post on X titled “Base is for everyone.” They turned it into an ERC-20 token. That post generated over $30 million in trading volume within 12 hours and earned $70,000 in profit.
However, the event sparked controversy. Some users accused Base of a “pump and dump” scheme after the token’s price plummeted 99% within four hours. At its peak, trading volume on Uniswap hit $13 million before collapsing.
Base denied that the token was a meme coin or a pump-and-dump plan. Still, the incident raised concerns about transparency in projects tied to Zora.
As of writing, data from Dune shows that Zora Network has processed over 87 million transactions. It currently attracts about 37,000 active addresses per day.

However, user activity has dropped sharply. The number of active users has declined by over 80% in the past year.
Moreover, a recent report from Binance indicates that the NFT market experienced a significant decline last month. Total sales volume across the top 10 blockchains decreased by 12.4%, which suggests weaker buyer interest.
The post Zora Announces Token Launch Date, Airdrops 10% of Total Supply appeared first on BeInCrypto.