Cardano (ADA) Indicators Show a Potential Golden Cross Forming

Cardano (ADA) is up 4% on Monday, trying to hit $0.65, showing signs of renewed bullish momentum. Technical indicators are beginning to align in favor of buyers, with the BBTrend turning positive for the first time in days and the DMI signaling strengthening upward pressure.

ADA is also nearing a potential golden cross formation on its EMA lines, which could further support a breakout if resistance levels are cleared. With momentum building and key levels in sight, Cardano is entering a critical zone that could define its short-term direction.

Cardano Shows Early Signs of Recovery as BBTrend Turns Positive

Cardano BBTrend has just flipped back into positive territory at 0.11, following four straight days in the negative zone. This shift, though subtle, may be the first sign of momentum stabilizing after recent weakness.

BBTrend, or Bollinger Band Trend, is a technical indicator that gauges the strength and direction of a trend based on how wide or narrow the Bollinger Bands are.

When the bands begin to expand and BBTrend moves into positive values, it often suggests growing volatility in favor of an emerging bullish trend. On the other hand, prolonged negative readings typically signal fading momentum and a lack of directional strength.

ADA BBTrend.
ADA BBTrend. Source: TradingView.

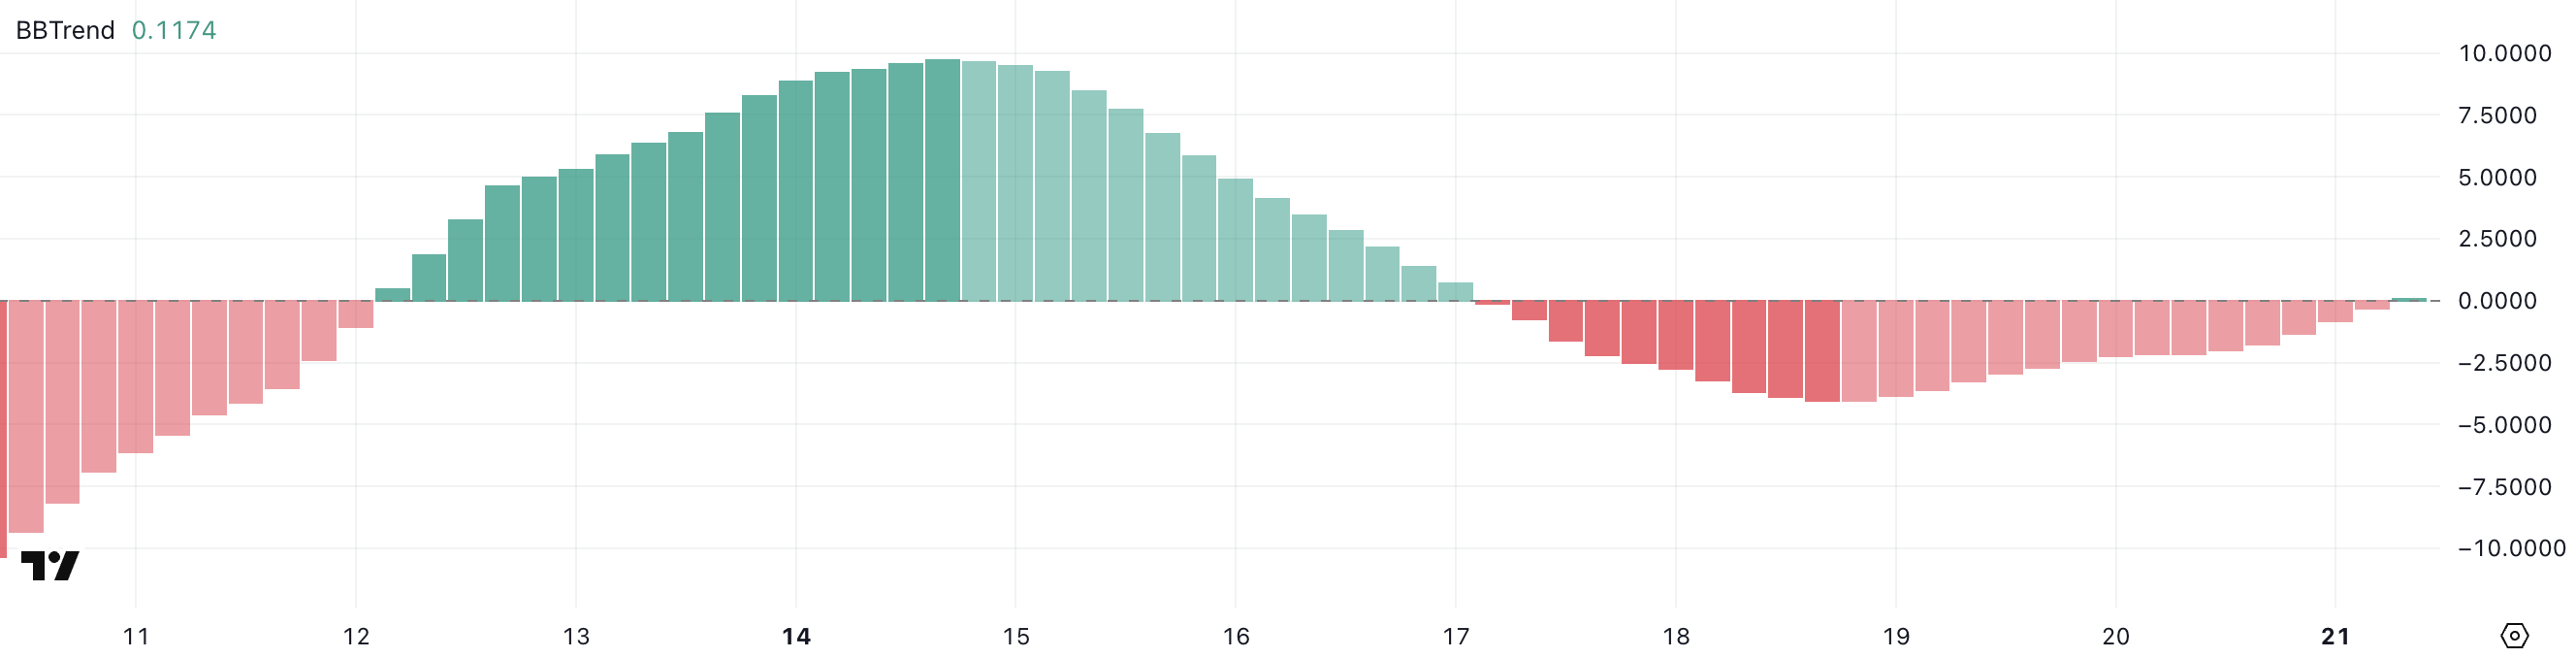
While a BBTrend of 0.11 is still low and not yet signaling a strong uptrend, the fact that it turned positive marks a potential inflection point.

It suggests that selling pressure may be fading and the price could be entering a recovery phase if buying activity increases. This early uptick in BBTrend often precedes a broader move.

Traders will likely be watching closely to see if this positive shift is sustained in the coming sessions, as continued gains in BBTrend could indicate the beginning of a more defined upward move for ADA.

Cardano Buyers Regain Control as Uptrend Shows Early Strength

Cardano Directional Movement Index (DMI) is showing a notable shift in momentum, with its Average Directional Index (ADX) climbing to 17.79, up from 13.77 yesterday.

The ADX measures the strength of a trend, regardless of its direction, on a scale from 0 to 100. Values below 20 suggest a weak or non-existent trend, while readings above 25 typically confirm that a trend is gaining strength.

ADA’s ADX is still below the 20 threshold but rising steadily—indicating that momentum is building and a stronger directional move could soon take shape.

ADA DMI.
ADA DMI. Source: TradingView.

Looking deeper, the +DI (positive directional indicator) has jumped to 26.38 from 16.30 just a day ago, signaling increased buying pressure. Although it has slightly pulled back from an earlier peak at 29.57, it remains firmly above the -DI (negative directional indicator), which has dropped significantly from 22.72 to 13.73.

This widening gap between the +DI and -DI suggests a clear shift in favor of bulls, with buyers regaining control after a brief period of selling pressure.

If the ADX continues to rise alongside a dominant +DI, it could confirm a strengthening uptrend for Cardano.

Cardano Nears Golden Cross as Bulls Eye Breakout—but Key Support Still in Play

Cardano price is approaching a potentially bullish technical development, as its EMA lines suggest a golden cross may form in the coming sessions.

A golden cross occurs when the short-term moving average crosses above the long-term moving average, often signaling the start of a stronger uptrend.

If this crossover is confirmed and ADA manages to break above the resistance at $0.668, the next upside targets sit at $0.709 and $0.77—levels not seen since late March.

ADA Price Analysis.
ADA Price Analysis. Source: TradingView.

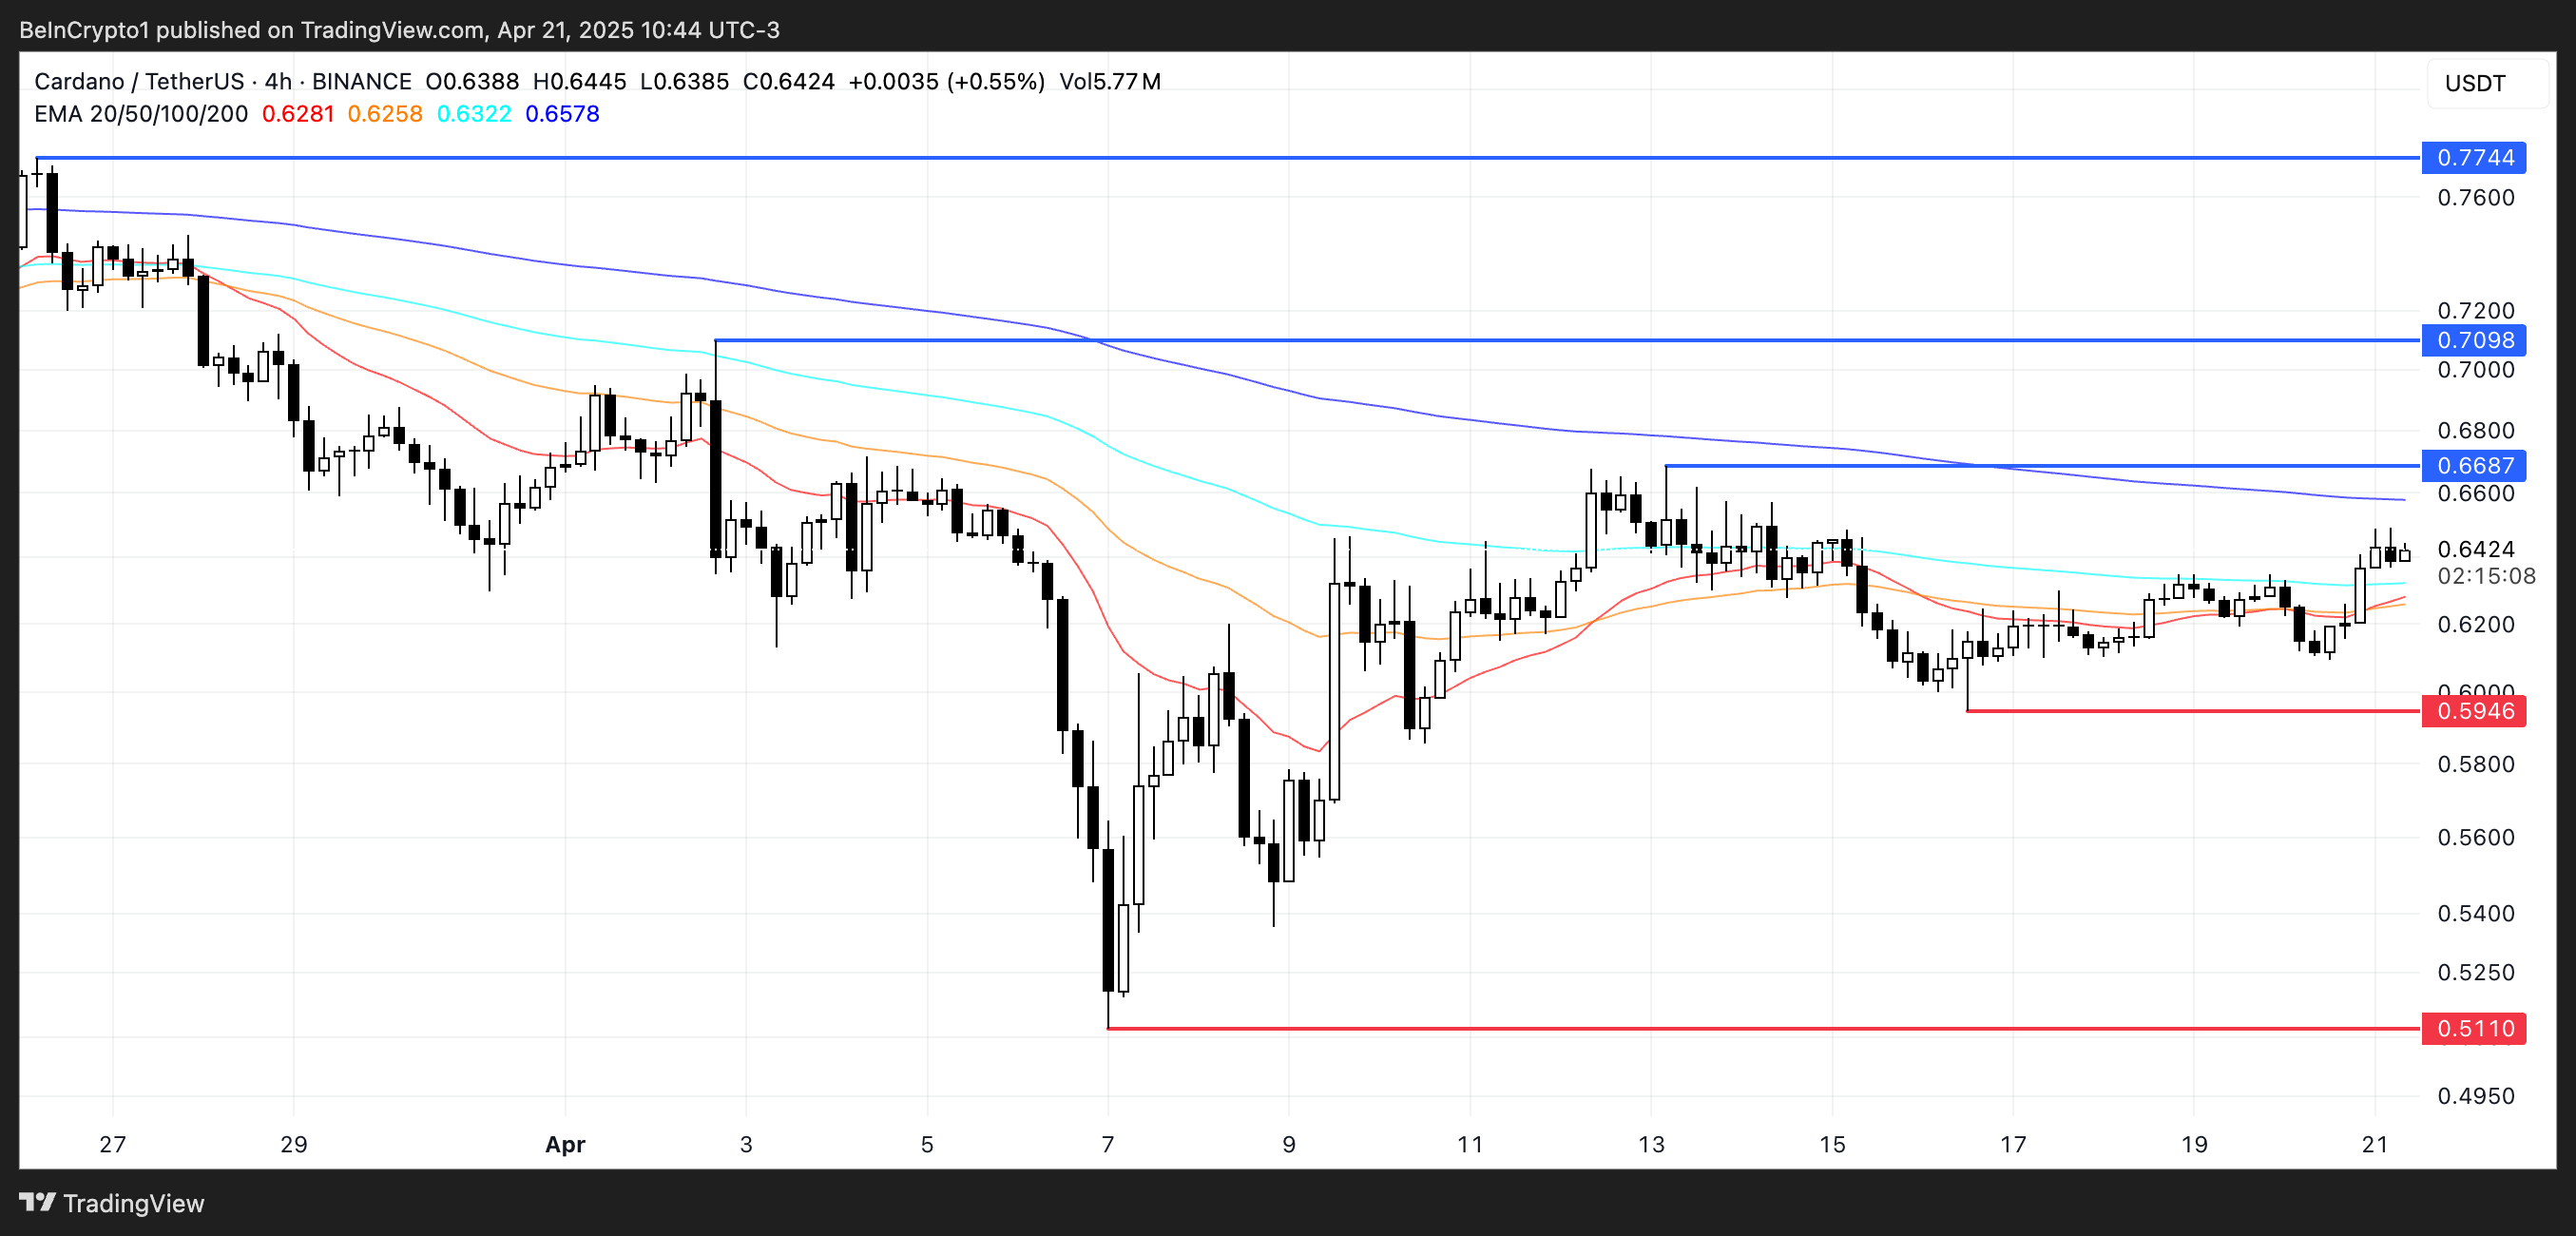
However, if ADA fails to maintain its upward trajectory and the momentum fades, downside risks remain in play.

A drop back toward the $0.594 support would be the first sign of weakness, and a breakdown below that level could expose the asset to deeper losses, with $0.511 as the next key support zone.

Price action around the $0.668 resistance will likely be the deciding factor.

The post Cardano (ADA) Indicators Show a Potential Golden Cross Forming appeared first on BeInCrypto.

How Solana Meme Coin Snipers on Pump.fun Manipulate Markets

According to a new report from Pine Analytics, token deployers on Pump.fun systematically funded sniper wallets to buy their own meme coins. This impacted over 15,000 token launches on the platform.

These sniper wallets operated primarily during US trading hours, executing standardized, profitable strategies. Unrelated bot activity obscures their behavior, making it extremely difficult to isolate these wallets—and they can readily adapt to new countermeasures.

Snipers Roam Free on Pump.fun Meme Coins

Pump.fun has remained one of the most popular meme coin launchpads on Solana despite persistent controversies and other criticism.

However, Pine Analytics’ new report has uncovered a new controversy, discovering systematic market manipulation on the platform. These snipes include as much as 1.75% of all launch activity on Pump.fun.

“Our analysis reveals that this tactic is not rare or fringe — over the past month alone, more than 15,000 SOL in realized profit was extracted through this method, across 15,000+ launches involving 4,600+ sniper wallets and 10,400+ deployers. These wallets demonstrate unusually high success rates (87% of snipes were profitable), clean exits, and structured operational patterns,” it claimed.

Solana meme coin deployers on Pump.fun follow a consistent pattern. They fund one or more sniper wallets and grant them advance notice of upcoming token launches.

Those wallets purchase tokens in the very first block and then liquidate almost immediately—85% within five minutes and 90% in just one or two swap events.

pump.fun snipers
Figure: Pump.Fun Sniper Wallet Profits. Source: X/Pine Analytics

Pump.fun meme coin developers exploit this tactic to create the appearance of immediate demand for their tokens. Retail investors, unaware of the prior sell‑off, often purchase these tokens after the snipe, giving developers an unfair advantage. This constitutes market manipulation and erodes trust in the platform.

Pine Analytics had to carefully calibrate its methods to identify genuine snipers. Apparently, 50% of meme coin launches on Pump.fun involve sniping, but most of this is probably bots using the “spray and pray” method.

However, by filtering out snipers with no direct links to developer wallets, the firm missed projects that covered their tracks through proxies and burners.

In other words, the meme coin community does not have adequate defenses against systematic abuse on Pump.fun. There are a few possible ways that the platform could flag repeat offenders and sketchy projects, but adaptive countermeasures could defeat them. This problem demands persistent and proactive action.

Unfortunately, it may be difficult to enact such policies. Meme coin sniping is so systematic that Pump.fun could only fight it with real commitment.

Analysts think that building an on-chain culture that rewards transparency over extraction is the best long-term solution. A shift like that would be truly seismic, and the meme coin sector might not survive it.

The post How Solana Meme Coin Snipers on Pump.fun Manipulate Markets appeared first on BeInCrypto.

Onyxcoin (XCN) Shows Signs of Reversal After 200% Rally Fizzles Out

Onyxcoin (XCN) is down nearly 10% over the past seven days, cooling off after a sharp 200% rally between April 9 and April 11. Momentum indicators suggest that the bullish trend may be losing strength, with both the RSI and ADX showing signs of fading conviction.

While XCN’s EMA lines remain in a bullish formation, early signs of a potential reversal are emerging as short-term averages begin to slope downward. The coming days will be key in determining whether Onyxcoin can stabilize and resume its climb—or if a deeper correction is on the horizon.

Onyxcoin Shows Early Signs of Stabilization, but Momentum Remains Uncertain

Onyxcoin’s Relative Strength Index (RSI) is currently sitting at 43. Readings above 70 typically indicate that an asset is overbought and could be due for a pullback, while readings below 30 suggest it may be oversold and poised for a potential rebound.

Levels between 30 and 70 are considered neutral, often reflecting consolidation or indecision in the market.

XCN RSI.
XCN RSI. Source: TradingView.

XCN’s RSI signals a neutral state but shows signs of gradual recovery. While not yet a clear bullish signal, yesterday’s upward move suggests that bearish momentum may be easing.

However, the fact that RSI failed to hit above 50 reflects lingering uncertainty and a lack of sustained buying pressure.

For now, XCN appears to be in a wait-and-see phase, where a continued climb in RSI could signal a shift toward renewed upside, but any further weakness might keep the price trapped in a consolidation range.

XCN Uptrend Weakens as ADX Signals Fading Momentum

Onyxcoin’s Average Directional Index (ADX) has declined to 11, down from 13.92 yesterday and 15.26 two days ago. This decline reflects a consistent weakening in trend strength.

The ADX is a key component of the Directional Movement Index (DMI) and is used to measure the strength—not the direction—of a trend on a scale from 0 to 100.

Values below 20 typically suggest that the market is trending weakly or not at all, while readings above 25 confirm a strong and established trend.

XCN ADX.
XCN ADX. Source: TradingView.

With the ADX now at 11, Onyxcoin’s trend is losing momentum, even though it technically remains in an uptrend. This low reading suggests the current bullish phase is fragile and may lack the conviction needed for sustained upward movement.

Combined with EMA lines that are beginning to flatten, the weakening ADX adds weight to the possibility that the trend could soon shift or stall.

If no surge in buying pressure emerges to reinforce the uptrend, XCN may enter a period of sideways movement or even a reversal in the short term.

Onyxcoin at a Crossroads as EMA Lines Hint at Possible Trend Reversal

XCN EMA lines remain bullish for now, with short-term averages still positioned above long-term ones.

However, the short-term EMAs have started to slope downward, raising the possibility of a looming death cross—a bearish crossover in which the short-term average falls below the long-term average.

If this crossover materializes, it would signal a shift in trend direction and could trigger a deeper pullback, after a 200% rally between April 9 and April 11, making it one of the best-performing altcoins of the previous weeks.

XCN Price Analysis.
XCN Price Analysis. Source: TradingView.

Key support levels to watch are $0.016, followed by $0.0139 and $0.0123. If bearish momentum accelerates, XCN could drop as low as $0.0109, marking a potential 38% correction from current levels.

On the flip side, if bulls manage to regain control and reinforce the existing uptrend, XCN could challenge the resistance at $0.020.

A breakout above that level would open the door for a potential rally toward $0.027, representing a 55% upside.

The post Onyxcoin (XCN) Shows Signs of Reversal After 200% Rally Fizzles Out appeared first on BeInCrypto.

3 Altcoins to Watch in the Fourth Week of April 2025

The crypto market has shown consistent growth over the past few days, helping altcoins alongside Bitcoin to recover. However, relying solely on broader market cues or momentum will not sustain price growth.

BeInCrypto has analyzed three altcoins for investors to watch in April, as important developments are set to unfold this week.

Tutorial (TUT)

TUT price has remained stable throughout most of the month, currently hovering below the $0.027 resistance level. Successfully breaching this barrier is crucial for recovering the 53% losses incurred in March. A price rise above $0.027 could signal a positive trend and further upward movement in the coming weeks.

If this trend continues, TUT could push toward the next resistance level of $0.039, indicating strong momentum.

TUT Price Analysis.
TUT Price Analysis. Source: TradingView

However, if TUT fails to break above the $0.027 resistance, the price could decline below $0.021. Such a drop would likely invalidate the bullish outlook and lead to further losses. In that scenario, the altcoin’s price might fall to $0.015, a significant setback for the token’s recovery.

Injective (INJ)

Injective’s price has surged by 17% in recent days, fueled by anticipation surrounding the upcoming Lyota Mainnet Upgrade. Set to go live on April 22, the upgrade is expected to enhance Injective’s infrastructure, performance, and transaction speeds. This has sparked optimism, driving the price higher in the short term.

Currently trading at $8.97, Injective is nearing the $9.11 resistance level. If it successfully breaches this barrier, the price could move beyond $10.00, potentially reaching $10.35. The positive sentiment surrounding the Lyota Mainnet Upgrade is likely to continue driving the token’s growth if it can surpass these levels.

INJ Price Analysis.
INJ Price Analysis. Source: TradingView

However, if Injective fails to break through the $9.11 resistance, as seen earlier in April, the price could fall below $8.40. This would signal a retreat and could see the token dip to $7.64, invalidating the bullish outlook and erasing recent gains.

BNB

BNB’s price currently stands at $604, experiencing a two-month downtrend. The altcoin is struggling to breach the resistance of $611. To push past this barrier, BNB needs strong support from the broader market or upcoming developments that could provide a catalyst for price movement and reversal.

One potential catalyst is the Lorentz opBNB mainnet hard fork, which is scheduled for today. The hard fork aims to enhance the chain’s speed and responsiveness. If successful, this could help BNB break the $611 resistance and push the price toward the next level of $647, spurring bullish sentiment.

BNB Price Analysis.
BNB Price Analysis. Source: TradingView

However, if the hard fork’s impact fails to meet expectations, BNB could struggle to maintain upward momentum. In this case, the price may slip below the support of $576, potentially falling as low as $550. This would invalidate the current bullish outlook and likely continue the downtrend.

The post 3 Altcoins to Watch in the Fourth Week of April 2025 appeared first on BeInCrypto.

PancakeSwap Sets Date for CAKE Tokenomics 3.0 Despite Controversy

PancakeSwap, the largest decentralized exchange (DEX) on BNB Chain, has officially announced the implementation of CAKE Tokenomics 3.0. This marks a major shift toward a more sustainable and deflationary ecosystem.

According to the announcement, PancakeSwap will begin rolling out the new tokenomics model on April 23, 2025. The main goals are to curb CAKE inflation, optimize system efficiency, and deliver long-term value to the community. However, the CAKE 3.0 proposal has sparked considerable debate.

What Are the Key Changes in CAKE Tokenomics 3.0?

PancakeSwap has set three primary goals for Tokenomics 3.0: achieve an annual deflation rate of 4%, eliminate complex mechanisms such as veCAKE, and reduce CAKE emissions to improve sustainability.

Here are the specific changes:

  • Retirement of CAKE Staking, veCAKE, Gauges Voting, Revenue Sharing, and Farm Boosting: PancakeSwap will discontinue CAKE staking and the veCAKE mechanism, which required users to lock tokens in exchange for voting rights or benefits. All locked CAKE and veCAKE will be unlocked.
  • Burn Mechanism to Reduce Circulating Supply: PancakeSwap will burn tokens to reduce supply instead of sharing trading fees with users. The team expects to burn approximately 5.3 million CAKE annually, supporting the deflation target.
  • Phased Reduction in CAKE Emissions: Daily CAKE emissions will be reduced from 29,000 to 20,000, and later to 14,500 tokens.

Users will have six months from April 23, 2025, to withdraw their previously locked CAKE.

The Debate Around CAKE 3.0

Several developers and community members believe CAKE Tokenomics 3.0 will benefit the project in the long term.

“At its core, CAKE Tokenomics 3.0 defends true value and protects CAKE holders by strengthening long-term fundamentals—such as aggressively cutting emissions to accelerate deflation and sustainably grow value,” Chef Philip said.

However, not everyone agrees. Cakepie DAO—one of the largest veCAKE holders—voiced strong concerns on X. They criticized the decision to eliminate veCAKE, calling it non-transparent and potentially damaging to projects built around that model.

This reveals a divide in the community over how PancakeSwap is balancing deflation and stakeholder interests.

“Sunsetting veCAKE would be devastating for Cakepie and for every project built on long-term alignment with PancakeSwap. Our entire ecosystem is structured around veCAKE, with millions of CAKE locked for four years as a clear show of commitment. Removing veCAKE would erase that commitment overnight and undermine the trust and efforts of all builders who believed in PancakeSwap’s vision,” Cakepie stated.

In response, PancakeSwap proposed a $1.5 million compensation package in CAKE tokens. They offered this to CKP (Cakepie’s token) holders if Cakepie agreed to allow a 1:1 swap from mCAKE (Cakepie’s CAKE derivative) to CAKE.

However, Cakepie is currently voting on whether to accept the offer.

PancakeSwap (CAKE) 3-Month Price Chart
PancakeSwap (CAKE) 3-Month Price Chart. Source: BeInCrypto

At the time of reporting, CAKE is trading around $1.97, up 17% since April 8, when PancakeSwap first proposed Tokenomics 3.0.

Additionally, data from DeFiLlama shows that PancakeSwap’s 24-hour trading volume has surpassed $1 billion, overtaking Uniswap.

Meanwhile, a report from BeInCrypto reveals that PancakeSwap controls over 90% of the DEX market share on BNB Chain. This highlights the strong relationship between BNB Chain and PancakeSwap.

The post PancakeSwap Sets Date for CAKE Tokenomics 3.0 Despite Controversy appeared first on BeInCrypto.

MANTRA CEO and Partners to Burn 300 Million Tokens – Will OM Get Back to $1?

MANTRA CEO, JP Mullin, is burning 150 million OM tokens from his own allocation and engaging other ecosystem partners to burn an additional 150 million tokens. This 300 million OM token burn aims to restore investor trust in the project and stabilize the altcoin’s price dynamics.

OM is attempting to recover from one of the most dramatic crashes in recent crypto history. On April 13, it lost over 90% of its value in a single hour. The collapse, which erased more than $5.5 billion in market cap, triggered widespread accusations of insider activity and manipulation within the Real-World Assets (RWA) sector.

Understanding MANTRA’s Token Burn

Mantra, once one of the biggest players in the Real-World Assets (RWA) sector, suffered a dramatic collapse on April 13, with its token crashing over 90% in less than an hour and wiping out more than $5.5 billion in market capitalization.

The plunge followed a rapid surge earlier this year, when OM rose from $0.013 to over $6, pushing its fully diluted valuation to $11 billion. The crash was reportedly triggered by a $40 million token deposit into OKX by a wallet allegedly linked to the team, sparking fears of insider selling.

Panic spread quickly as rumors of undisclosed OTC deals, delayed airdrops, and excessive token supply concentration fueled mass liquidations across exchanges.

Despite co-founder John Patrick Mullin denying any wrongdoing and blaming centralized exchanges for forced closures, investors and analysts raised concerns about potential manipulation by market makers and CEXs, drawing comparisons to past collapses like Terra LUNA.

OM Price Chart and Fall.
OM Price Chart and Fall. Source: TradingView.

In an effort to rebuild trust, Mullin has announced the permanent burn of his 150 million OM team allocation. The tokens, originally staked at mainnet launch in October 2024, are now being unbonded and will be fully burned by April 29, reducing OM’s total supply from 1.82 billion to 1.67 billion.

This move also lowers the network’s staked amount by 150 million tokens, which could impact on-chain staking APR.

Additionally, MANTRA is in talks with partners to implement a second 150 million OM burn, potentially cutting the total supply by 300 million tokens.

OM Price Faces Critical Test as Token Burn Battles Lingering Market Doubt

Despite MANTRA’s ongoing token burn efforts, it’s still uncertain whether the move will be enough to fully restore investor confidence in OM.

From a technical standpoint, if momentum begins to recover, OM could test the immediate resistance at $0.59. A successful breakout at that level may pave the way for further gains toward $0.71, with additional key hurdles at $0.89 and $0.997 standing between the token and a return to the psychologically important $1 mark.

However, reclaiming these levels will likely require sustained buying interest and broader sentiment recovery across the Real-World Assets (RWA) sector.

OM Price Analysis.
OM Price Analysis. Source: TradingView.

On the downside, if the token burn fails to shift sentiment or if selling pressure continues, OM risks resuming its decline.

The first key support lies at $0.51, and a breakdown below that level could send the price further down to $0.469.

Given the scale of the recent crash and the lingering distrust among investors, the path to recovery remains fragile—OM now sits at a critical crossroads between a potential rebound and further erosion of its market value.

The post MANTRA CEO and Partners to Burn 300 Million Tokens – Will OM Get Back to $1? appeared first on BeInCrypto.

Public Companies Are Buying Bitcoin Again as BTC Nears $90,000

Bitcoin is rebounding after tariff chaos, and public companies like Metaplanet are conducting major acquisitions. The firm bought $28.2 million worth of the asset, nearly a $2 million increase from last week.

However, despite this new confidence, Metaplanet’s stock has continued to perform shakily. The crypto market is showing cautious optimism, but that won’t immediately translate into major gains.

Bitcoin Rebounds as Metaplanet Increases Purchase Size

Although a few corporate Bitcoin whales briefly paused their big purchases recently, the markets are heating back up again. Metaplanet began buying the dip last week, and Bitcoin has been making steady progress since then.
Today, its CEO, Simon Gerovich, announced a new purchase as BTC rebounds:

“Metaplanet has acquired 330 BTC for ~$28.2 million at ~$85,605 per bitcoin and has achieved BTC Yield of 119.3% YTD 2025. As of 4/21/2025, we hold 4855 $BTC acquired for ~$414.5 million at ~$85,386 per bitcoin,” he claimed.

Trump’s tariff threats caused massive uncertainty and crypto liquidations in the last few weeks. However, since he announced a pause, crypto and industry-related stocks have been rallying.

Whales like Metaplanet and MicroStrategy immediately began buying Bitcoin, and the whole market is rising. The Crypto Fear and Greed Index was recently in Extreme Fear but has since recovered greatly:

Crypto Fear and Greed Index
Crypto Fear and Greed Index. Source: Alternative

Still, markets are showing cautious optimism, not a full rally. A quick look at some major crypto-related stocks will paint a clearer picture.

MicroStrategy rose over 4% in the last five days and nearly 6% in the last month, but it’s a pillar of confidence in BTC. Metaplanet, a much smaller Bitcoin holder, only fell 1.89% in the last five days but over 20% in the last 30.

In other words, it can be difficult to cleanly connect Bitcoin’s recent successes with major holders like Metaplanet. Compare two prominent US-based crypto miners, Marathon and Riot.

The former recovered from its slump in early April, while the latter only continued to drop. Coinbase, too, has only made brief rallies on a trend of continual decline.

While Bitcoin’s adoption has surged dramatically over the past year, there’s still a lot of uncertainty about tariffs and recession. Metaplanet may be in shaky territory right now, but its confidence in Bitcoin can provide a long-term sense of stability.

The post Public Companies Are Buying Bitcoin Again as BTC Nears $90,000 appeared first on BeInCrypto.

72 Crypto ETFs are Up for Approval, But Bitcoin Holds 90% Of Fund Investments

As the SEC is signaling its willingness to approve new altcoin ETFs, 72 active proposals are awaiting a nod. Despite the growing interest from asset managers to launch more altcoin-based products in the institutional market, Bitcoin ETFs currently command 90% of crypto fund assets worldwide.

New listings can attract inflows and liquidity in these tokens, as demonstrated by Ethereum’s approval of ETF options. Still, given the current market interest, it’s highly unlikely that any crypto found will replicate Bitcoin’s runaway success in the ETF market

Bitcoin Dominates the ETF Market

Bitcoin ETFs dramatically changed the global digital assets market over the past month, and they are performing quite well at the moment. In the US, total net assets have reached $94.5 billion, despite continuous outflows in the past few months.

Their impressive early success opened a new market for crypto-related assets, and issuers have been flooding the SEC with new applications since.

This flood has been so intense that there are currently 72 active proposals for the SEC’s consideration:

“There are now 72 crypto-related ETFs sitting with the SEC awaiting approval to list or list options. Everything from XRP, Litecoin and Solana to Penguins, Doge and 2x MELANIA and everything in between. Gonna be a wild year,” claimed ETF analyst Eric Balchunas.

The US regulatory environment has become much friendlier toward crypto, and the SEC is signaling its willingness to approve new products. Many ETF issuers are attempting to seize the opportunity to create a product as successful as Bitcoin.

However, Bitcoin has a sizable head start, and it’s difficult to imagine any newcomer disrupting its 90% market share.

Bitcoin Represents 90% of Global Crypto ETF Investment
Bitcoin Represents 90% of Global Crypto ETF Investment. Source: Eric Balchunas

To put that into perspective, BlackRock’s Bitcoin ETF was declared “the greatest launch in ETF history.” Any new altcoin product would need a significant value-add to encroach upon Bitcoin’s position.

Recent products like Ethereum ETF options have attracted fresh liquidity. Yet, Bitcoin’s dominance in the institutional market remains unchanged.

Of these 72 proposals, only 23 refer to altcoins other than Solana, XRP, or Litecoin, and many more concern new derivatives on existing ETFs.

Some analysts claim that these products, taken together, couldn’t displace more than 5-10% of Bitcoin’s ETF market dominance. If an event significantly disrupted Bitcoin, it would also impact the rest of crypto.

Still, that doesn’t mean that the altcoins ETFs are a futile endeavor. These products have continually created new inflows and interest in their underlying assets, especially with issuers acquiring token stockpiles.

However, it’s important to be realistic. While XRP and Solana ETF approvals could drive new bullish cycles for the altcoin market, Bitcoin will likely dominate the ETF market by a large margin — given its widespread recognition as a ‘store of value’.

The post 72 Crypto ETFs are Up for Approval, But Bitcoin Holds 90% Of Fund Investments appeared first on BeInCrypto.

LaunchLab vs. Pump.fun: Solana’s Meme Coin Factory Sparks Fresh Rivalry in Token Creation

Raydium launched its LaunchLab on April 17, 2025. Within five days, Raydium LaunchLab generated 3,787 tokens, achieving a “graduated rate” of 1.14%.

This article analyzes Raydium LaunchLab’s performance, compares it with competitors, and provides a comprehensive overview of the ongoing meme coin launchpad war.

Impressive Start but yet to Outshine Pump.fun

Raydium, a prominent project within the Solana ecosystem, introduced its LaunchLab meme coin launchpad, which aims to directly challenge Pump.fun.

According to Dune data, Raydium LaunchLab created 3,787 tokens in its first week, achieving a “graduation rate” of 1.14%. This rate is based on the number of tokens reaching a threshold of 85 SOL (approximately $11,150) to transition to trading on Raydium’s Automated Market Maker (AMM).

Performance of Raydium LaunchLabs. Source: Dune

While these figures reflect a promising debut, Raydium LaunchLab still trails behind Pump.fun. The pioneering Solana-based platform, Pump.fun, boasts an average daily graduation rate of 1.13%—slightly lower than LaunchLab’s.

Performance of Pump.fun. Source: Dune

Moreover, Pump.fun has had a longer runway to build its community and refine its processes, and created over 600,000 tokens in January 2025. This shows Pump.fun’s continued dominance, even as Raydium LaunchLab exerts significant competitive pressure.

Meme Coin Launchpad War

Beyond Raydium LaunchLab and Pump.fun, the meme coin launchpad war includes other platforms like SunPump (Tron), Dgen.fun (Aptos), or Auto.fun. However, their performance remains modest.

Performance of SunPump. Source: Dune

Per Dune Analytics, SunPump has created only eight tokens today, while Dgen.fun has generated 21. These numbers indicate that neither platform can yet compete with Raydium LaunchLab or Pump.fun’s scale.

Performance of Dgen.fun. Source: Dune

Despite backing from Justin Sun and the Tron ecosystem, SunPump struggles to attract users. This may partly stem from Tron’s weaker appeal to the meme coin community than Solana. Similarly, Dgen.fun has yet to make a significant impact, likely due to Aptos being a relatively new blockchain with a smaller community to drive meme coin development.

Key Factors Behind LaunchLab’s Appeal

Raydium LaunchLab boasts several competitive advantages. First, the platform allows free token creation, offering features like customizable bonding curves and no migration fees. Once a token reaches the 85 SOL threshold, it automatically transitions to Raydium’s AMM, ensuring immediate liquidity.

Additionally, Raydium imposes a 1% transaction fee, of which 25% is allocated to buy back RAY tokens—a move designed to boost the value of its native token.

Following the LaunchLab announcement, RAY’s price surged nearly 15%, reaching $2.41 before settling at $2.21. This reflects strong community optimism about LaunchLab’s potential. However, to surpass Pump.fun, Raydium must improve its graduation rate and attract more users, particularly as Pump.fun has built credibility with its simple, transparent mechanism.

The meme coin launchpad war is not solely about the number of tokens created—it’s a battle of technology, community, and sustainability. Pump.fun remains the leader, thanks to its first-mover advantage and massive scale. However, Raydium LaunchLab is emerging as a formidable contender, backed by the Solana ecosystem, renowned for its fast transaction speeds and low costs.

As the competition intensifies, Raydium LaunchLab’s ability to innovate and grow its user base will be critical in challenging Pump.fun’s dominance in the meme coin launchpad arena.

The post LaunchLab vs. Pump.fun: Solana’s Meme Coin Factory Sparks Fresh Rivalry in Token Creation appeared first on BeInCrypto.

XRP Bulls Take the Wheel: Rising Long Bets Hint at Imminent Breakout Above $2.18

Over the past week, XRP’s price has remained range-bound amid the broader market’s recovery attempt. 

However, with a growing bullish bias toward the altcoin, XRP may be on the brink of breaking free from this range and trending upward. This analysis explains why.

XRP Futures Traders Bet on Upside as Long Positions 

The momentum shift towards the bulls has become evident, particularly within the futures market, where long bets on XRP are now surpassing short positions. This is reflected by the token’s XRP’s long/short ratio, which is currently at 1.07.

XRP Long/Short Ratio
XRP Long/Short Ratio. Source: Coinglass

The long/short ratio measures the proportion of long positions (bets on price increases) to short positions (bets on price declines) in the market. 

When its value is below one, it indicates that the number of short positions outweighs long positions in the market, suggesting bearish sentiment or a lack of confidence in the token’s future price performance. 

As with XRP, when an asset’s long/short ratio is above one, it means there are more long positions than short ones. It indicates that traders are predominantly bullish on XRP and hints at a higher likelihood of an upward breach of its narrow range. 

In addition, XRP’s relative strength index (RSI) has climbed steadily, indicating a gradual rise in demand for the token. The key momentum indicator, at 50.77, currently rests above the neutral line and is in an uptrend. 

XRP RSI
XRP RSI. Source: TradingView

The RSI indicator measures an asset’s overbought and oversold market conditions. It ranges between 0 and 100. Values above 70 suggest that the asset is overbought and due for a price decline, while values under 30 indicate that the asset is oversold and may witness a rebound.

At 50.77, XRP’s RSI signals a shift toward bullish momentum. It indicates that buying pressure is starting to outweigh selling pressure, and the asset may be poised for further price increases.

XRP Eyes $2.18 Resistance as Bulls Look to Push for $2.29

XRP currently trades at $2.13, just 3% away from its next significant resistance level, $2.18. If buying pressure intensifies and the altcoin successfully flips this price point into a support floor, it could trigger further price growth. In this scenario, XRP could potentially climb to $2.29. 

XRP Price Analysis
XRP Price Analysis. Source: TradingView

However, if demand weakens and the bears regain control, XRP may remain range-bound. It could even break below the $2.03 support and fall to $1.99.

The post XRP Bulls Take the Wheel: Rising Long Bets Hint at Imminent Breakout Above $2.18 appeared first on BeInCrypto.