STX is today’s top performer, soaring nearly 20% in the past 24 hours. Alongside the price surge, the token’s trading volume has also spiked, signaling strong interest from investors.
However, despite the rally, on-chain data reveals a high demand for short positions among traders, suggesting doubts around the longevity of STX’s current uptrend.
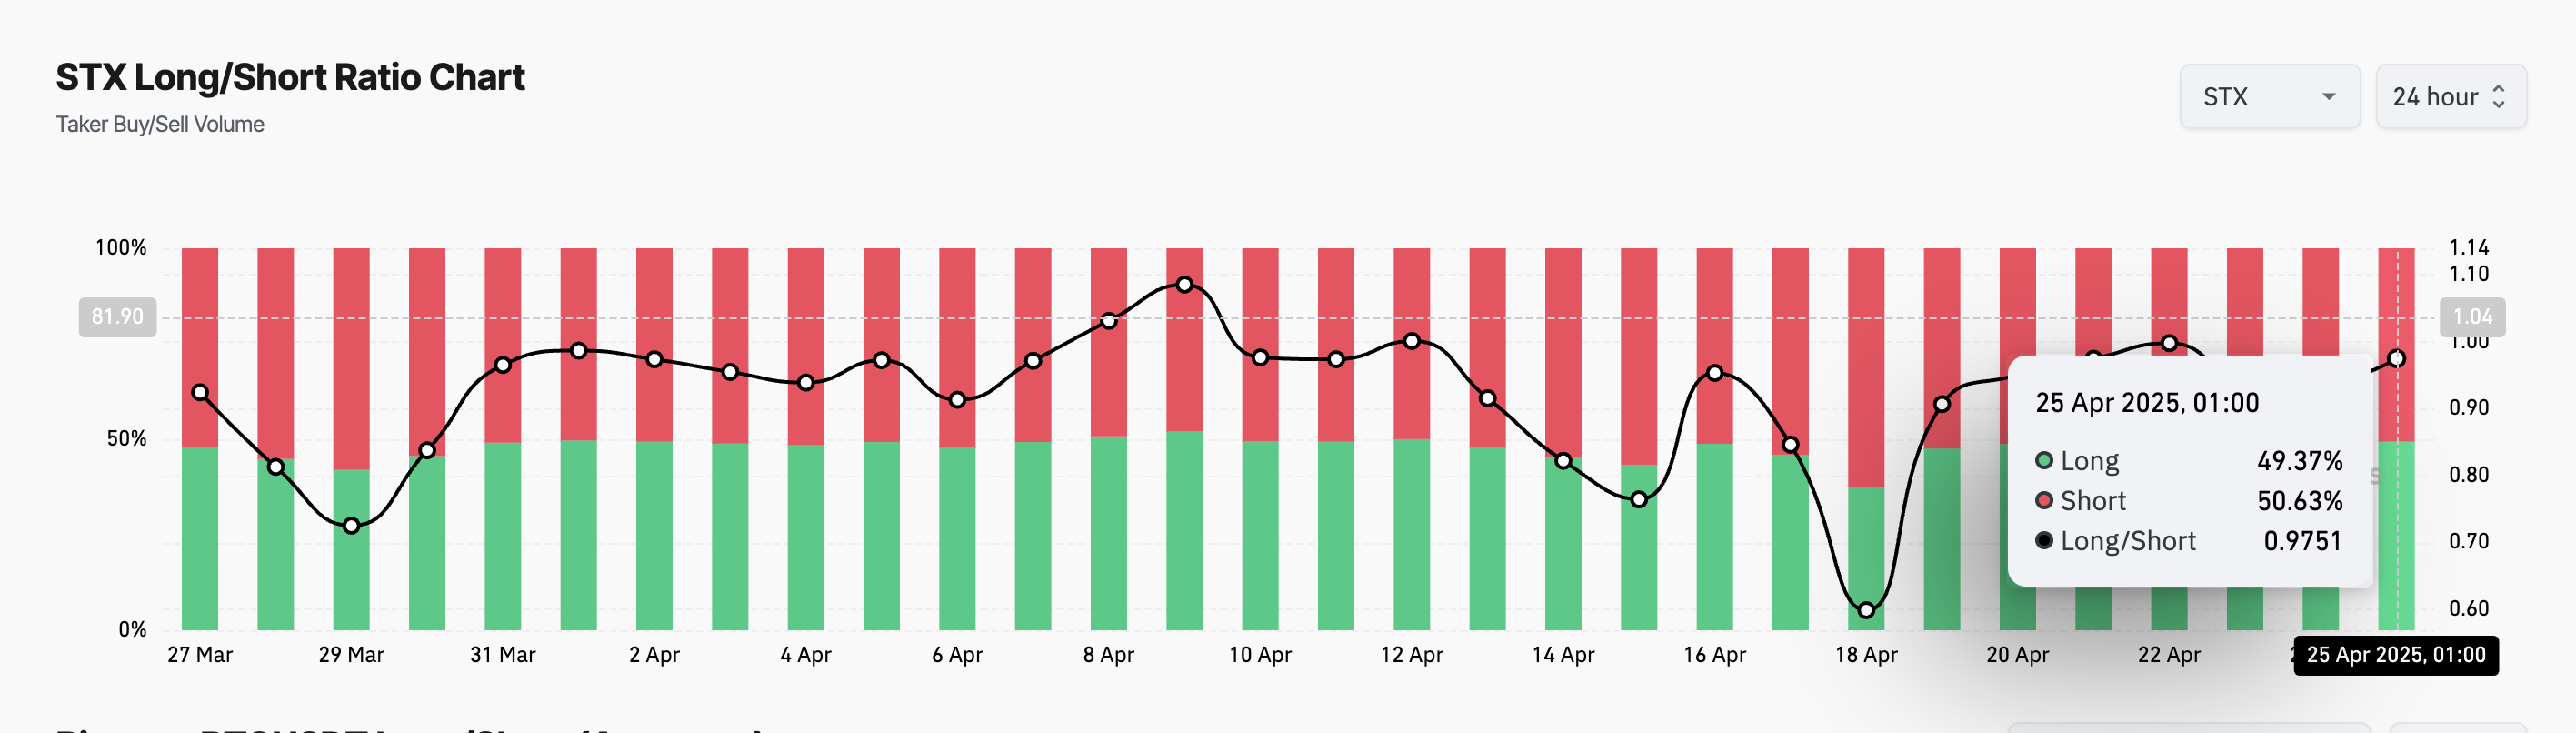
Stacks (STX) Jumps 20%, But Bearish Traders Dominate
According to Coinglass, STX’s long/short ratio is currently at 0.97, signaling a preference for short positions among its futures market participants.
The long/short ratio measures the proportion of bullish (long) positions to bearish (short) positions in the market. When the ratio is above one, there are more long positions than short ones. This suggests bullish sentiment, with most traders expecting the asset’s value to rise.
Converesly, as with STX, a ratio below one indicates that more traders are betting on a price decline than on an increase. This suggests that many token holders are unimpressed by STX’s double-digit gains over the past day and anticipate a bearish reversal soon.
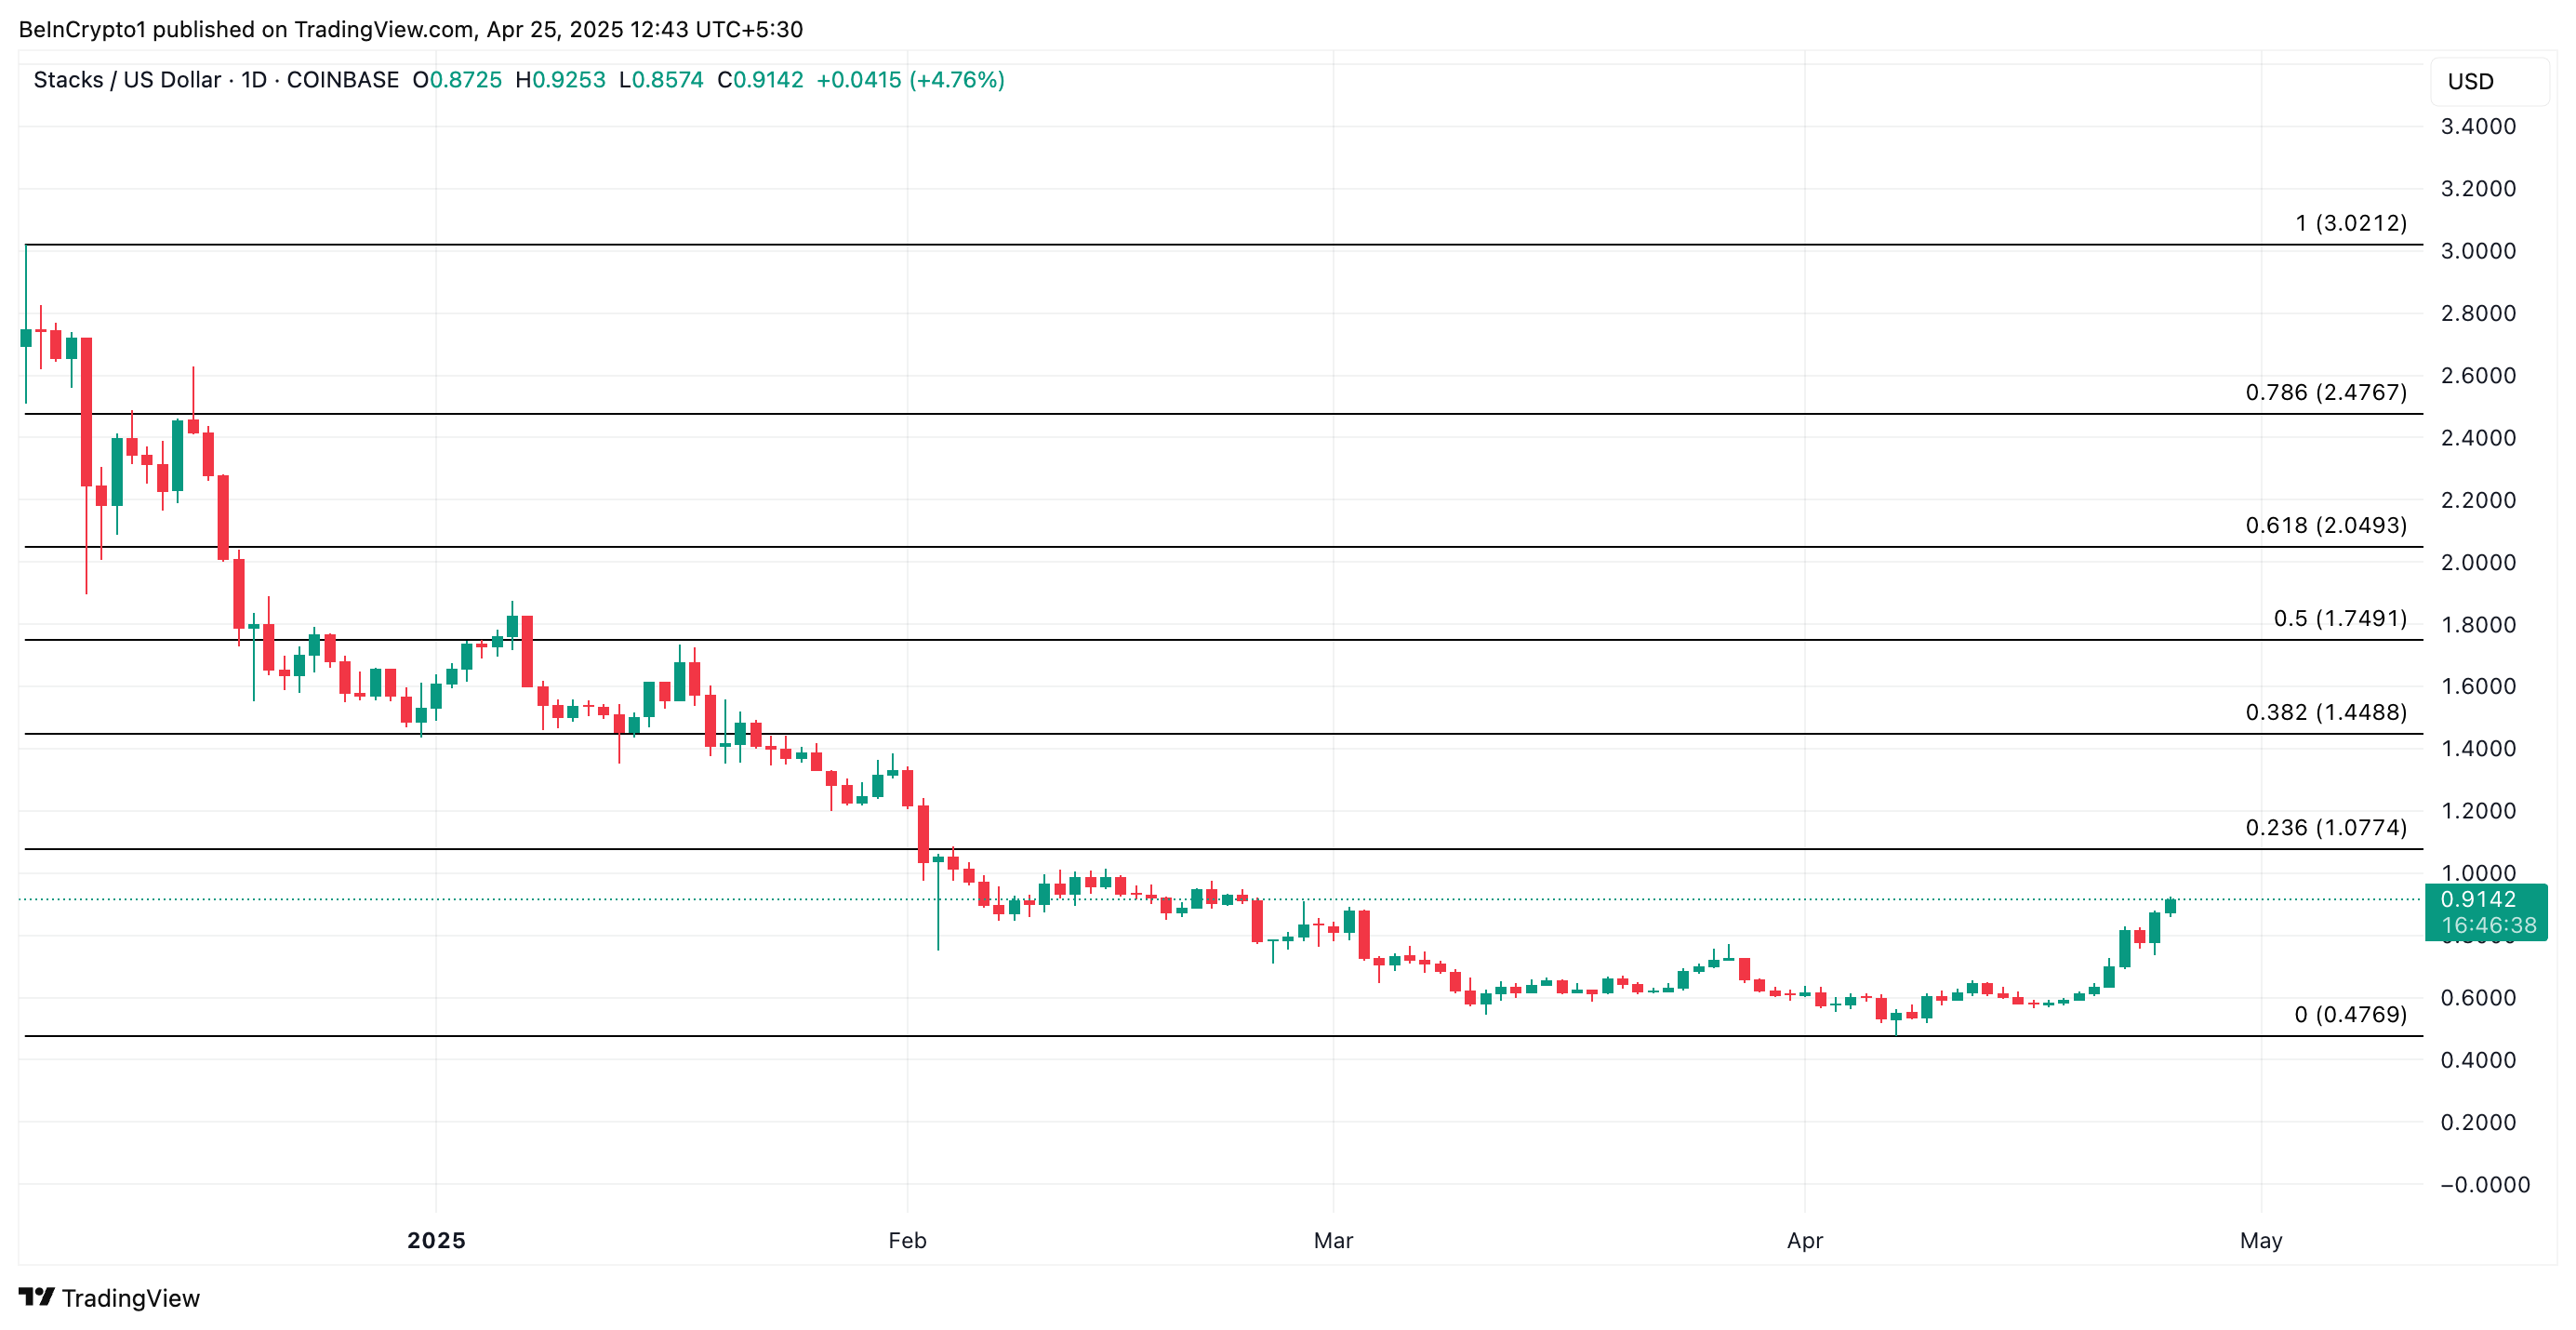
Moreover, STX’s overbought Relative Strength Index (RSI) supports this bearish outlook. At press time, this momentum indicator is at 74.35 and on an upward trend.
The RSI indicator measures an asset’s overbought and oversold market conditions. It ranges between 0 and 100, with values above 70 suggesting that the asset is overbought and due for a price decline. Converesly, values under 30 indicate that the asset is oversold and may witness a rebound.
Therefore, STX’s RSI reading confirms that altcoin might be overbought and could witness a price decline in the near term.
Can STX Defy Overbought Signals?
Once buyer exhaustion sets in, STX could shed some of its recent gains. In this scenario, the altcoin’s value could plunge to its year-to-date low of $0.47.
However, an RSI reading above 70 does not always signal an immediate reversal. Strong bullish momentum can sometimes sustain the rally, pushing prices even higher despite overbought conditions.
XRP has recently been facing a downtrend, with the altcoin dipping below key support levels. However, it seemingly established a bullish pattern that appeared poised for a breakout.
Yet, the overvaluation of XRP has made this breakout unlikely. As the altcoin’s price surges, concerns about its sustainability are mounting.
XRP is Highly Overvalued
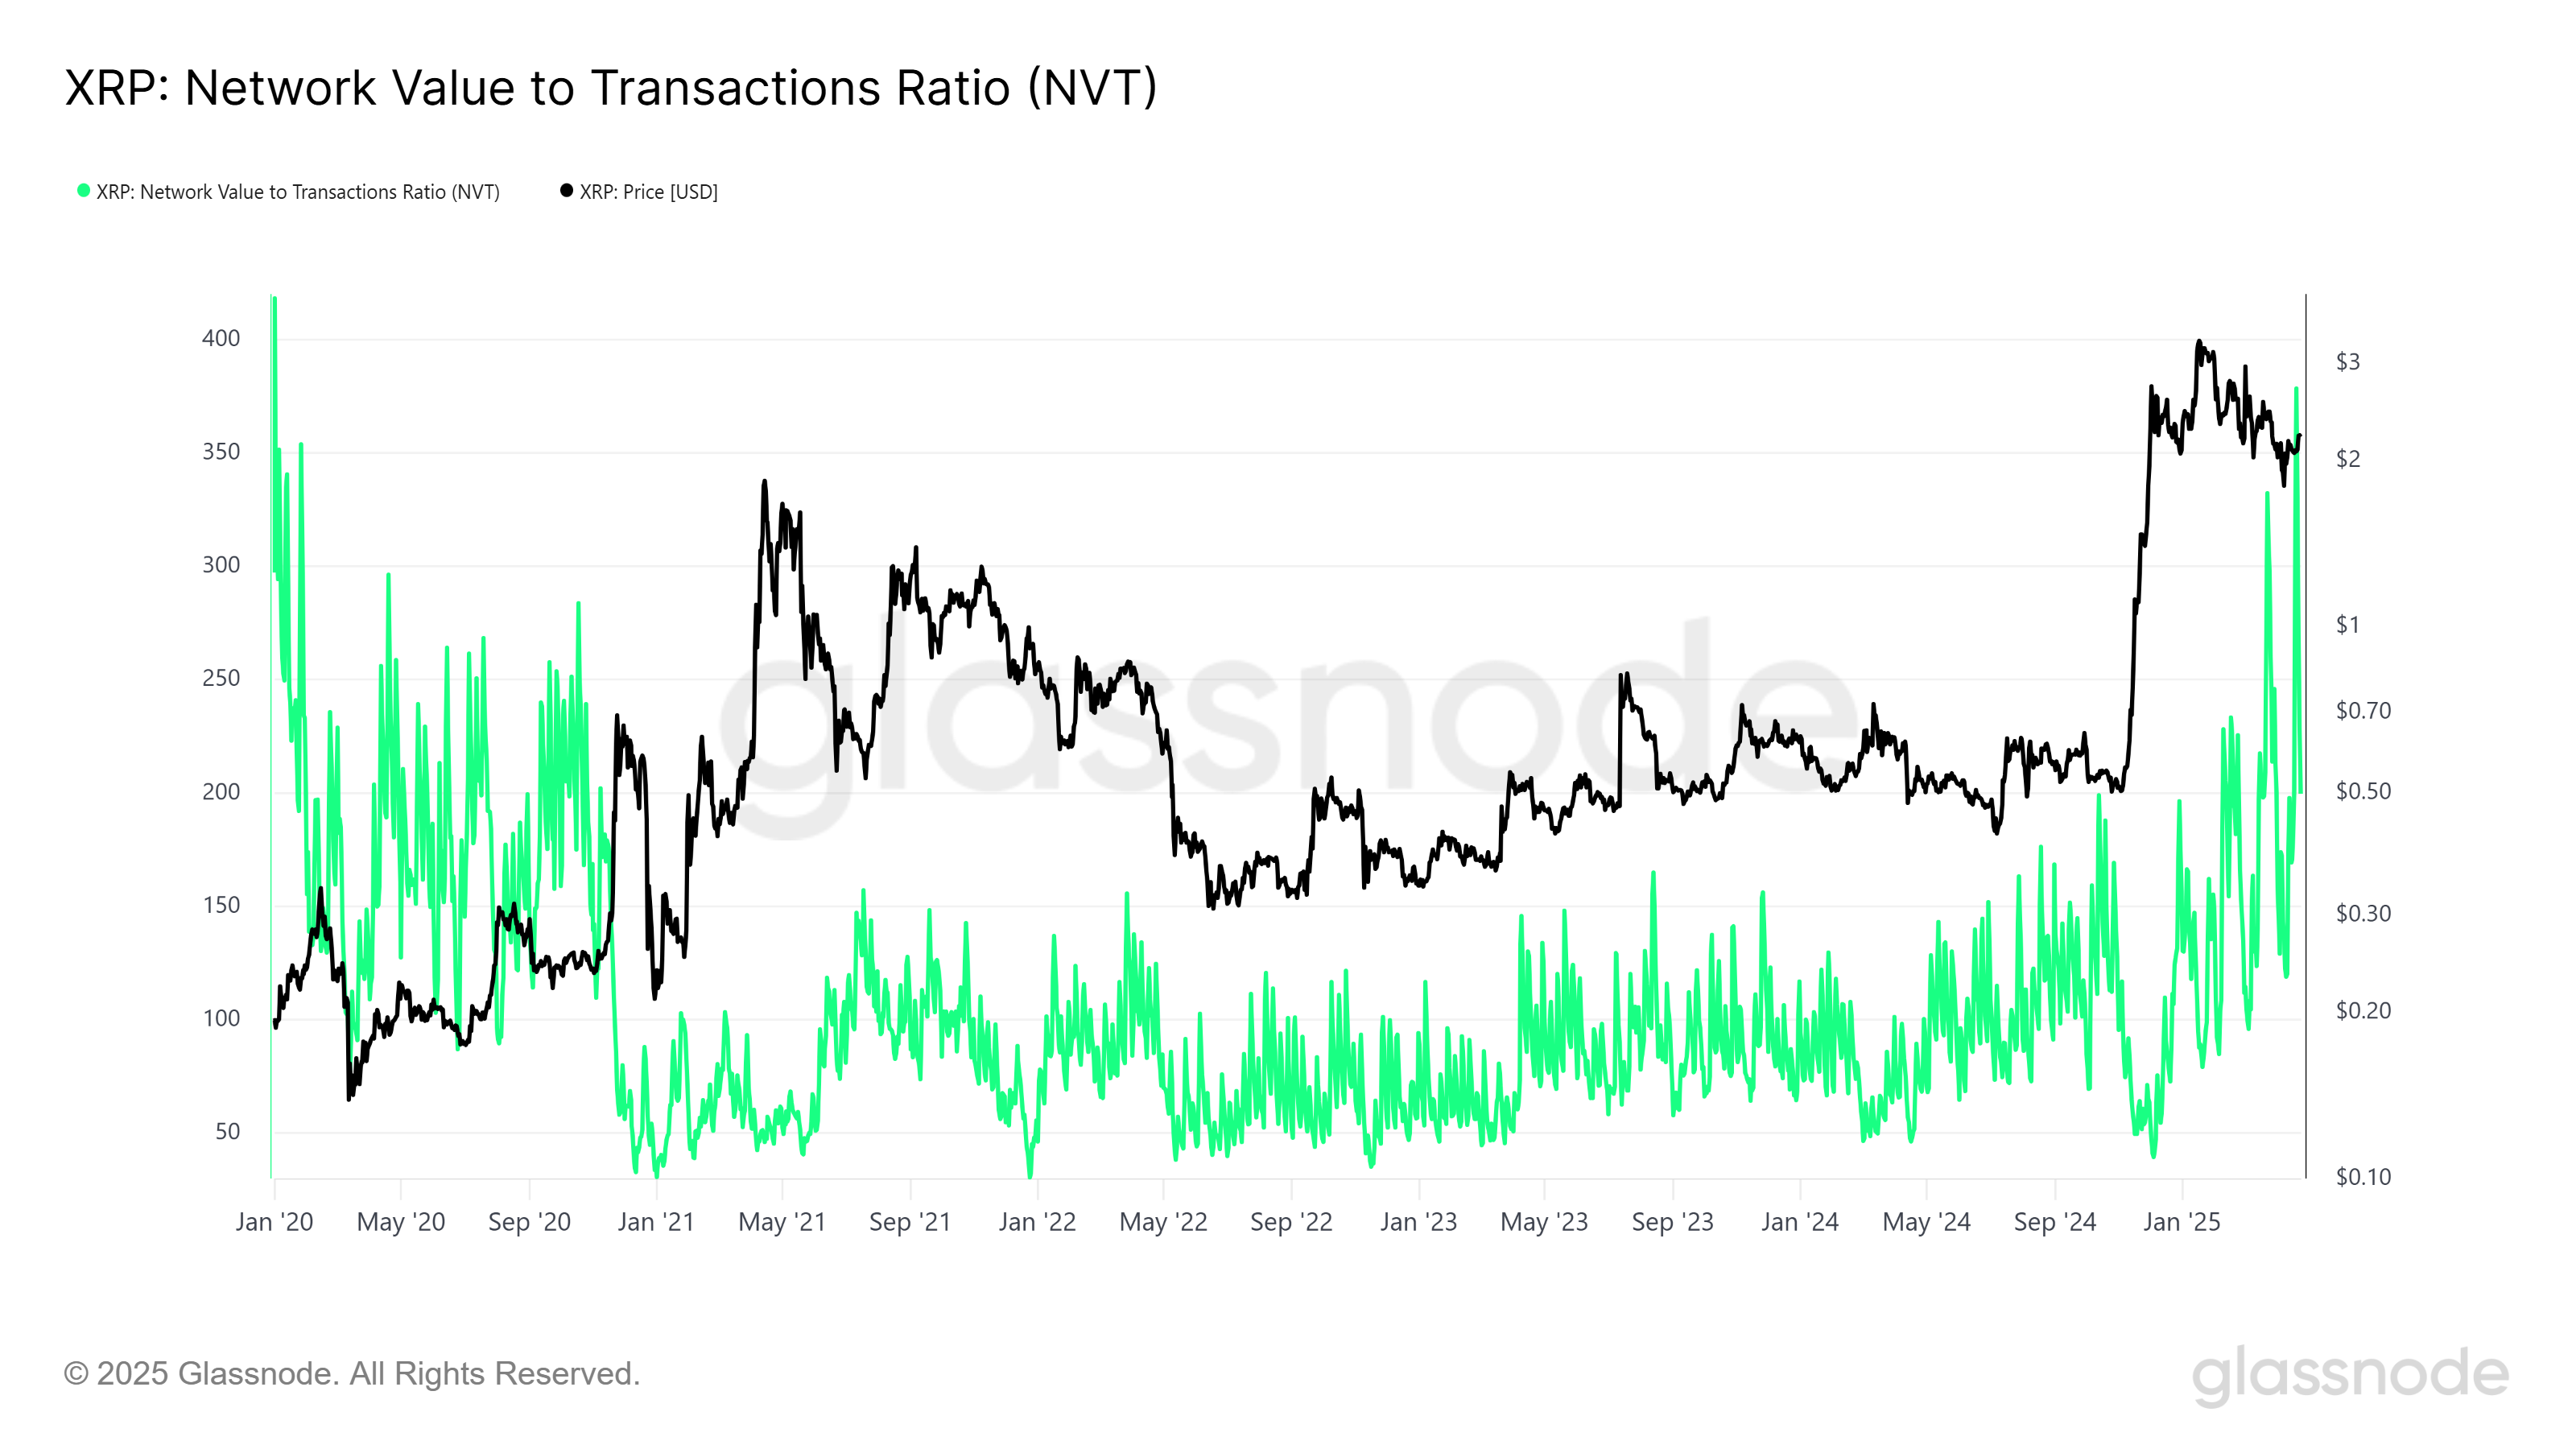
This week, XRP’s network value-to-transaction (NVT) ratio spiked to a five-year high, signaling an overvaluation. The NVT ratio is a critical indicator that compares a cryptocurrency’s market capitalization to its transaction volume. When the NVT ratio increases sharply, it suggests that the network value is outpacing actual transaction activity.
This condition has historically been associated with an upcoming correction in price. The last time the NVT ratio reached similar levels was in January 2020, just before XRP experienced a significant price downturn. The surge in NVT suggests that the market is becoming overheated, with expectations of a cooldown.
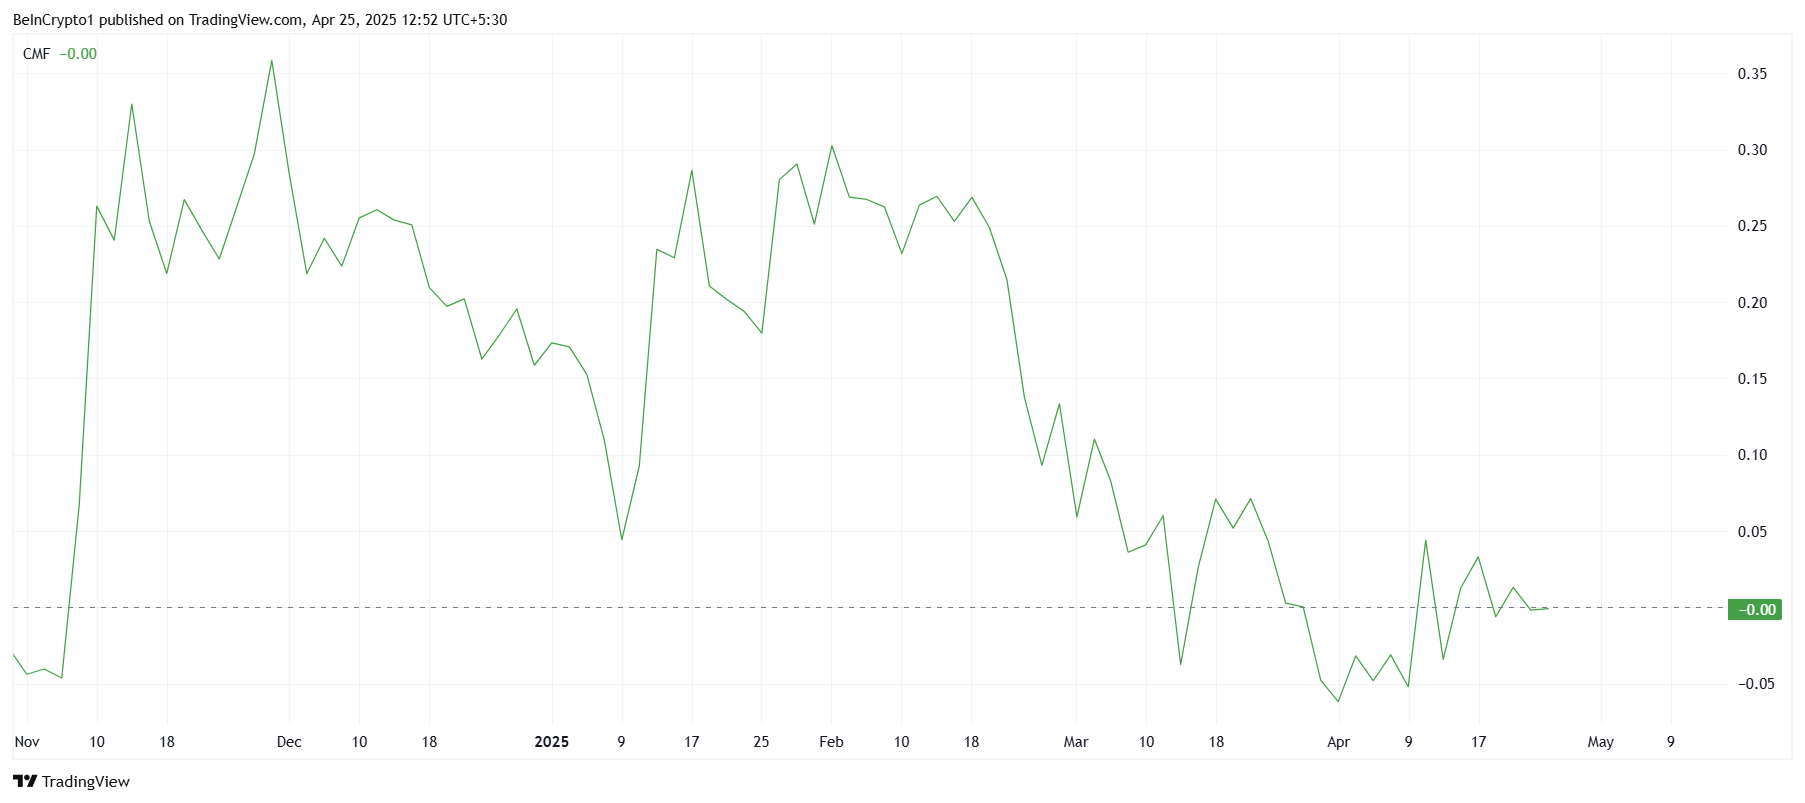
Despite XRP rallying 22% in the past two weeks, technical indicators paint a more concerning picture. The Chaikin Money Flow (CMF) indicator has displayed a significant spike, often suggesting that money flows into the market. However, a closer look at the volume of inflows reveals that substantial buying activity has not supported the price increase.
Instead, hype and speculation drive the price surge more than genuine investor interest.
With this in mind, XRP’s rally may be more of a short-term anomaly rather than a sustainable upward trend. As the market cools down and the hype subsides, the altcoin will likely struggle to maintain its recent price levels. The overvaluation condition remains a significant risk, potentially leading to a price correction.
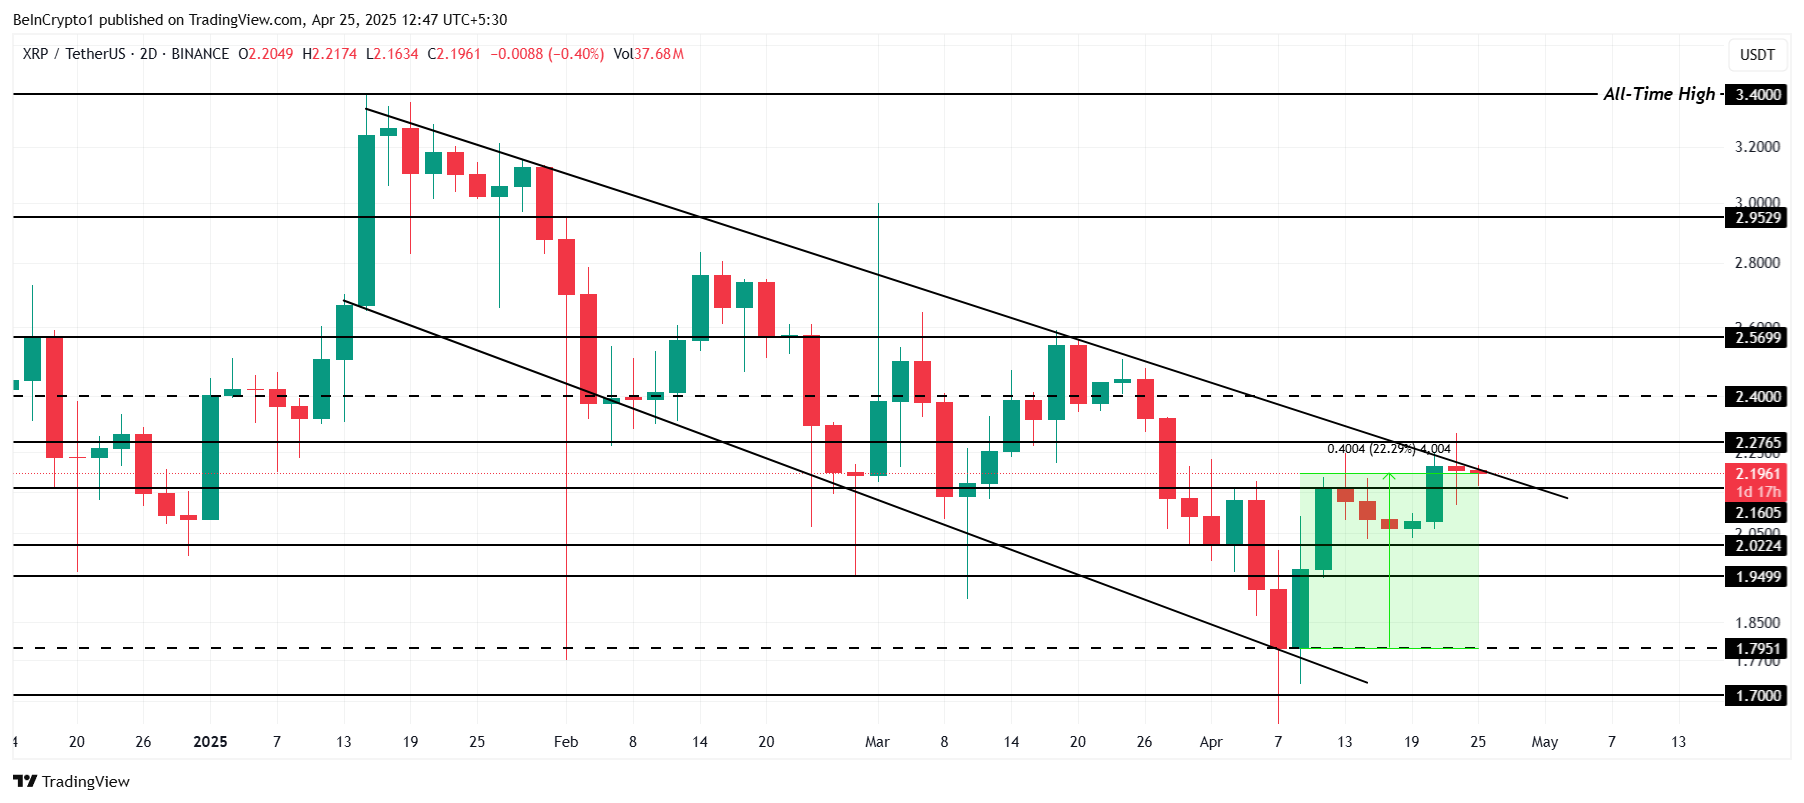
XRP is currently trading at $2.19, showing a 22% increase in the last two weeks. The altcoin appears to be preparing for a breakout from a three-month-old descending channel. However, this breakout faces challenges, as the overvaluation condition and broader market indicators suggest that the rally may not last.
Given the potential bearish factors, even if XRP manages to break out, the rally could be short-lived. The price could retreat to $2.02, or possibly lower to $1.94, if the breakout fails to hold. The combination of overvaluation and weak buying momentum could quickly reverse any gains.
On the other hand, if XRP does manage to sustain its breakout, securing $2.40 and $2.56 as support levels could provide the necessary foundation for further price growth. Such a move would invalidate the bearish outlook, allowing XRP to push higher and continue its ascent.
The cryptocurrency market is experiencing a significant shift in investor sentiment this month. Bitcoin’s price recovery has sparked a ripple effect in demand, from large investors to smaller ones.
Bitcoin has rebounded by 25% from its early April lows. On-chain data and updated forecasts from industry experts offer insights into the sustainability of this rally.
Market Sentiment Shifts from Fear to Greed
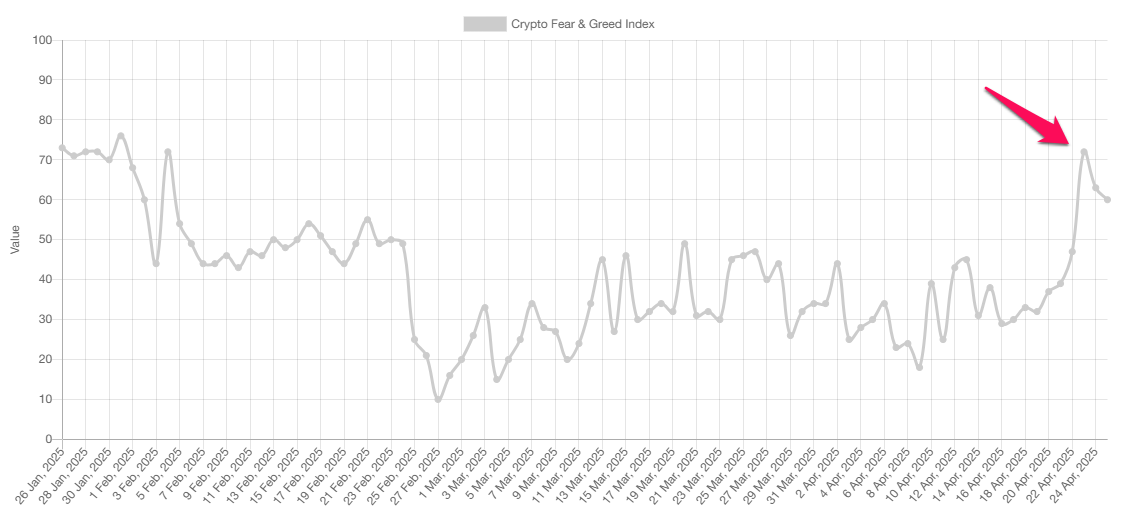
According to data from Alternative.me, the Fear and Greed Index surged from a low of 18 to a high of 72 in April. This is the highest level since February and marks a clear shift from fear to greed.
Meanwhile, CoinMarketCap’s version of the index shows a slightly different picture. It rose from 15 to 52 points, moving from extreme fear to a neutral state. Although the two indices differ, both confirm a notable shift in investor sentiment. Investors have moved past the fear that often triggers panic selling.
This neutral or greedy mindset lays the groundwork for further optimism. If it continues, the market may reach a state of extreme greed before any major correction occurs. This sentiment shift has led to five divergence signals that support the potential continuation of the recovery for both Bitcoin and altcoins.
Bitcoin Accumulation Spreads from Large to Smaller Wallets, Indicating a Positive Outlook
On-chain data shows that whale accumulation has helped Bitcoin hold above $93,000 in the final week of April.
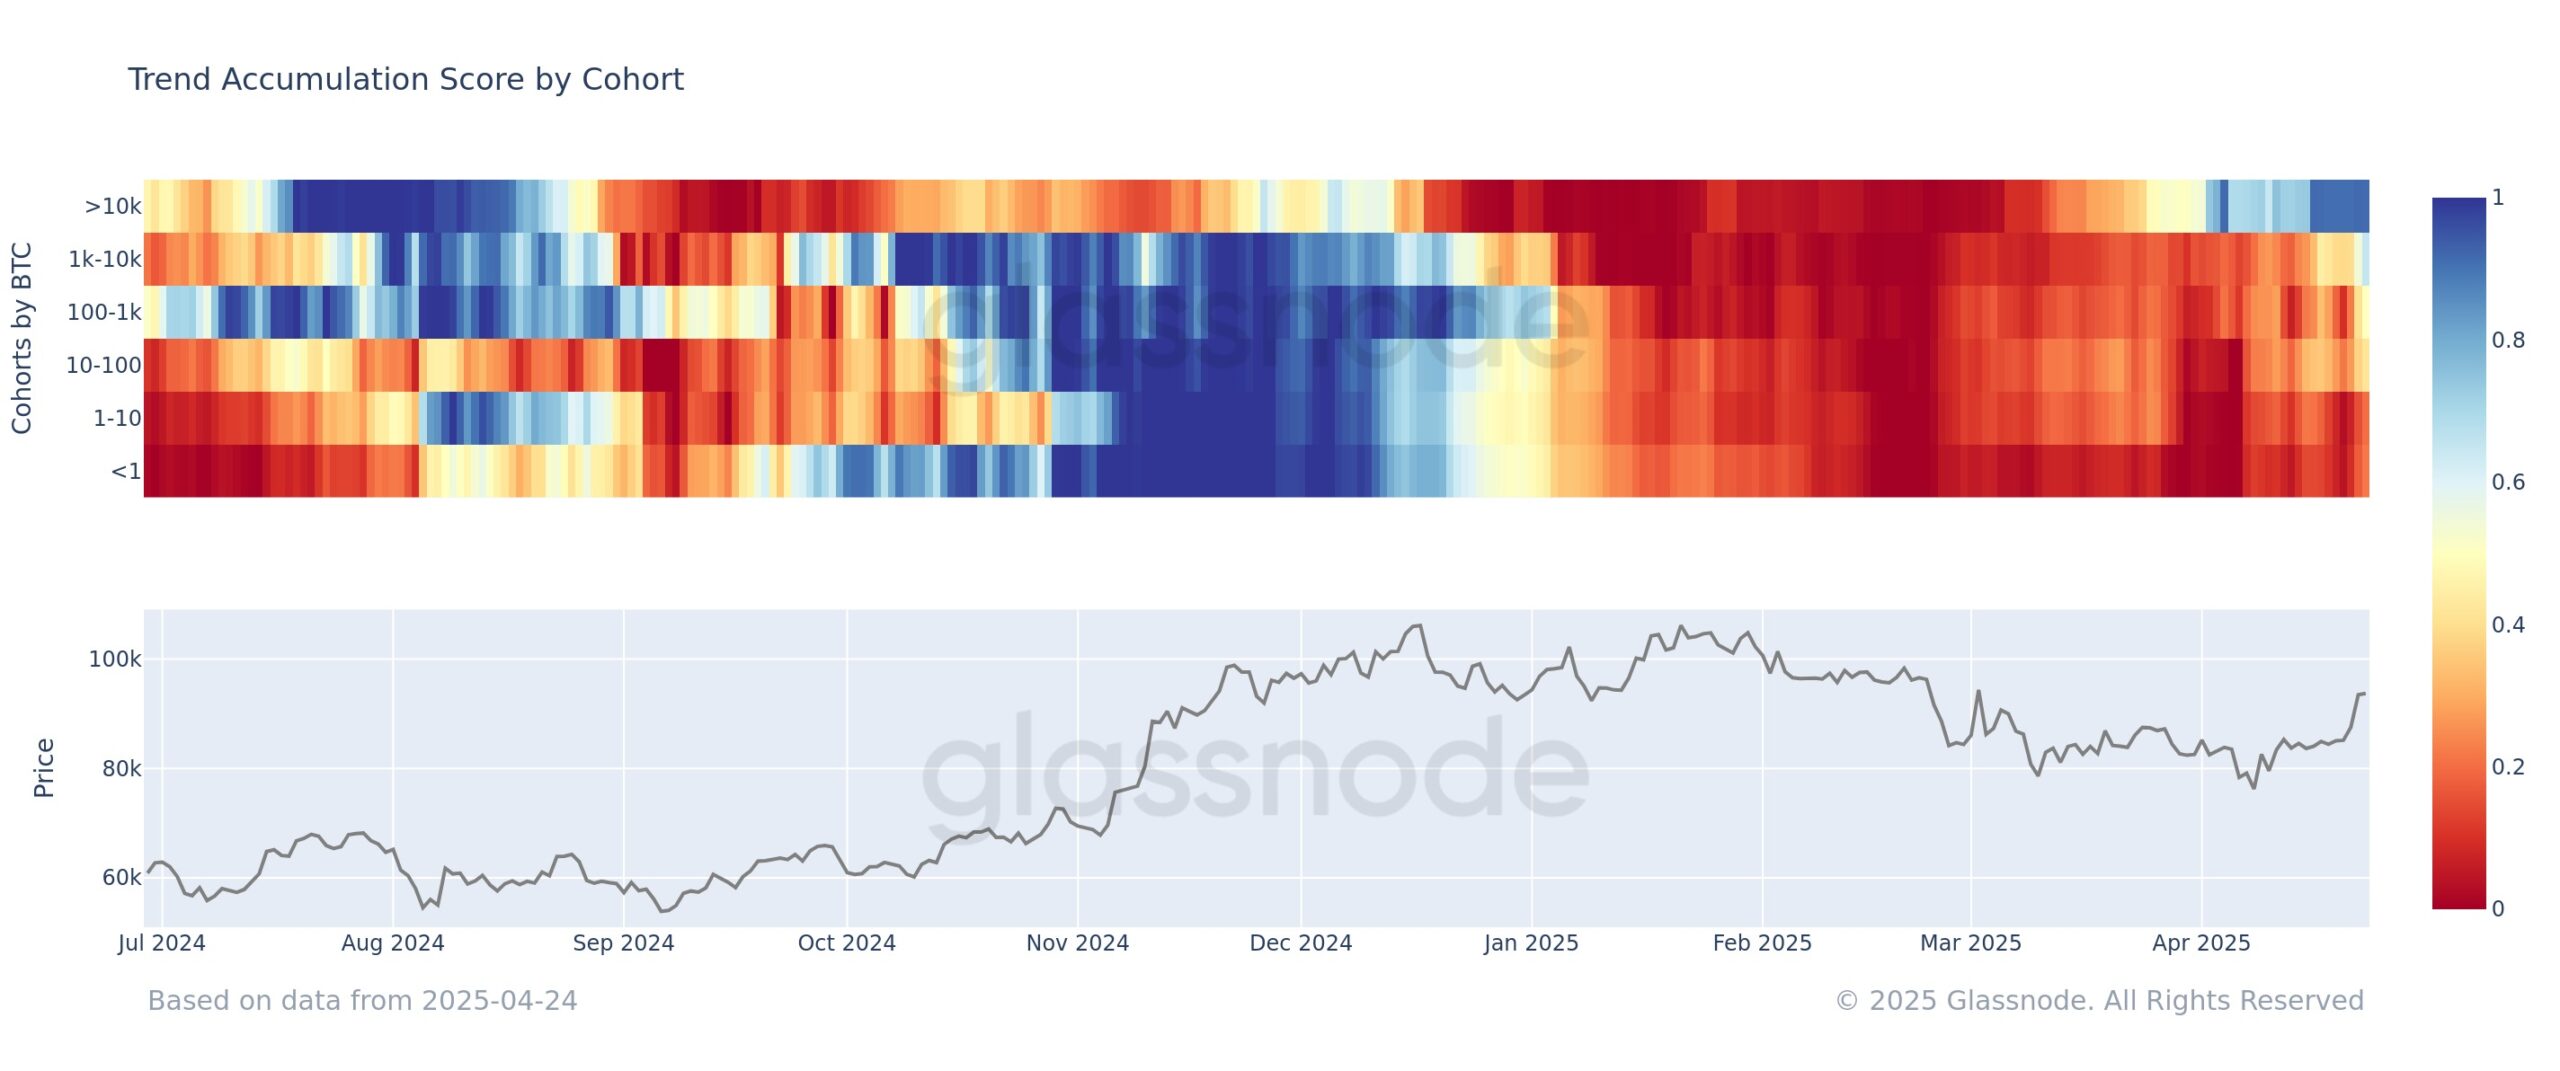
A chart from Glassnode reveals a clear transition from a distribution phase (marked in red) to an accumulation phase (marked in green) during April. This timing aligns with Bitcoin’s rebound from its monthly low.
Specifically, Bitcoin whales—wallets holding over 10,000 BTC—have been accumulating at near-perfect levels. Their Trend Accumulation Score is around 0.9.
Following the whales, wallets with 1,000 to 10,000 BTC gradually increased their accumulation score in the second half of April. Their score reached 0.7, as seen by the chart’s color shift from yellow to blue. Other wallet tiers also show signs of accumulation, reflecting changing sentiment among smaller whales.
“So far, large players have been buying into this rally,” Glassnode explained.
Additionally, a recent report from BeInCrypto highlights that Bitcoin ETFs recorded $2.68 billion in inflows last week. These ETFs have seen five consecutive days of positive inflows. These metrics confirm that demand is returning and lay the foundation for continued price gains.
Fidelity and ARK Invest Update Bitcoin Forecasts
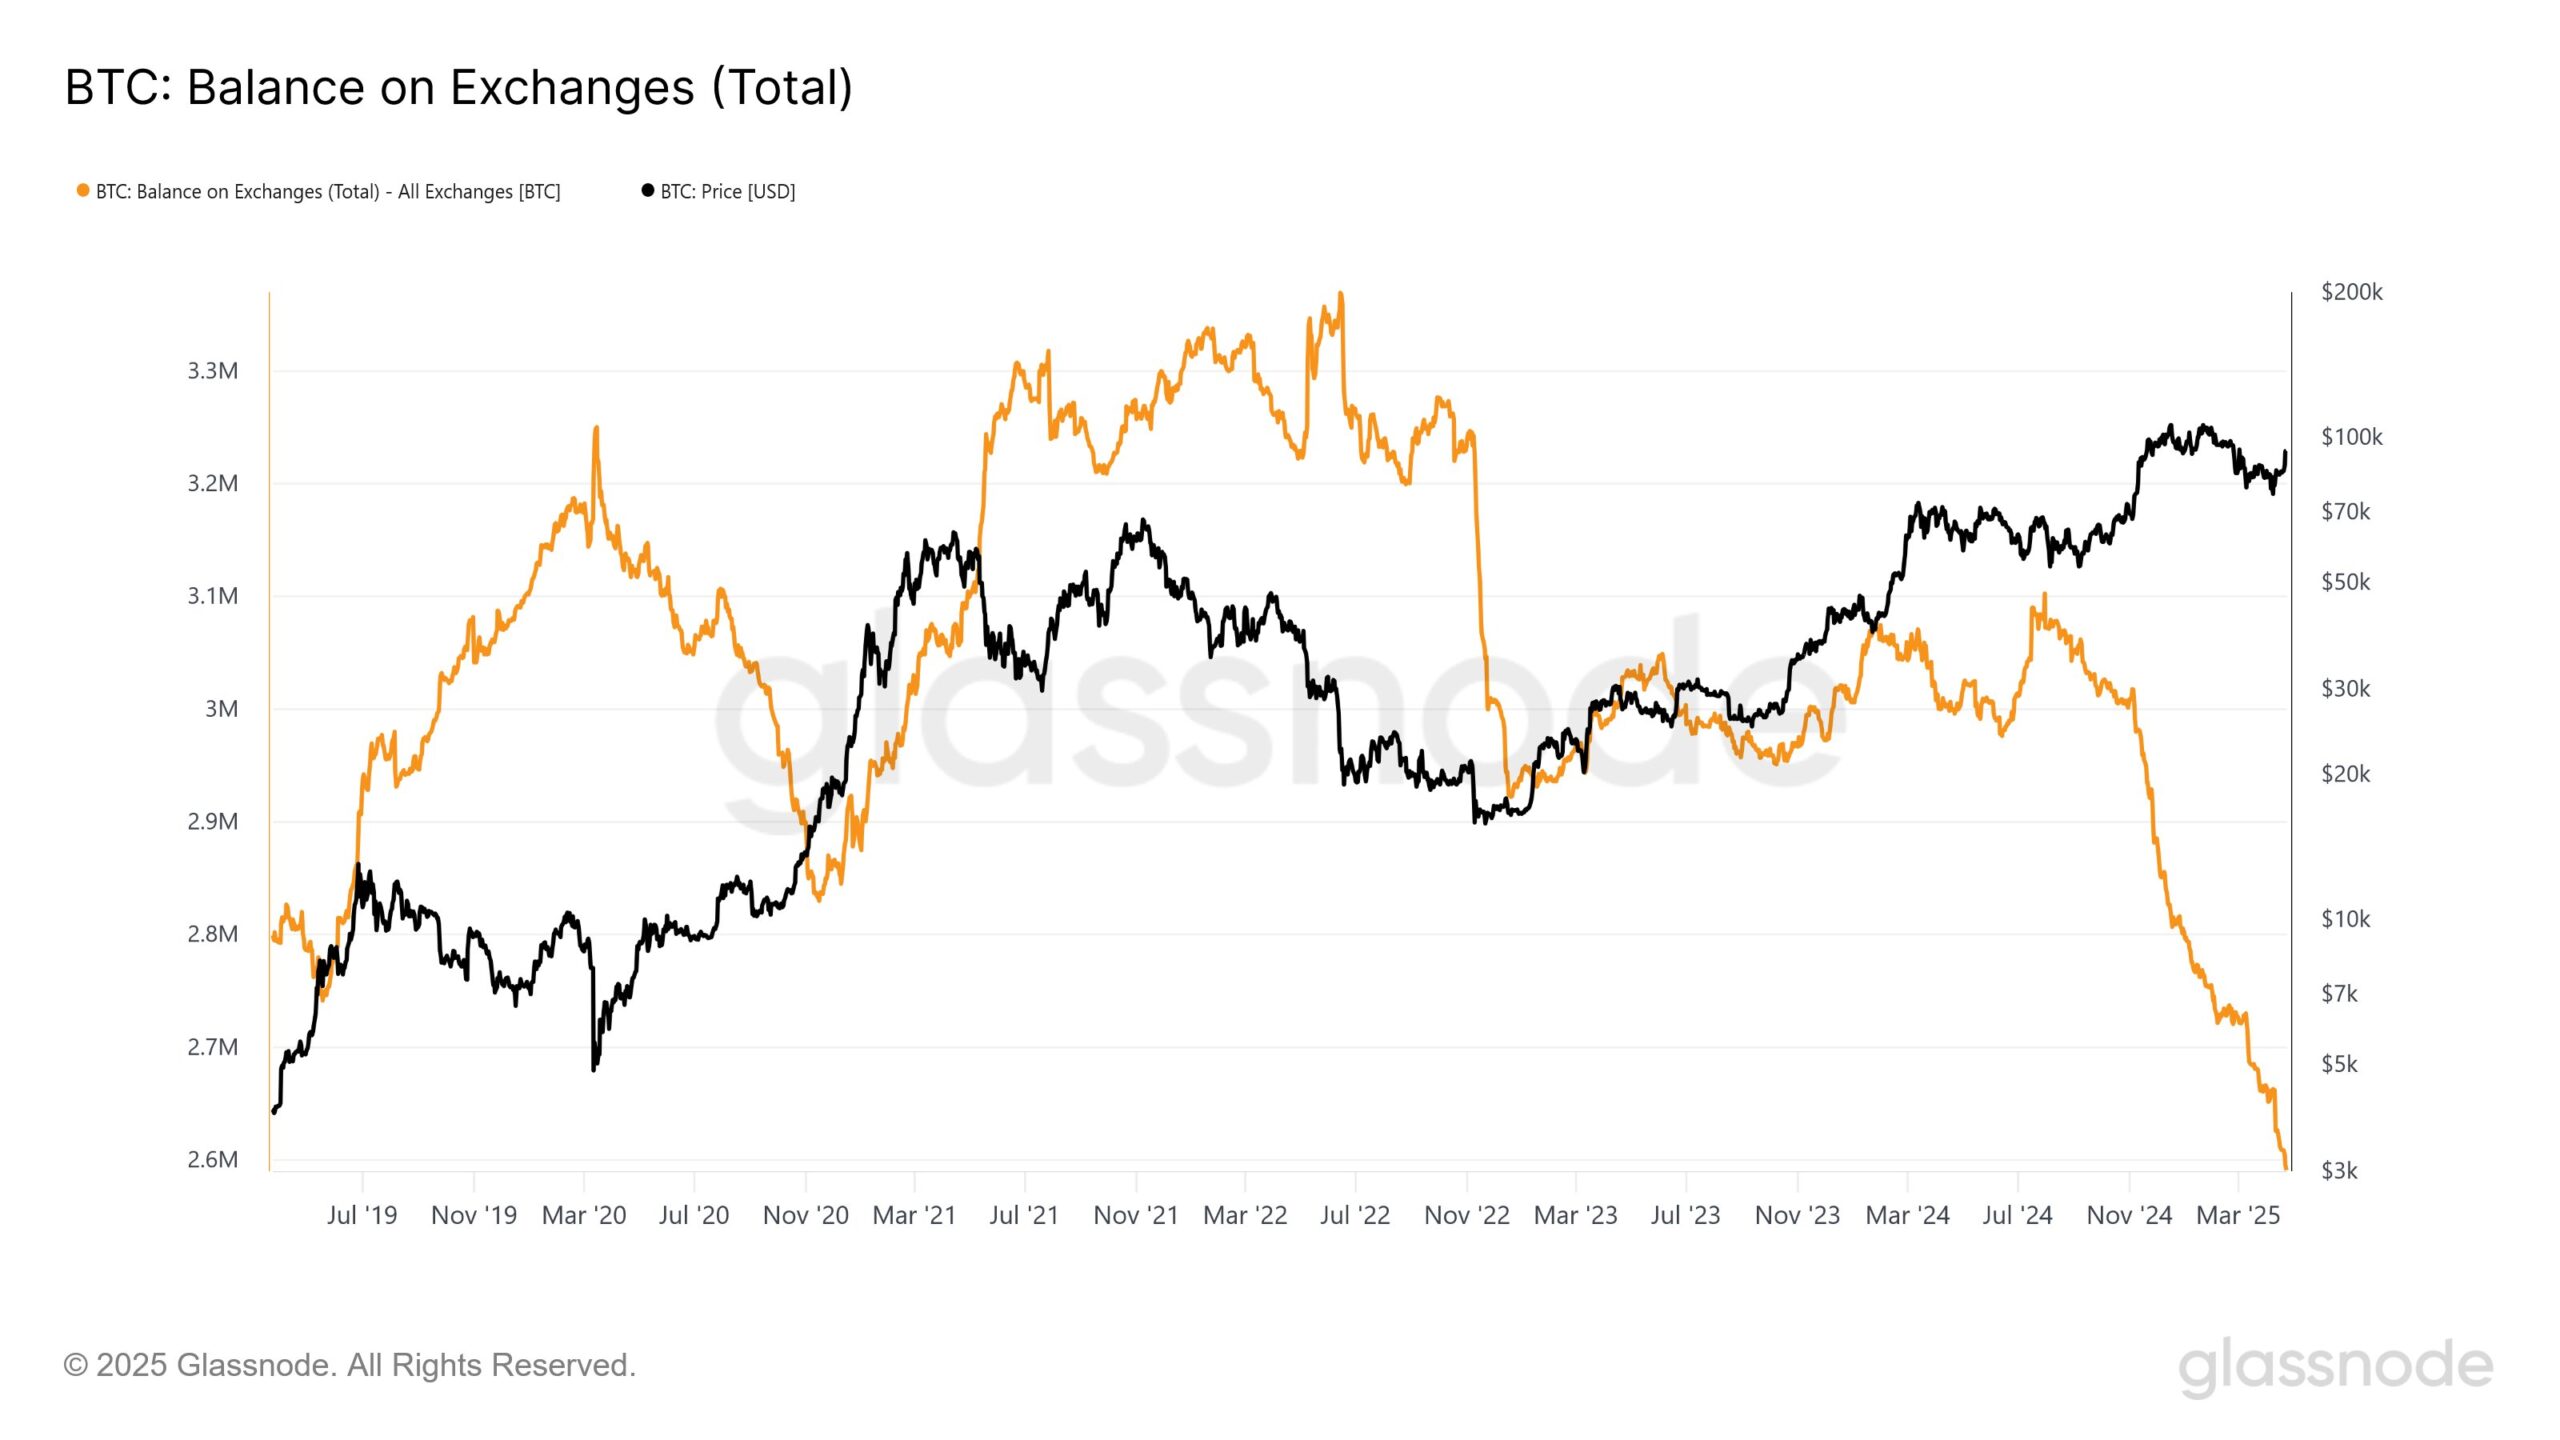
Fidelity Digital Assets, a branch of the $5.8 trillion asset management giant Fidelity Investments, reports that Bitcoin supply on exchanges has dropped to its lowest level since 2018, with only about 2.6 million BTC remaining.
Fidelity also noted that more than 425,000 BTC have left exchanges since November 2024. Public companies have added nearly 350,000 BTC since the US election and are buying over 30,000 BTC monthly in 2025. Fidelity expects this trend to continue.
“We have seen Bitcoin supply on exchanges dropping due to public company purchases—something we anticipate accelerating in the near future,” Fidelity Digital Assets stated.
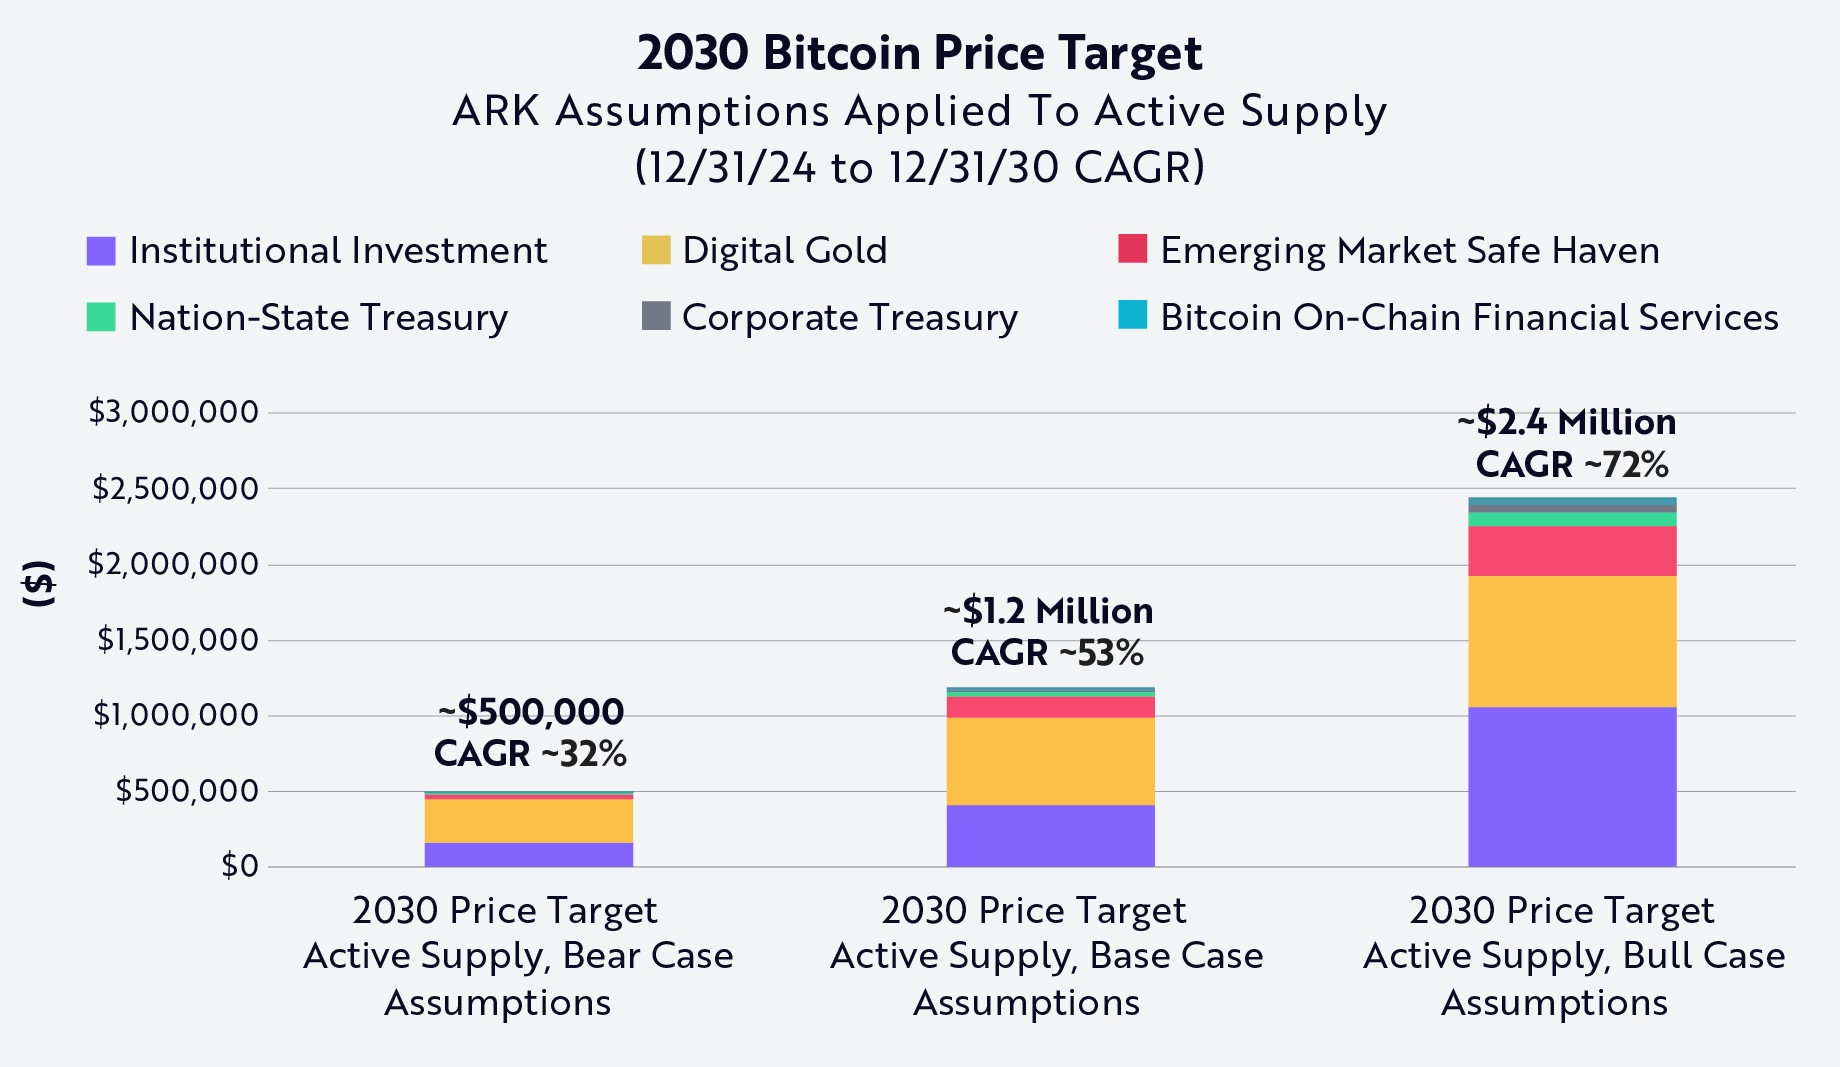
Meanwhile, ARK Invest has updated its Bitcoin price projection in the Big Ideas 2025 report. Under its most bullish scenario, Bitcoin could reach $2.4 million by 2030—far above its previous forecast of $1.5 million.
This projection relies on several factors: increasing institutional investment, the possibility of nations treating Bitcoin as a strategic reserve asset, and its growing role in decentralized finance.
While fund managers like Fidelity and ARK Invest have a positive outlook for April, some retail investors are beginning to express caution. The idea of “sell in May” is starting to surface, reflecting concern amid unpredictable macroeconomic factors, such as tariffs and interest rate shifts, that could strongly impact the market in the near future.
While most DeFi protocols chase the same categories, such as blue-chip tokens, staking protocols, and liquid stablecoins, a different type of asset activity is growing behind the scenes. People hold NFTs, LP tokens, meme coins, and tokenized real-world assets in their wallets that represent value, but most of them sit unused because few platforms are built to support them.
Paddle Finance was designed for this gap: a lending and trading protocol built to unlock liquidity from non-standard assets. It operates on Base and Berachain, where activity is accelerating. Berachain alone has reached $2.69 billion in TVL. While others chase volume in familiar categories, PaddleFi focuses on helping users make use of what they already hold.
Why Berachain Fits the Model
There’s no shortage of new L1s and L2s, but Berachain stands apart in how it ties liquidity to real utility. Its Proof of Liquidity (PoL) model rewards protocols for real on-chain activity rather than passive staking, making it a strong match for products built around asset movement and user interaction.
Berachain has also become home to a fast-growing NFT ecosystem, especially among more degen communities. Projects like Steady Teddys, Bullas, Mibera, and Yeet are drawing in active participants. These collections are already being used within PaddleFi for borrowing, OTC trading, and community-focused liquidity programs.
On the technical side, Berachain uses Ethereum-compatible tools, lowering friction for deployment. But what sets it apart is its alignment with platforms like PaddleFi that serve assets outside the ERC-20 standard—assets that often emerge organically from community-driven culture, not top-down design.
What PaddleFi Actually Does
Most DeFi platforms were built around standard tokens, and that makes sense as for a long time, those were the only assets with enough liquidity to be usable. But that’s no longer the case. NFTs now hold real on-chain value, RWAs are being tokenized, and meme coins often have strong market caps and communities. These assets still get limited support, but PaddleFi is designed specifically for them.
It offers:
NFT lending through peer-to-peer and instant loan models
Trustless OTC trading for NFTs, RWAs, and tokens without going through centralized platforms or brokers.
Basket collateral for multiple assets to be packaged into a single loan or trade.
This structure gives users more flexibility without needing to sell or split up what they own. It also creates access for groups that often get left out—collectors, small token holders, and early-stage RWA participants.
$2.55 Million TVL and Growing
PaddleFi’s traction on multichain is measurable. As of now, the protocol holds over $2.55 million in assets locked across its contracts. In just April, it has already processed more than $3 million in volume, with growing usage in lending and OTC functions. That’s a meaningful signal in an ecosystem still in its early stages, especially considering the complexity of the assets being supported.
And the activity isn’t coming from generalized DeFi users; it’s coming from NFT-native and degen communities on Berachain. Many of the assets being used on PaddleFi aren’t tokens you’ll find on major exchanges. They’re “middle-class” NFTs—collections with strong engagement, but not always headline prices, low-float meme tokens, and in-development real-world asset projects that are experimenting with early liquidity.
This fits naturally with Berachain’s design, a chain built around activity, not polish. Where value is more about how assets are used than how they look, PaddleFi offers clear utility for communities that want to do more than just hold.
Filling a Gap That’s Easy to Overlook
Berachain already has protocols that cover the basics: Kodiak for swaps, Infrared for staking, and Honey for stablecoin liquidity. What’s been missing is a way to use assets that don’t fit into those buckets.
That’s where PaddleFi fits in. It connects overlooked assets like NFTs and RWAs to usable tools. NFT holders can borrow without selling. RWA investors can access capital without waiting for centralized approval. Smaller tokens can be traded directly without needing a formal market.
PaddleFi doesn’t aim to replace other dApps; it adds functionality around asset types that usually get ignored. And in a chain like Berachain, where liquidity is high but fragmented, that role matters. PaddleFi helps bring more of that capital into circulation.
The Bigger Picture
If you zoom out, what PaddleFi is doing is simple: it’s building tools for assets that don’t yet have default infrastructure. But the implications are larger. As the definition of “on-chain assets” continues to expand, the platforms that support the long tail, rather than only the top 10 tokens, will be the ones that grow alongside the space.
PaddleFi is betting that the future of DeFi won’t just be about liquidity, but also about how many types of assets you can make liquid. And so far, that bet is paying off.
With Berachain scaling quickly and its Proof of Liquidity (PoL) model rewarding real usage, PaddleFi is well-positioned to go deeper. The upcoming launch of NFT-backed money markets will give collections another way to tap into DeFi building blocks, and protocols like PaddleFi are key to making that possible.
This combination of infrastructure and community alignment is proving durable. It’s a glimpse of what the next phase of DeFi infrastructure might look like: fast, flexible, and built for assets that don’t follow a template but still belong in the same system.
Base, a layer-two blockchain developed by Coinbase, has seen a significant surge in Total Value Locked (TVL) over the last 24 hours following a key integration.
It comes amid changing regulatory winds in the US, with President Trump’s pro-crypto stance inspiring bold moves among sector players.
Base TVL Soars 20% As Binance.US Adds Support
According to data on DefiLlama, Base TVL is up by $557 million. It moved from $2.778 billion on Thursday to $3.335 billion as of this writing, a 20% surge in the last 24 hours.
The surge in TVL suggests an increased volume of assets staked, locked, or deposited in the Base blockchain. A higher TVL indicates increased user activity, trust, and adoption, with users committing capital to the protocol.
Meanwhile, this surge follows a notable announcement from Binance.US, the American arm of Binance exchange, the world’s largest crypto trading platform by volume metrics.
According to the announcement, Binance.US now supports Base. It allows Ethereum (ETH) and Circle’s USDC (USD Coin) stablecoin transfers on the Layer-2 network.
“We’re excited to announce that Binance.US now supports Base! Starting today, you can deposit and withdraw Ethereum (ETH) and USDC via Base,” an excerpt in the announcement read.
The exchange highlighted that more assets will join Binance.US on the Base network, indicating interest in developing the integration. Meanwhile, using Base’s blockchain, users can deposit and withdraw ETH and USDC directly to and from Binance.US.
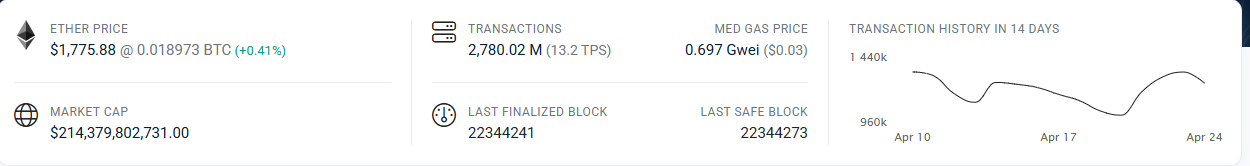
For the exchange, this integration could bolster accessibility. Specifically, Binance.US users can interact with Base’s ecosystem without bridging assets through Ethereum’s mainnet. This is amidst concerns that Ethereum’s mainnet is slow and costly.
As an L2 scaling solution, Base offers faster and lower-cost transactions compared to Ethereum’s mainnet. Data on Etherscan shows Ethereum’s transaction throughput is approximately 13.2 TPS. This could lead to network congestion and high gas fees during peak periods.
On the other hand, Base processes transactions off-chain, bundling them before submitting them to Ethereum. This Method achieves higher throughput and significantly lower fees, making it more cost-effective for users.
Therefore, the integration allows Binance.US users to move ETH and USDC to Base for DeFi activities at a fraction of the cost.
Binance.US suspended its USD deposit and withdrawal services following a high-profile SEC lawsuit and mounting regulatory pressure starting in 2023. However, amid shifted political rhetoric toward crypto, exchanges appear to be taking bold steps.
“Now that we’ve survived, our goal is to help crypto thrive and empower all Americans with freedom of choice,” Binance.US interim CEO Norman Reed said recently.
It aligns with a recent move from the Kraken exchange. As BeInCrypto reported, the US-based exchange listed BNB in a move that marked a strategic shift in US crypto exchanges, potentially signaling broader token adoption in the country.
As the city gears up to host the much-awaited Unchained Summit at the Kempinski Central Avenue on 28th and 29th April, a tide of excitement is rolling over the region’s Web 3.0, Blockchain, and Digital Assets industries.
The summit, hosted by Aeternum, promises more than an average Web 3.0 conference. It’s a high-conviction meeting of founders, investors, policy shapers, and enterprise leaders driving the frontiers of how decentralized infrastructure will transform identity, finance, and trust in the digital world.
Dubai’s Web 3.0 momentum is no longer a whisper, it’s a global signal. As the world tilts toward decentralized infrastructure, Dubai has emerged as the nexus where policy, capital, and innovation come together. With government-backed regulatory clarity, enterprise-grade adoption, and a thriving ecosystem of startups and investors, the emirate is fast becoming the capital of the decentralized ecosystem. Unchained Summit is more than a symptom of this energy; it’s the driving force. The Dubai edition brings global architects of Web 3.0 together in one place, making Dubai a living laboratory for what the internet of value, trust, and autonomy really is.
From builders to billionaires, Unchained Summit’s lineup of speakers include:
Ronghui Gu, Co-Founder, Certik
Ella Zhang, Head, YZi Labs
Kostas Chalkias, Co-Founder and Chief Cryptographer, Mysten Labs
Sreeram Kannan, Founder & CEO, EigenLayer
May Zabaneh, VP of Product – Blockchain, Crypto & Digital Currencies, PayPal
Greg Scanlon, VP Quantitative Blockchain, Franklin Templeton Digital Assets, Franklin Templeton
Keone Hon, Co-Founder, Monad Foundation
Lennix Lai, Global Chief Commercial Officer, OKX
Nils Andersen-Röed, Global Head of FIU, Binance, and more.
“Web 3.0 is a collective movement, and Unchained Summit is where the next wave of builders and thinkers come together. We’re here to drive the conversation. Web 3.0’s growth hinges on infrastructure that can scale — it’s about throughput, cost-efficiency, and long-term sustainability. We’re proud to be at Unchained Summit, pushing the notion on sustainable blockchain designs,” said Abhijit Shukla, Founder of TAN Blockchain.
Richard Ma, CEO & Founder of Quantstamp said, “I’m honored to be speaking at Unchained Summit, a premier event bringing together visionary leaders and innovators in the Web 3.0 ecosystem. At Quantstamp, we’re dedicated to securing the future of blockchain, and I look forward to sharing insights on advancing security, trust, and resilience within this rapidly evolving industry.”
“Markets are moving on-chain—not just assets, but access, distribution, and users. We’re excited to be at Unchained Summit talking about what it takes to put real-world assets in the hands of real people,” said José F. Pereira, Executive Director, Own.
“Web 3.0 moves fast—and the ones who show up shape where it goes. Unchained Summit brings together the doers, not just the talkers. At TBV, we’re here to back the founders turning big ideas into real traction,” said Tobias Bauer, General Partner, TBV.
“Dubai is no longer just participating in Web 3.0, but it’s directing traffic,” says Sharath Kumar, Founder & CEO of Aeternum and organizer of Unchained Summit. “This is the one of the first real moments where we’re seeing decentralized technologies collide with institutional capital, national policy, and entrepreneurial energy—all in one city.”
With increasing interest in industries ranging from AI-driven gaming to tokenized assets, Unchained Summit indicates a wider industry transition: Web 3.0 is increasingly finding its way into mainstream enterprise planning. And as a result of this, after its Dubai edition, Unchained Summit is set to make its India debut on 5th and 6th December 2025, reaffirming its commitment to bridge APAC, Middle Eastern, and European Web 3.0 & Crypto ecosystems.
As the Dubai chapter draws to a close, one thing is certain: the decentralized future is no longer a distant prospect; it is happening already.
Tickets for the Dubai edition are on sale on the official site: unchainedsummit.com
About Aeternum Consulting Ltd
Aeternum organizes business-to-business events in the emerging tech space, provides strategic consulting, and tailored services to a diverse range of clients, from corporations to governments and startups to individuals. Aeternum specializes in crafting impactful B2B platforms that foster meaningful connections, drive business growth, and facilitate knowledge sharing through conferences, exhibitions, and bespoke networking opportunities.For more information visit: aeternuminc.com
Since its launch in late March, World Liberty Financial’s stablecoin USD1 has achieved an impressive market capitalization, reflecting strong investor interest. If the creators want to maximize USD1’s reach by accessing markets abroad, particularly in Europe, they must confront MiCA’s extensive compliance list.
In a BeInCrypto interview, experts from Foresight Ventures, Kaiko, and Brickken stressed the importance of stablecoin issuers having substantial European bank reserves, operational volume caps protecting the euro, and transparent USD1 information to ensure transparency and avoid conflicts of interest.
USD1’s Search for Dollar Dominance
World Liberty Financial (WLF), a decentralized finance (DeFi) project heavily associated with the Trump family, officially launched USD1 a month ago. Through this stablecoin, WLF aims to promote dollar dominance worldwide.
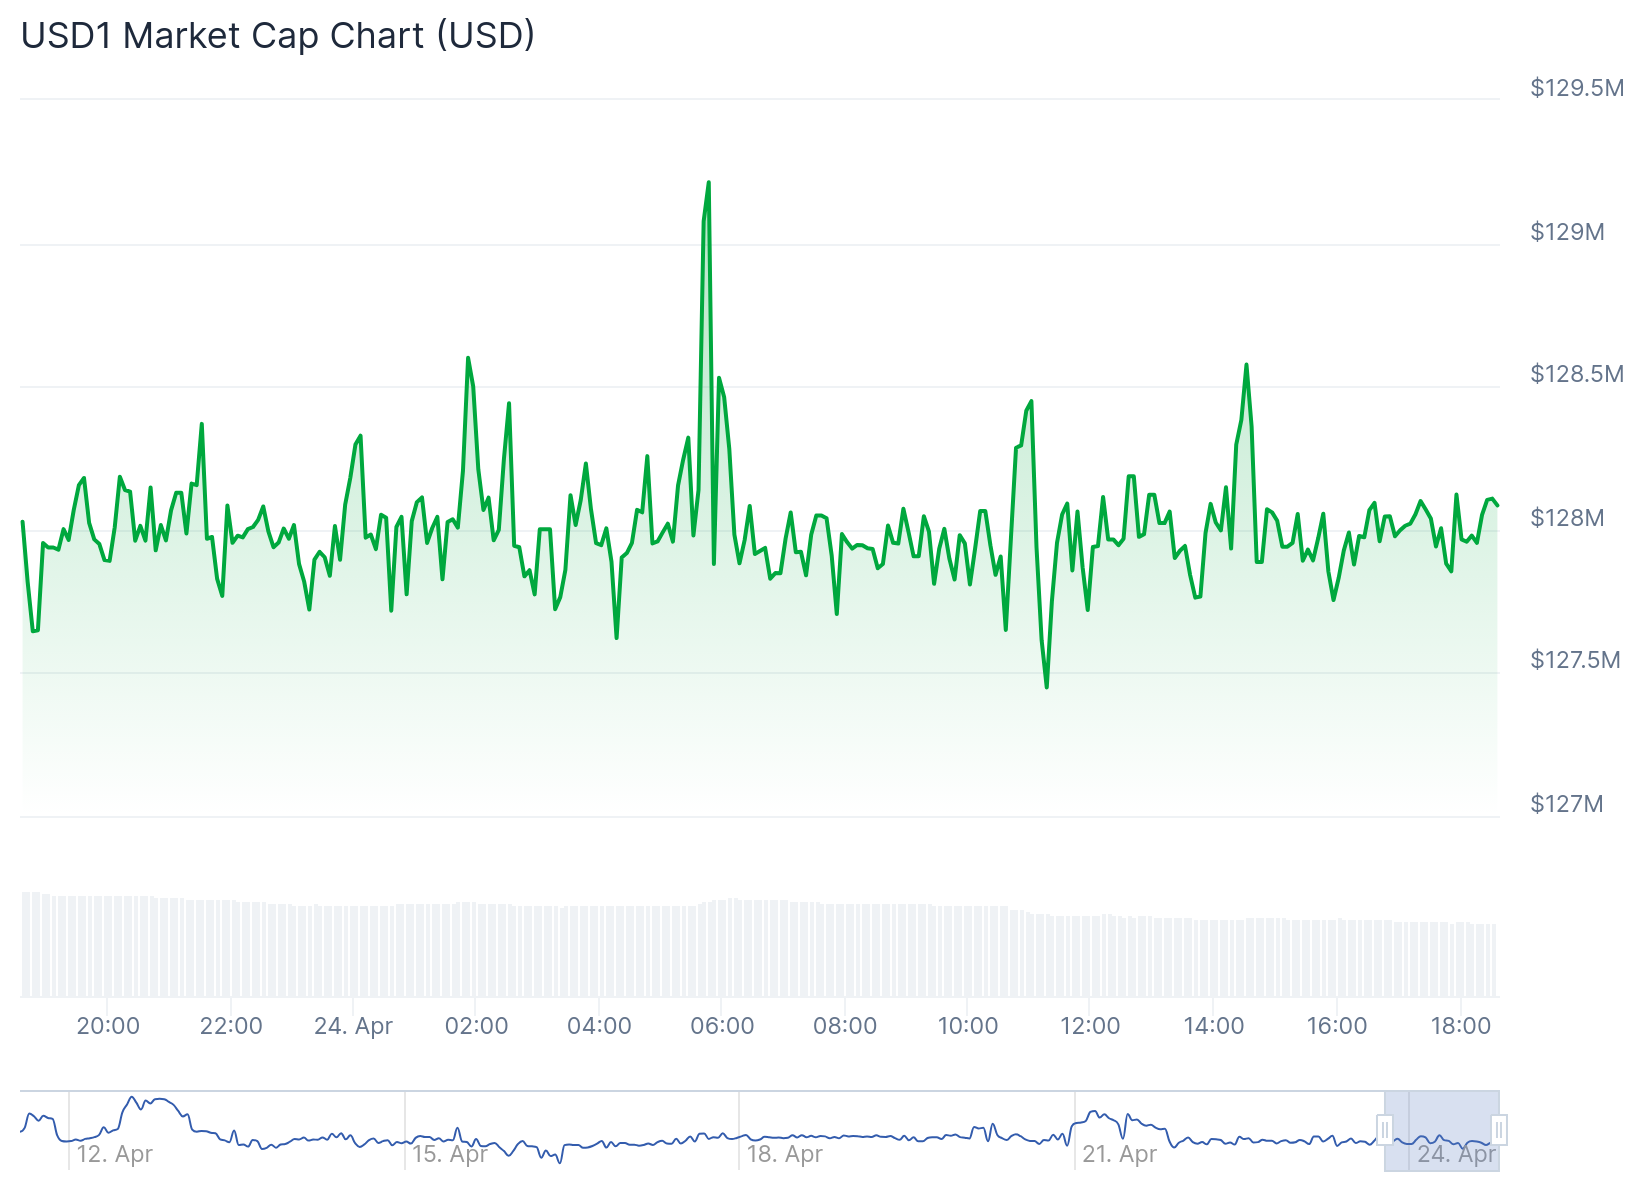
So far, this initiative has been working well for WLF. According to CoinGecko, USD1 has now surpassed a market capitalization of $128 million and reached a 24-hour trading volume of nearly $41.6 million. The project has already released 100% of its total supply of 127,971,165 tokens.
USD1’s market capitalization over the past 24 hours. Source: CoinGecko.
For WLF to seriously establish dollar dominance across the globe, it will have to move fast and efficiently. This urgency stems from the need to surpass its main competitors, USDT and USDC. These rivals currently hold a massive market share advantage.
Additionally, there’s a need to maintain a competitive advantage against established currencies like the euro.
USD1 needs to access foreign markets and stand out from established competitors to achieve this. Should Europe become a primary target, USD1 must prepare to tackle numerous challenges head-on.
The EU’s Stringent Compliance Demands
The European Union (EU) became the first jurisdiction in the world to establish a comprehensive regulatory framework for digital assets across its 27 member states. This regulation, known as Markets in Crypto-Assets (MiCA), has been in effect for nearly four months. Through this legislation, the EU has confirmed how seriously it takes compliance with a defined regulatory regime.
The regulation is detailed and clear, leaving no room for interpretation. If USD1 wants to operate in this crypto market of 31 million users, it must ensure it meets every demand.
US Senators Flag Risks of Presidential Involvement in USD1
In the letter, the group asked both agencies to clarify how they plan to uphold regulatory integrity following the issuance of USD1.
The Senators cautioned that letting a president personally benefit from a digital currency overseen by federal agencies he has sway over is a big risk to the financial system. They argued that an unprecedented situation like this one could hurt people’s trust in how regulations are made.
“The launch of a stablecoin directly tied to a sitting President who stands to benefit financially from the stablecoin’s success presents unprecedented risks to our financial system,” they argued.
The letter further detailed situations where Trump could directly or indirectly affect decisions regarding USD1.
As things stand, USD1 isn’t well-prepared to follow MiCA’s strict reporting and transparency rules.
How Do Concerns Over USD1 Impact MiCA Acquisition?
According to Ianeva-Aubert, if USD1 doesn’t clear up doubts over potential conflicts of interest, this would affect its ability to apply for an operating license in the European Union.
“MiCA requires strong governance, including independent directors and clear separation between owners and managers. Issuers must have clear rules to handle conflicts of interest. If USD1 has any conflicts, this could make it harder to comply,” she said.
Ianeva-Aubert also highlighted that WLF still hasn’t released enough public information on USD1 to assess the degree of its compliance effectively. In particular, the stablecoin issuer has not disclosed the measures it would take to safeguard against market manipulation.
As of now, USD1 would likely fail MiCA’s transparency tests. However, industry experts pointed out other parts of the framework that might be even larger obstacles for USD1 to operate across the European Union.
Impact of the EU’s Reserve Mandate on USD1
When asked about the biggest regulatory hurdles USD1 would face in securing a MiCA license, experts’ responses were unanimous. The stablecoin would need to store a large portion of its reserves in a European bank.
This mandate has proven difficult for established stablecoin issuers seeking operations across the region.
This regulation aims to ensure seamless accessibility for European crypto users and traders. For Forest Bai, Co-founder of Foresight Ventures, USD1 could capitalize on this opportunity during the early stages of its development. By doing so, it could avoid some of the obstacles its competitors had to endure.
Yet, even as USD1 scales and its demand grows, other mandatory requirements could restrict its scope of success.
MiCA’s Transaction Volume Caps to Preserve Euro Dominance
As part of the MiCA regulation, the European Union has taken specific measures to safeguard the euro’s dominance. If a digital currency not denominated in euros were to become extensively adopted for daily payments within Europe, it could present a potential risk to the European Union’s financial sovereignty and the stability of the euro.
To contain this possibility, MiCA places volume caps on transactions used as a means of exchange within the EU.
In other words, MiCA establishes predefined limits on the transactional volume of such currencies. The EU initiates regulatory measures when these limits are exceeded due to widespread payment usage.
Specifically, USD1 issuers must suspend any further digital currency issuance and provide a remediation plan to the relevant regulator, outlining steps to ensure their usage does not negatively impact the euro.
If USD1 wants to work in places where it can experience uninhibited growth, the European market might not be the best fit for this stablecoin. Other parts of MiCA also suggest this could be the case.
MiCA Limitations to Stablecoins as Investment Vehicles
EU regulators have been clear that stablecoins, or e-money tokens (EMTs), as the regulation refers to them, are payment instruments that should not be confused with investment vehicles. The MiCA framework has a few rules in place to prevent this.
Given the circumstances, experts like Bai think WLF might want to focus on countries with better market conditions for stablecoin issuers.
Should WLF Consider the EU Market for USD1 Operations?
While the European Union has an undeniable crypto market presence, other jurisdictions have an even larger footprint.
”The EU’s crypto market remains comparatively small, with just 31 million users versus Asia’s 263 million and North America’s 38 million users, according to a report from Euronews. This limited market size may not justify MiCA compliance costs for projects, like WLFI,” Bai told BeInCrypto, adding that “Projects ultimately determine their own growth strategy. Given that, currently, the EU represents a secondary market for USD1, the project’s strategic priorities may naturally shift toward regions with less stringent stablecoin regulations to drive its adoption.”
These circumstances alone may prompt USD1 to reconsider its options.
In fact, USD1 could start by gaining a competitive edge right at home.
USD1’s Political Backing at Home
With a crypto-friendly president in office –whose very crypto project officially announced the launch of USD1– the stablecoin has sufficient backing to make its mark.
Looking past the immediate future, Bai underlined that if the US doesn’t keep developing supportive crypto regulations, USD1’s growth in the country could be held back following a government shift.
Given this reality, USD1’s failure to comply with the EU’s regulations, should it ever even consider applying for a MiCA license in the first place, could have negative consequences for the project’s long-term viability.
Regardless of the markets WLF evaluates in its efforts to increase the reach of USD1, compliance with general stipulations concerning transparency, legal architecture, and real-time transaction oversight could be conducive to its eventual success.
Arbitrum (ARB) wanted to join Nvidia’s Ignition AI Accelerator program but was reportedly turned down as part of the chipmaker’s risk control strategy.
The Layer-2 (L2) network has been strategically attempting to rebuild its reputation amid an ongoing struggle to recover from an 85% price dip.
Nvidia Turns Down Arbitrum’s Bid
Reports indicate that Arbitrum had originally planned to be the Ethereum partner in Nvidia’s Ignition AI Accelerator program. However, the L2 network was reportedly turned down at the last moment.
As it happened, the American multinational technology company prefers to avoid crypto firms for risk control purposes.
“Nvidia recently explicitly excluded cryptocurrency-related projects from its Inception program,” Wu Blockchain reported.
Indeed, when Nvidia launched its accelerator program, the firm articulated on the application page that crypto-related firms would not be eligible.
“The following types of organizations do not qualify for membership: Consulting and outsourced development firms, companies associated with cryptocurrency, cloud service providers, resellers and distributors, and public companies,” read an excerpt on the application page.
This stance presents a calculated risk to preserve the GPU giant’s AI-first brand identity. Nevertheless, some say the move could stifle innovation as artificial intelligence and decentralized systems tend to intersect.
“The recent announcement by Nvidia to exclude cryptocurrency-related projects from its Inception program raises questions about the future of collaboration between traditional tech giants and the blockchain sector,” one user shared on X (Twitter).
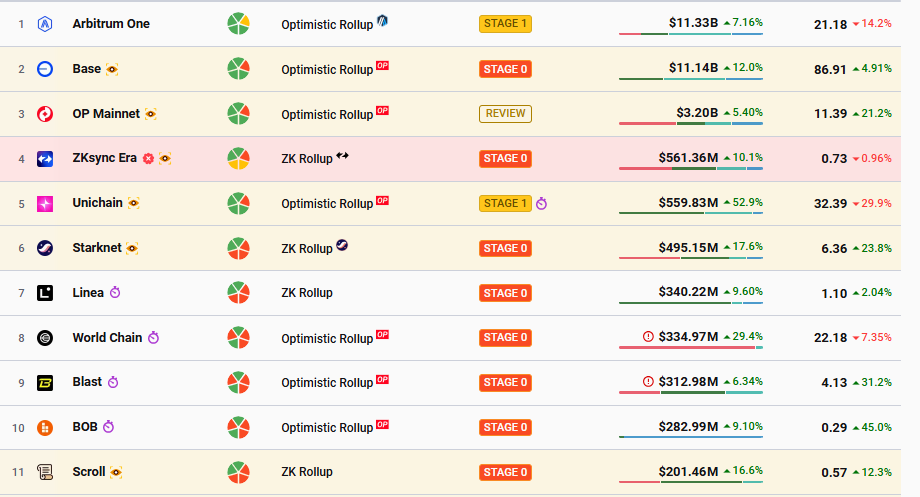
Arbitrum is Ethereum’s largest layer-two scaling solution, trailed by other players in the same space, including Optimism (OP). Data on L2Beats shows Arbitrum One, the optimistic rollup that inherits Ethereum’s security by posting transactions on-chain, leads L2s in TVL metrics.
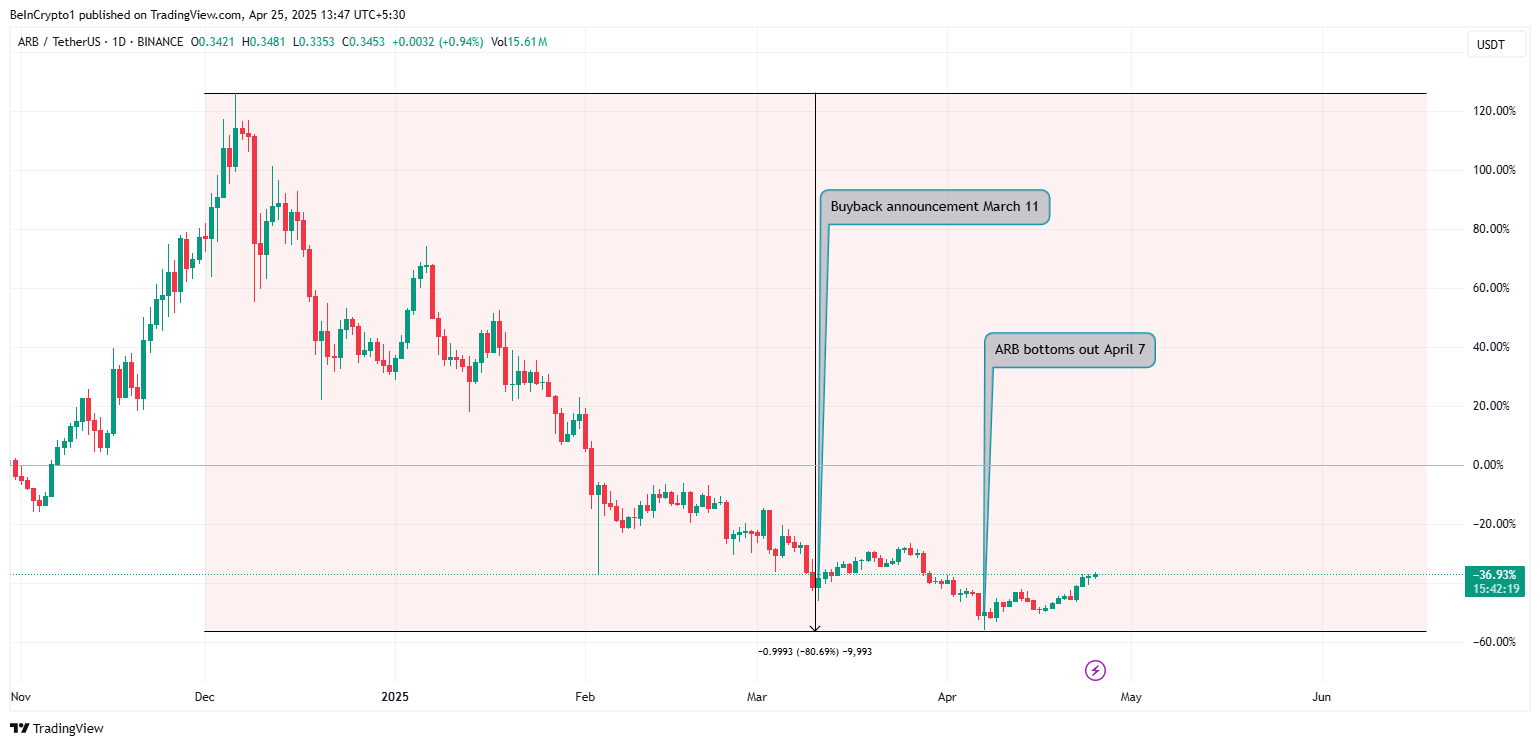
While Arbitrum leads L2 scaling solutions, it remains well below its December 6, 2024, high of $1.2384. Against this backdrop, the network has been taking steps to recover.
Among them is a token buyback initiative in March to strengthen its ecosystem and absorb supply shocks due to a massive token unlock event. For a time, the initiative worked, buoying ARB price 36% before the downtrend continued, bottoming out at $0.2420 on April 7.
Nevertheless, analysts suggested more interventions with the token still over 70% below its December highs. Yogi, a well-known wallet maxi, said strategies like token buybacks lack long-term vision as they signal a slowdown in innovation.
Similarly, a Messari Crypto researcher, Patryk, suggested that Arbitrum remains flexible and deploys funds into strategic areas over time rather than committing to a rigid framework such as token buybacks.
“I think projects will do this eventually. It’s just difficult to announce a concrete plan for the funds at the beginning of buybacks, like those that Arbitrum just announced. Remain flexible,” the researcher suggested.
Accordingly, Arbitrum may have considered pivoting to Nvidia’s accelerator program for a competitive edge. Now that this plan has fallen, Aributrum faces an ARB airdrops proposal to incentivize early supporters.
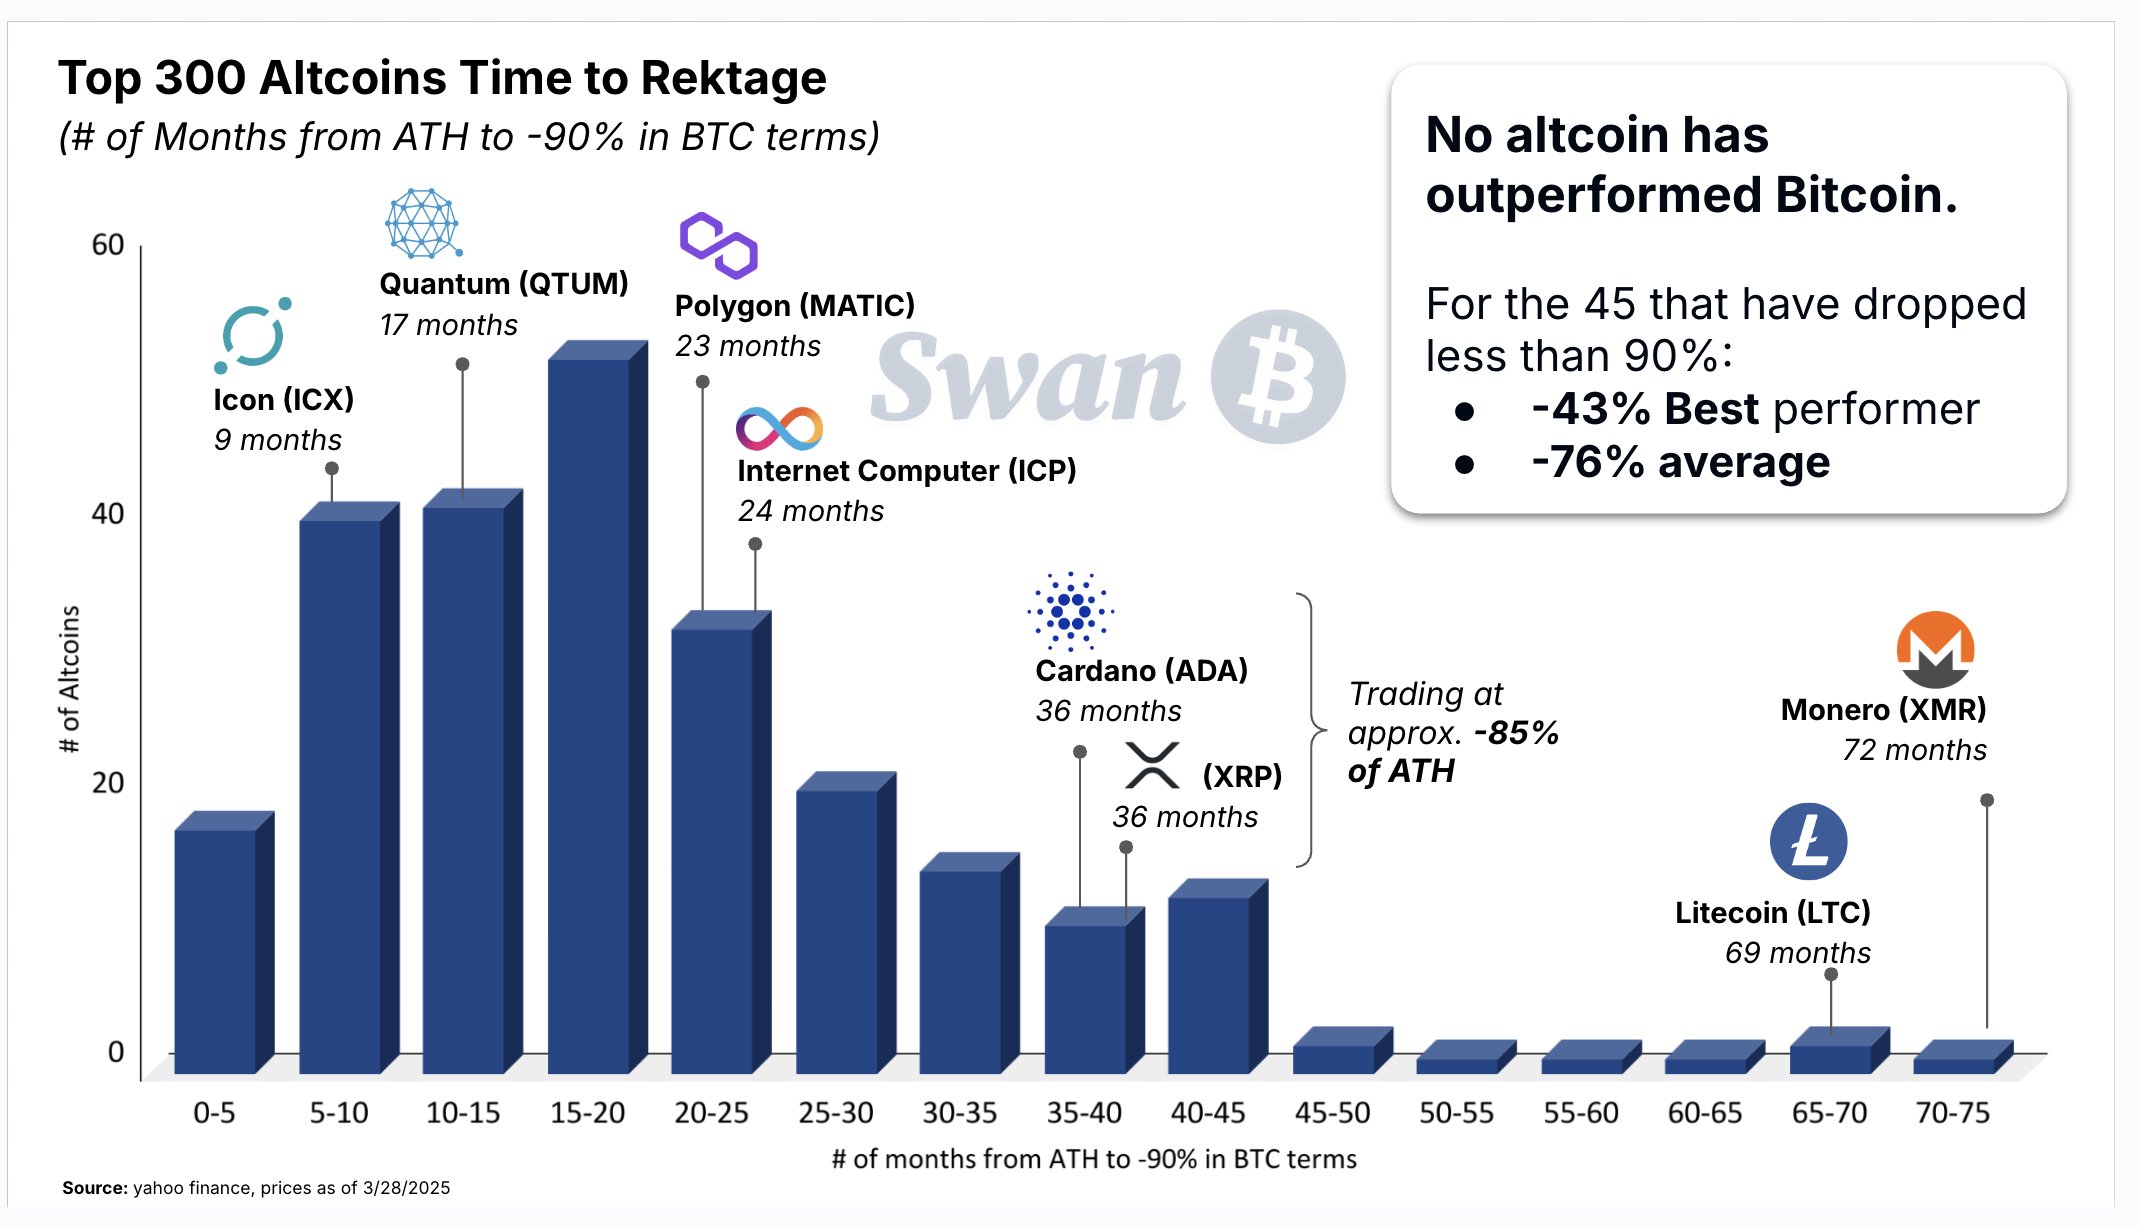
A recent study by Swan, a Bitcoin financial services company, has revealed that most alternative cryptocurrencies (altcoins) experience rapid and systemic depreciation when measured against Bitcoin (BTC).
The findings highlight Bitcoin’s role as a more stable asset for capital preservation in the fluctuating cryptocurrency market.
Bitcoin vs. Altcoins: Which is Better?
Swan shared its insights in a detailed thread on X (formerly Twitter).
“Altcoins don’t just underperform Bitcoin. They collapse against it,” the post read.
The analysis examined the performance of the top 300 altcoins over five years. It focused on the time it takes for these assets to lose 90% of their value relative to Bitcoin after reaching their all-time highs (ATH).
“The median altcoin reached a -90% drawdown in just 10–20 months,” Swan revealed.
Moreover, according to Swan’s data, Terra (LUNA1), Ontology Gas (ONG), and Bitgert (BRISE) collapsed the fastest, hitting the 90% drawdown mark in under two months. Larger, more established altcoins were not immune to this trend.
For instance, Cardano (ADA) and XRP (XRP) took 36 months to depreciate 90% from their record peak. Meanwhile, Litecoin (LTC) experienced a gradual decline, taking 69 months. Monero (XMR) saw the slowest drop, taking six years to reach a -90% drop.
Altcoin’s Performance Compared to Bitcoin. Source: Swan
The average drawdown for these altcoins is 76% from their peak value. Even the best-performing altcoin among them is still down by 43% compared to BTC.
“Bitcoin remains the benchmark for capital preservation. These assets don’t hedge Bitcoin — they bleed against it,” Swan added.
The findings point to a systemic issue within the altcoin space. The data suggests that altcoins, often marketed as alternatives to Bitcoin, fail to deliver sustained value over time compared to the leading cryptocurrency.
Swan also stressed that long-term outperformance by altcoins is exceptionally rare. Furthermore, the firm believes survivorship bias — the tendency to focus on successful projects — has hidden the widespread decay across the broader market.
“With performance like this, it’s astonishing that altcoins continue to exist. Then again, humans love gambling,” Swan executive John Haar remarked.
However, the vast majority of these tokens fail to deliver. BeInCrypto recently reported that 89% of tokens listed on Binance in 2025 are in the red. Thus, newer altcoins’ value is driven more by short-term trading and hype rather than any lasting fundamentals.
This shift is largely due to Bitcoin’s increasing dominance in the market, bolstered by institutional adoption and growing regulatory attention. While Bitcoin solidifies its position as the dominant digital asset, the same cannot be said for altcoins, which struggle to maintain relevance and investor interest in the face of Bitcoin’s continued rise.
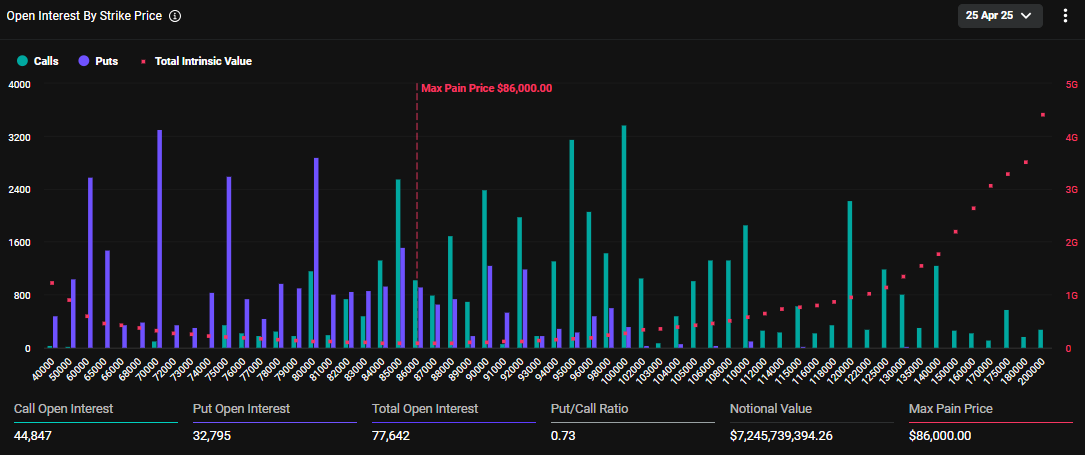
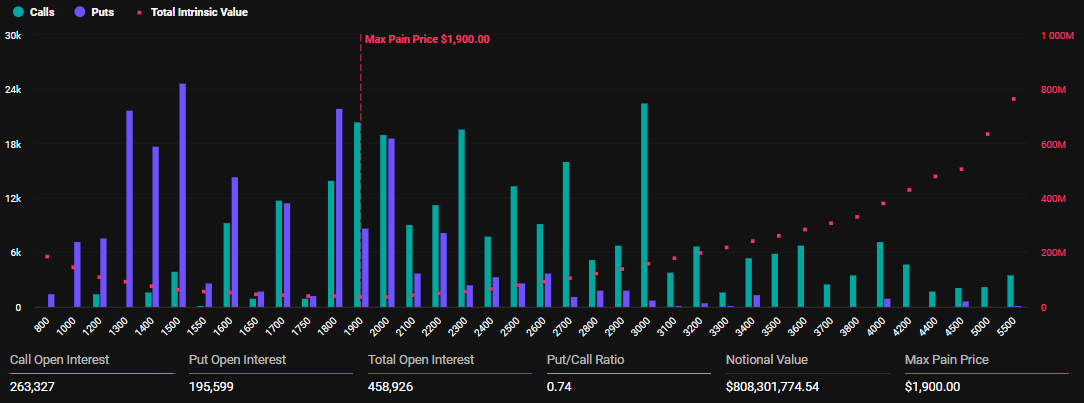
Today, approximately $8.05 billion worth of Bitcoin (BTC) and Ethereum (ETH) options expire, prompting crypto market participants to brace for volatility.
Traders and investors should be particularly attentive to today’s options expiry due to its volume and notional value, increasing the odds of potential influence on short-term trends. However, the put-to-call ratios and maximum pain points provide insight into what can be expected and the possible market directions.
Insights on Today’s Expiring Bitcoin and Ethereum Options
The notional value of today’s expiring Bitcoin options is $7.24 billion. According to Deribit’s data, these 77,642 expiring Bitcoin options have a put-to-call ratio 0.73. This ratio suggests a prevalence of purchase options (calls) over sales options (puts).
The data also reveals that the maximum pain point for these expiring options is $86,000. In crypto options trading, the maximum pain point is the price at which the asset will cause the greatest number of holders’ financial losses.
In addition to Bitcoin options, 458,926 Ethereum options contracts are set to expire today. These expiring options have a notional value of $808.3 million, a put-to-call ratio of 0.74, and a maximum pain point of $1,900.
The number of today’s expiring Ethereum options was significantly higher than last week. BeInCrypto reported that last week’s expired ETH options were 177,130 contracts, with a notional value of $279.789 million.
As of this writing, Bitcoin was trading well above its maximum pain level of $86,000 at $93,471. Meanwhile, Ethereum was trading below its strike price of $1,900 at $1,764.
“BTC trades above max pain, ETH below. Positioning into expiry is anything but aligned,” Deribit analysts remarked.
With the max pain level (also called strike price) often acting as a magnet for price due to smart money actions, both Bitcoin and Ethereum could pull towards their respective levels.
The positioning of both BTC and ETH open interest indicates high trader activity near max pain. The dense clustering of their respective histograms around $80,000 to $90,000 for Bitcoin and around $1,800 to $2,000 for Ethereum shows this.
This positioning suggests potential for short-term price consolidation or volatility.
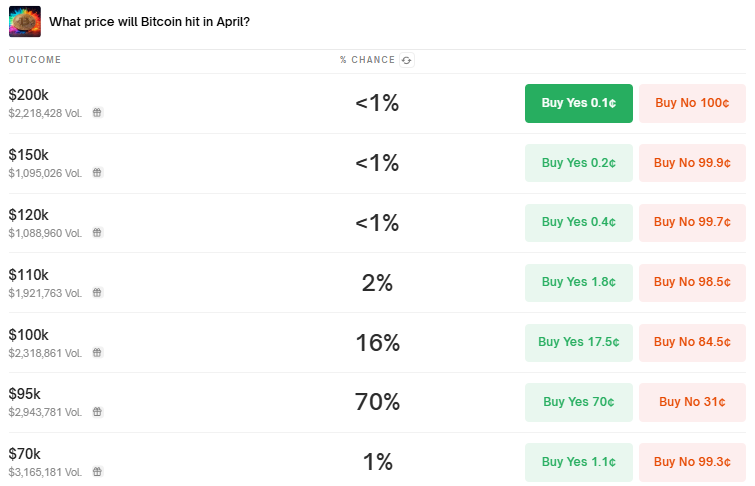
Polymarket: Only 16% Chance Bitcoin Price Hits $100,000 in April
According to Deribit, traders are selling cash-secured put options on Bitcoin. Further, they are using stablecoins to collect premiums while positioning to buy BTC at lower prices. This reflects a long-term bullish outlook.
“BTC traders on Deribit are expressing long-term bullish sentiment, selling cash-secured puts using stablecoins to potentially buy the dip and collect yield,” Deribit wrote.
Analysts on Deribit also note the highest open interest for BTC options around the $100,000 strike price. This indicates strong market expectations of Bitcoin reaching this level.
Nevertheless, data on the Polymarket prediction platform shows traders estimating only a 16% chance of BTC hitting $100,000 in April.
Another interesting observation is that the Cumulative delta (CD) across BTC and related ETF (exchange-traded fund) options on Deribit reached $9 billion. While this shows high sensitivity to Bitcoin price changes, it also suggests potential volatility as market makers hedge their positions.
Notwithstanding, Deribit analysts also reveal a surge in Bitcoin call option buying for April to June 2025 expiries. Investors are reportedly targeting strikes between $90,000 and $110,000, a sentiment inspired by Bitcoin’s price breaking above 89,000.
Nevertheless, not all activity leading up to Bitcoin’s recovery was new money or a fresh capital influx. According to an analysis by Deribit’s Tony Stewart, half of it involved rolling up existing positions, indicating strategic adjustments by traders.