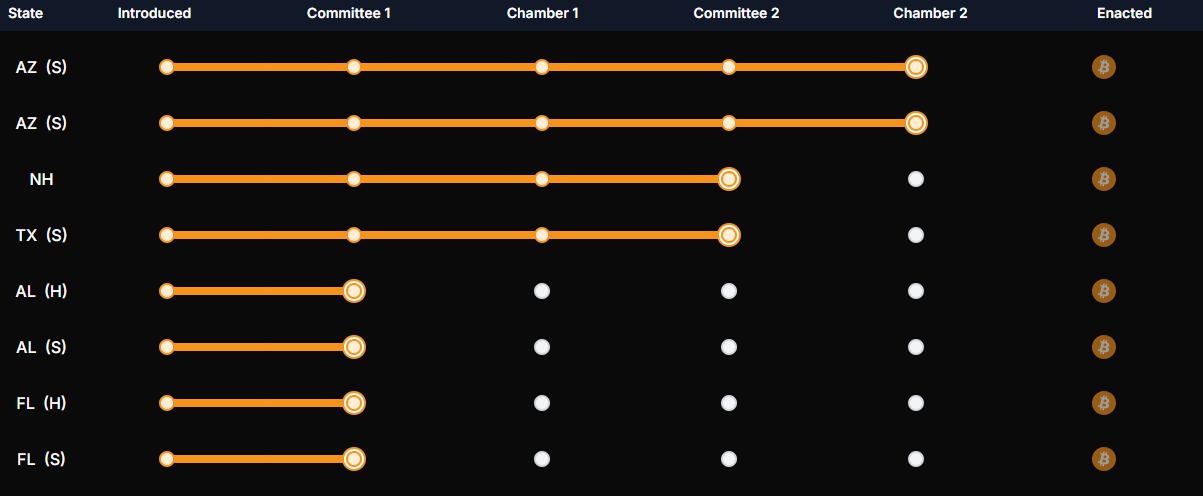
Arizona’s State Legislature just passed Bitcoin reserve bills SB1025 and SB1373. They now approach the final hurdle: the governor’s approval to become law.
Both bills won by comfortable margins and will only require the governor’s signature to become law. Governor Katie Hobbs recently ended a vow to veto all bills over a funding dispute, hopefully securing the Reserve’s future.
“Arizona passes second Bitcoin Reserve bill. SB 1373 passed 37-19! Both Reserve bills to Governor Hobbs’ desk for signature,” a crypto-related policy watchdog claimed.
According to SB1025’s text, it will enable Arizona to spend up to 10% of its public funds on Bitcoin or other unspecified digital assets. This funding requirement mirrors South Carolina’s bill, which also mandated a 10% maximum.
Now that SB1025 has passed a third reading, Governor Hobbs is the only thing separating Arizona from a Bitcoin Reserve.
Recently, she has been vetoing all proposed legislation in a bid to secure funding for Arizona’s Division of Developmental Disabilities. Less than a week ago, she ended this standoff, hopefully allowing her to sign these bills into law.
Arizona’s spending cap may deflate some Bitcoin enthusiasts’ hopes, but it’s still a victory. Amidst the microeconomic challenges, it’s a win for the industry if state-level acquisitions of any size pass.
ARIZONA JUST BECAME THE FIRST STATE IN THE NATION TO PASS STRATEGIC BITCOIN RESERVE LEGISLATION IN THE HOUSE AND SENATE.
Meanwhile, Trump’s Strategic Crypto Reserve intends to preserve an existing stockpile but doesn’t acquire BTC. Nonetheless, it’s a bullish development that helped build market enthusiasm.
If Arizona does pass the bill, it will likely increase Bitcoin’s demand and drive more bullish optimism. New Hampshire and Texas are also trailing Arizona’s lead, as both states are awaiting a Senate vote on their bills.
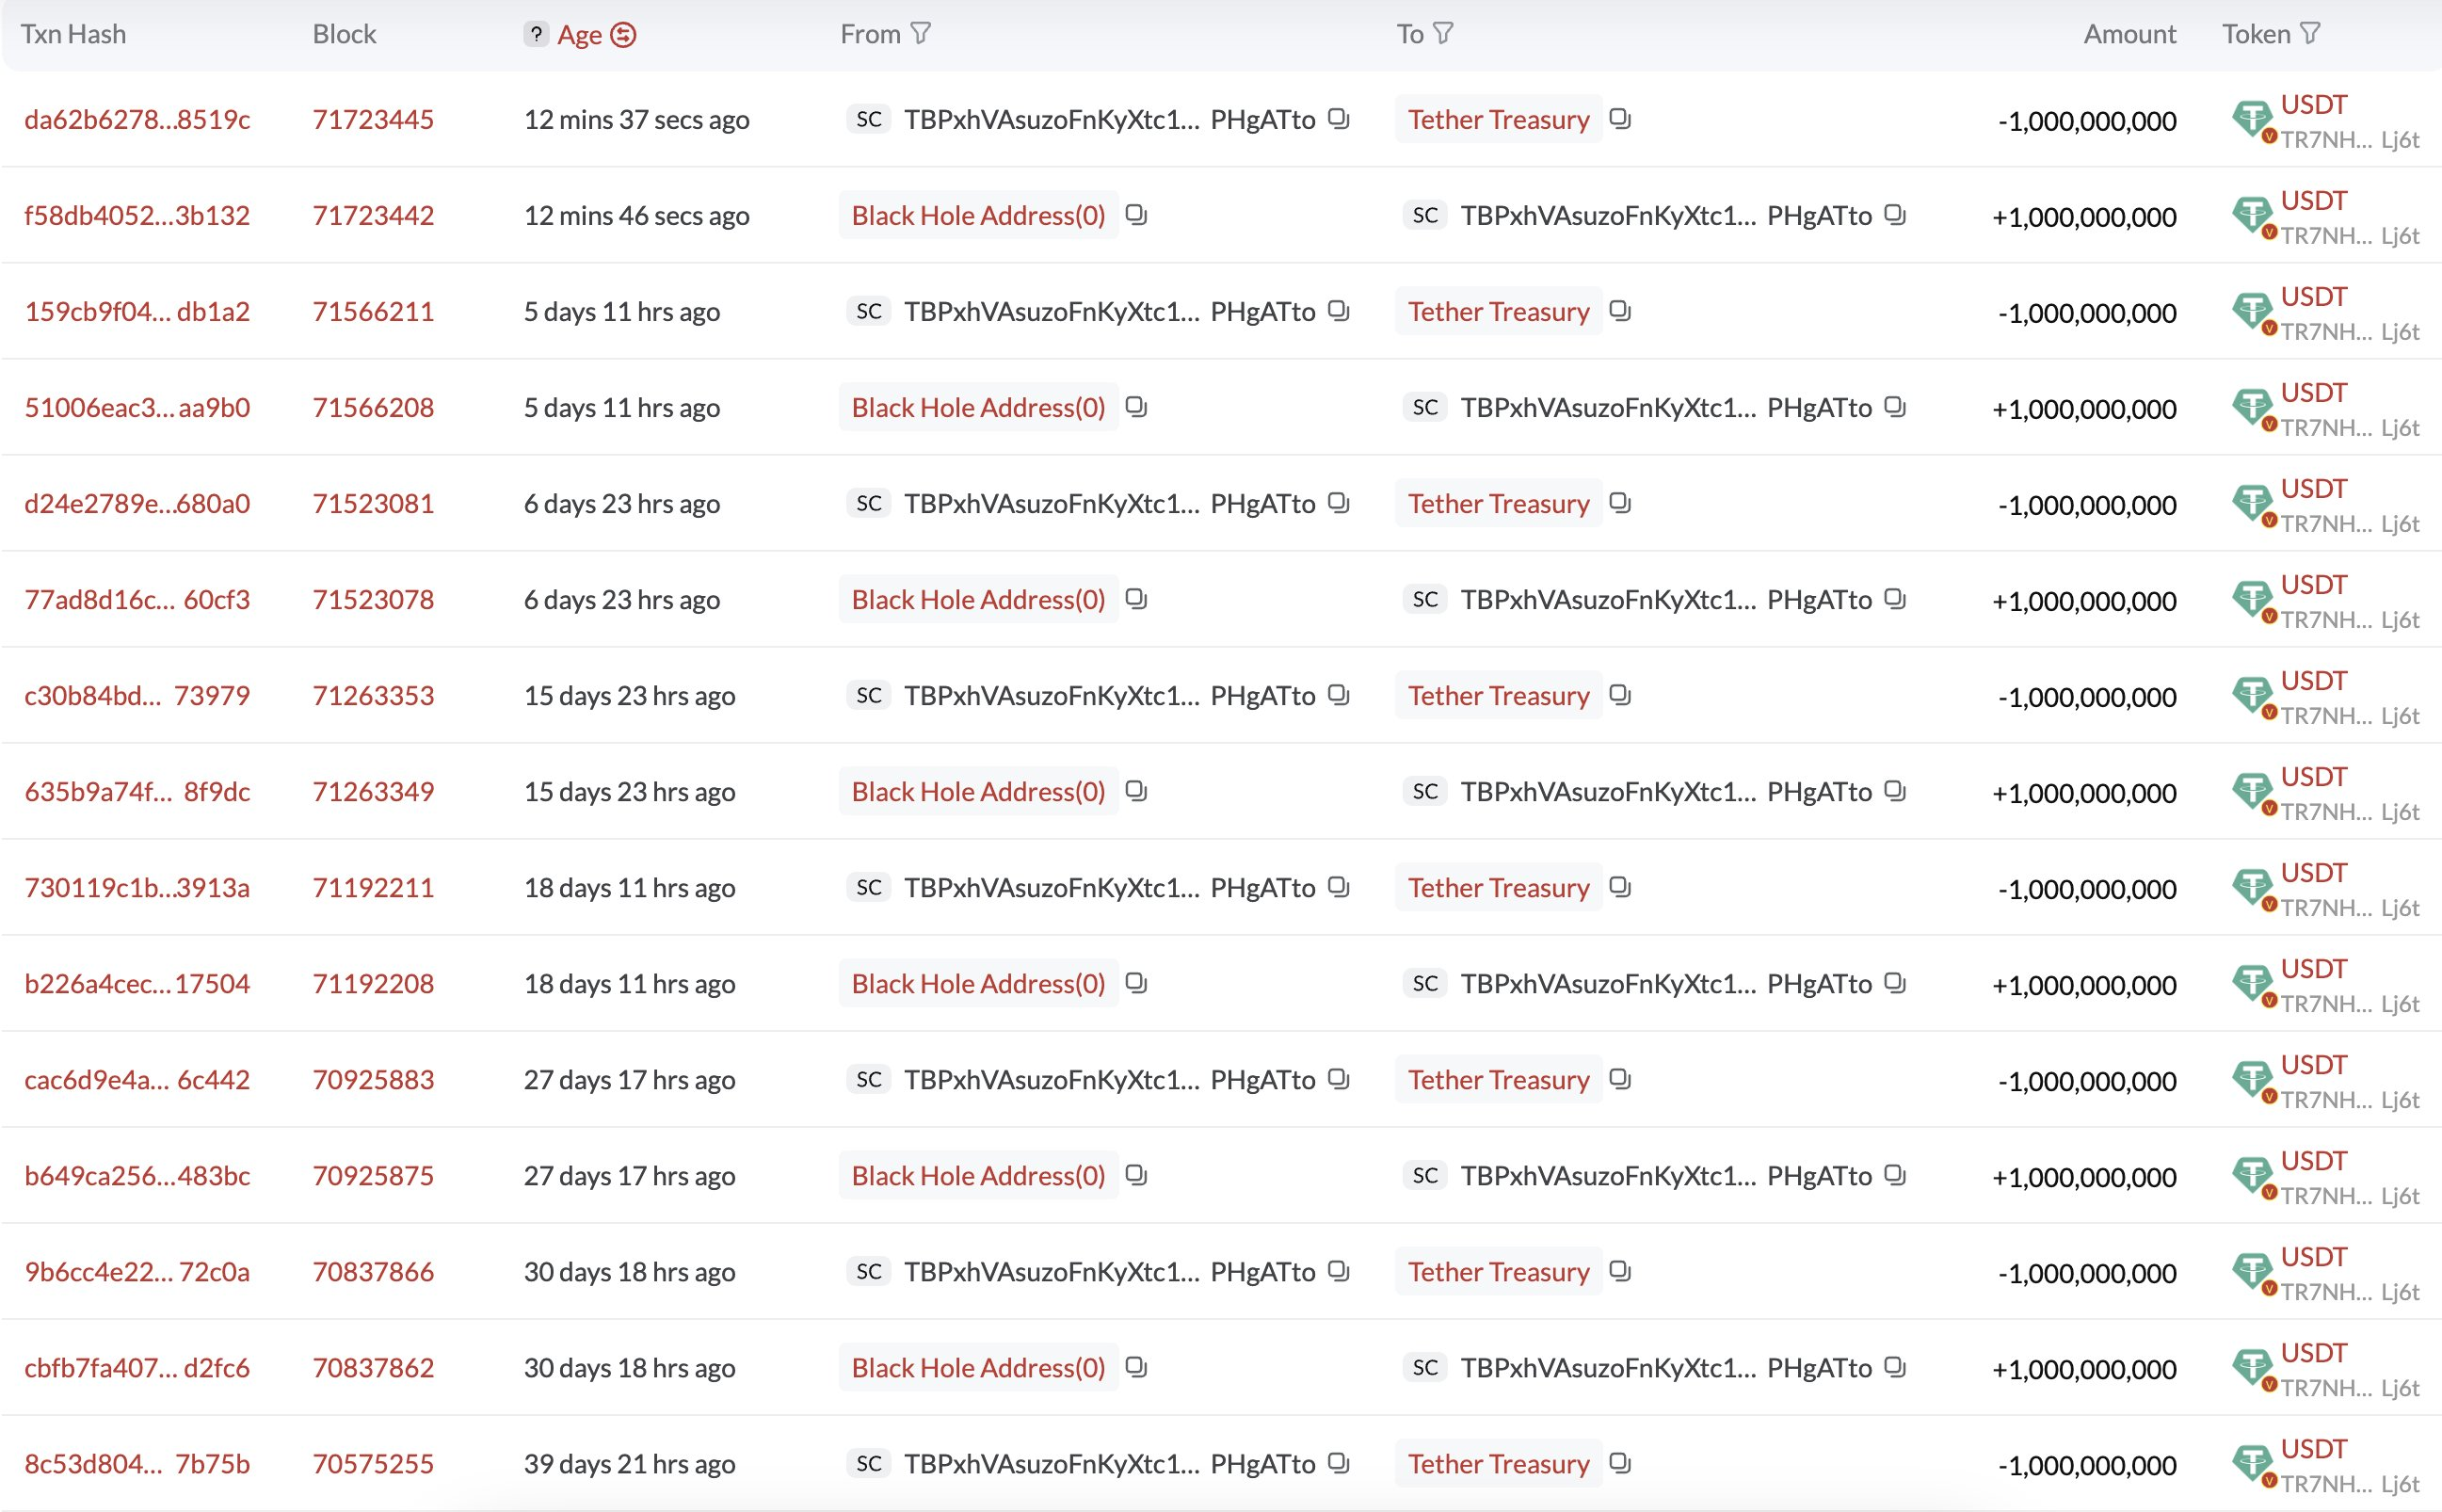
Tether minted $1 billion in USDT on the Tron network today, bringing its total minted tokens since January to 12 billion. This reflects growing demand for crypto and could signal bullishness.
Previously, major stablecoin issuances have led to a bullish cycle. With fresh inflows, the market sentiment is trending towards Greed, and Tether may facilitate more bullishness.
This new USDT minting could have broad market implications for a few reasons. Major net issuances often reflect growing demand from institutions and OTC desks that need large blocks of stablecoins for cross-border settlements or build-up before buying digital assets.
In isolation, this single issuance could push the needle in a bullish direction. However, since Lookonchain data shows a pattern of major mintings, Tether could spur a lot of optimism.
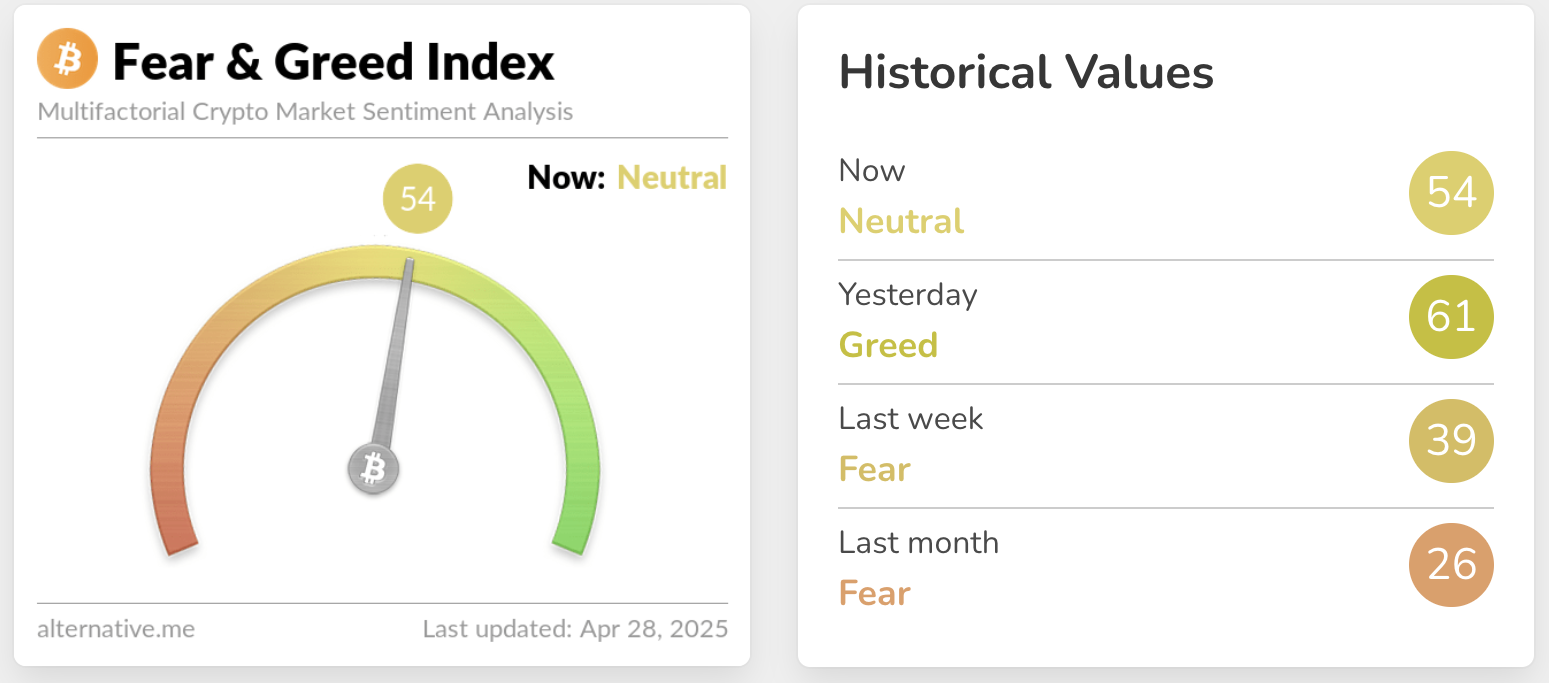
Despite recently hitting a three-year low, the Crypto Fear and Greed Index has been trending upward. It’s currently in Neutral but briefly exhibited Greed yesterday.
In other words, the market is primed to accept a bullish signal, and Tether’s major minting may provide it.
Still, not every mint equates to immediate market deployment. True bullish pressure arrives only when those new USDT hit exchange wallets. Luckily, that seems like a very achievable goal.
Three Bittensor subnet tokens — Chutes, Proprietary Trading Network, and Targon — are among the top projects to watch this week.
Chutes remains the largest subnet token by market cap despite recent price pressure, while Proprietary Trading Network is gaining attention through the DeFAI narrative. Targon, meanwhile, is trading at deeply oversold levels and could be setting up for a potential rebound. Here’s a closer look at each of these Bittensor-based tokens heading into the first week of May.
Chutes
Chutes is a serverless AI compute platform built by Rayon Labs. It is designed to deploy, run, and scale any artificial intelligence model within seconds.
Users can interact directly with the Chutes platform or integrate it easily through a simple API, offering fast and flexible AI infrastructure without the complexity of traditional server management.
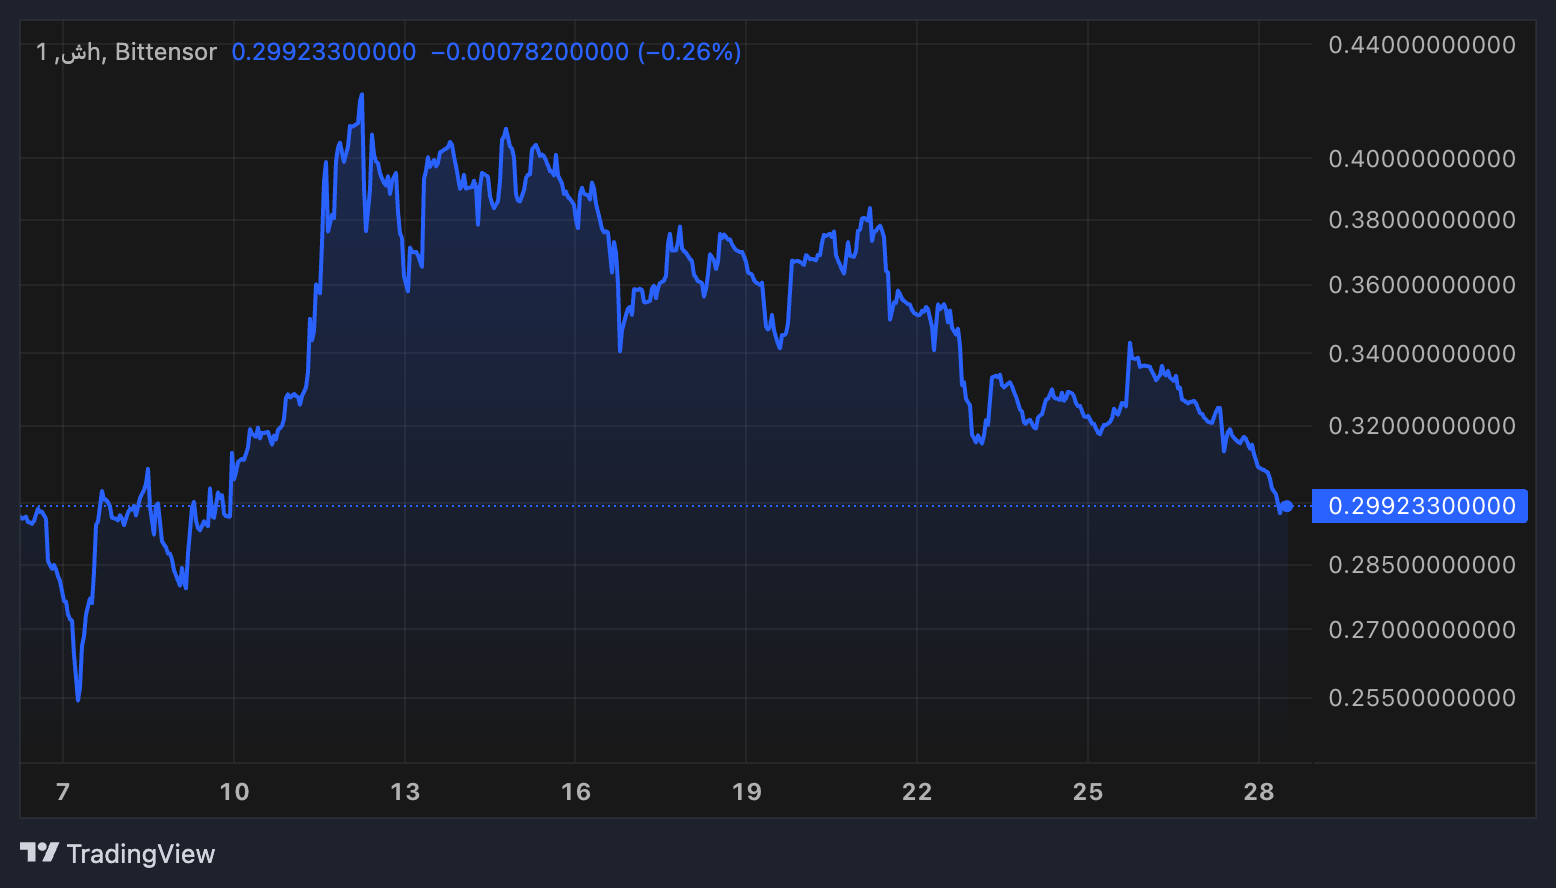
Chutes is currently the largest Bittensor Subnet token by market cap, but it has faced pressure recently, falling nearly 18% over the past seven days.
After rallying 67% between April 7 and April 12, the token has since dropped about 30% from its peak. Its Relative Strength Index (RSI) is now at 23.78, signaling deeply oversold conditions.
This setup could mean that Chutes is nearing a potential reversal zone.
If the project manages to recover its earlier momentum, being the biggest Subnet on Bittensor could amplify its gains through network effects, potentially triggering a strong uptrend that could drive the price back toward the $0.40 range.
Proprietary Trading Network
Proprietary Trading Network, or Taoshi, is a decentralized finance platform operating within the Bittensor ecosystem. It builds dynamic subnetworks where decentralized AI and machine learning models analyze data across multiple asset classes.
Its mission is democratizing access to sophisticated trading strategies, combining AI, blockchain, and finance to deliver advanced data that helps users make more informed financial decisions.
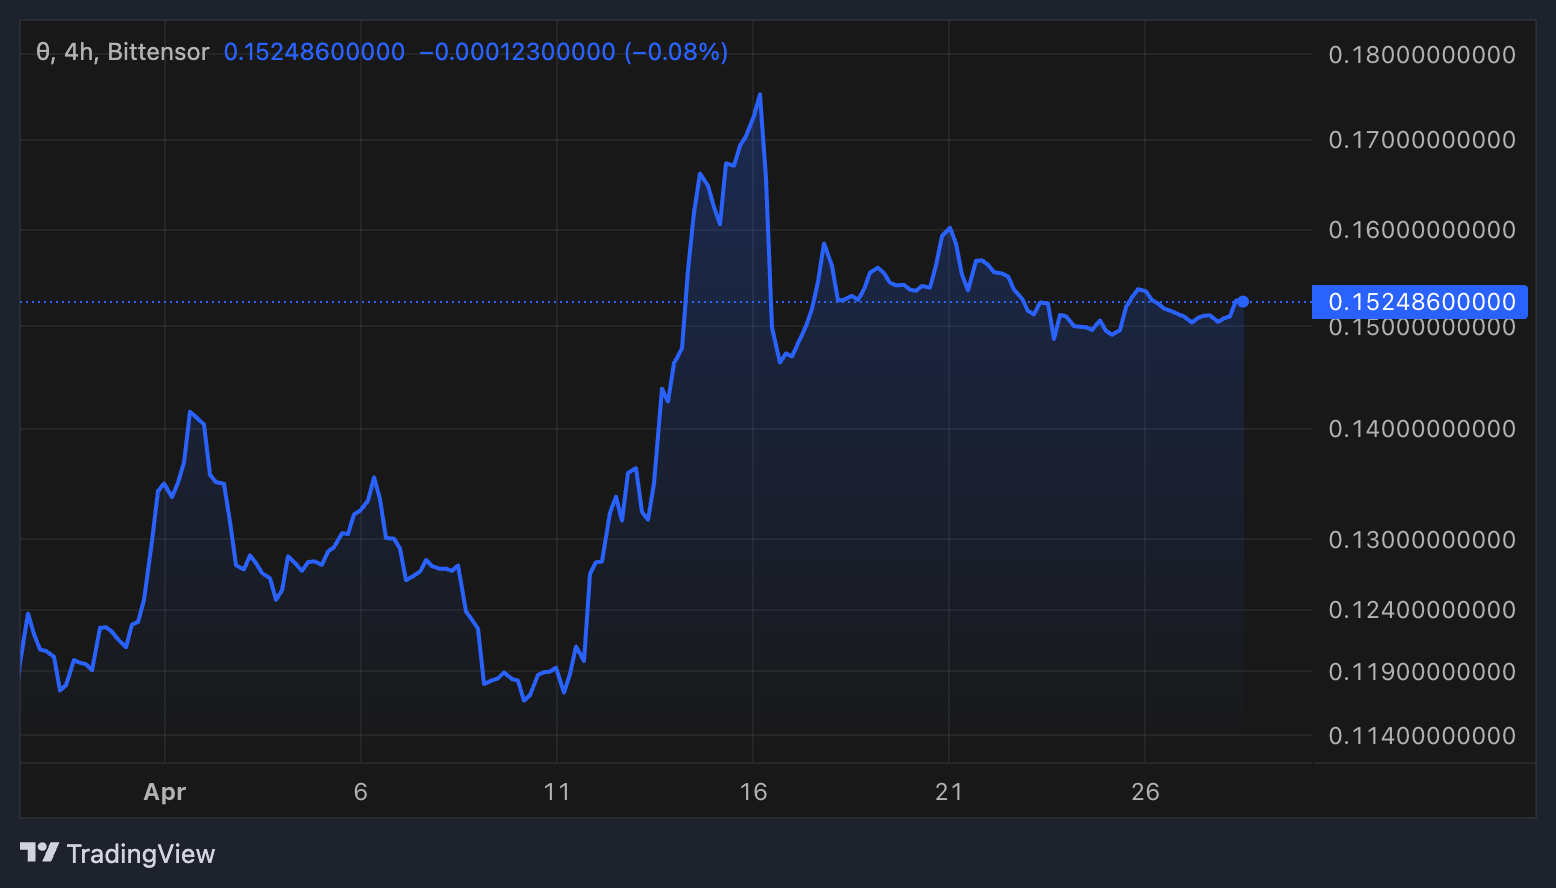
Proprietary Trading Network’s market cap is close to $50 million, with its trading volume jumping nearly 160% in the last 24 hours to reach $3 million.
Proprietary Trading Network Token Performance. Source: Tao Stats.
If the current momentum strengthens, the token could soon rise to retest the $0.20 and $0.25 resistance levels, supported by growing attention across these sectors.
Targon
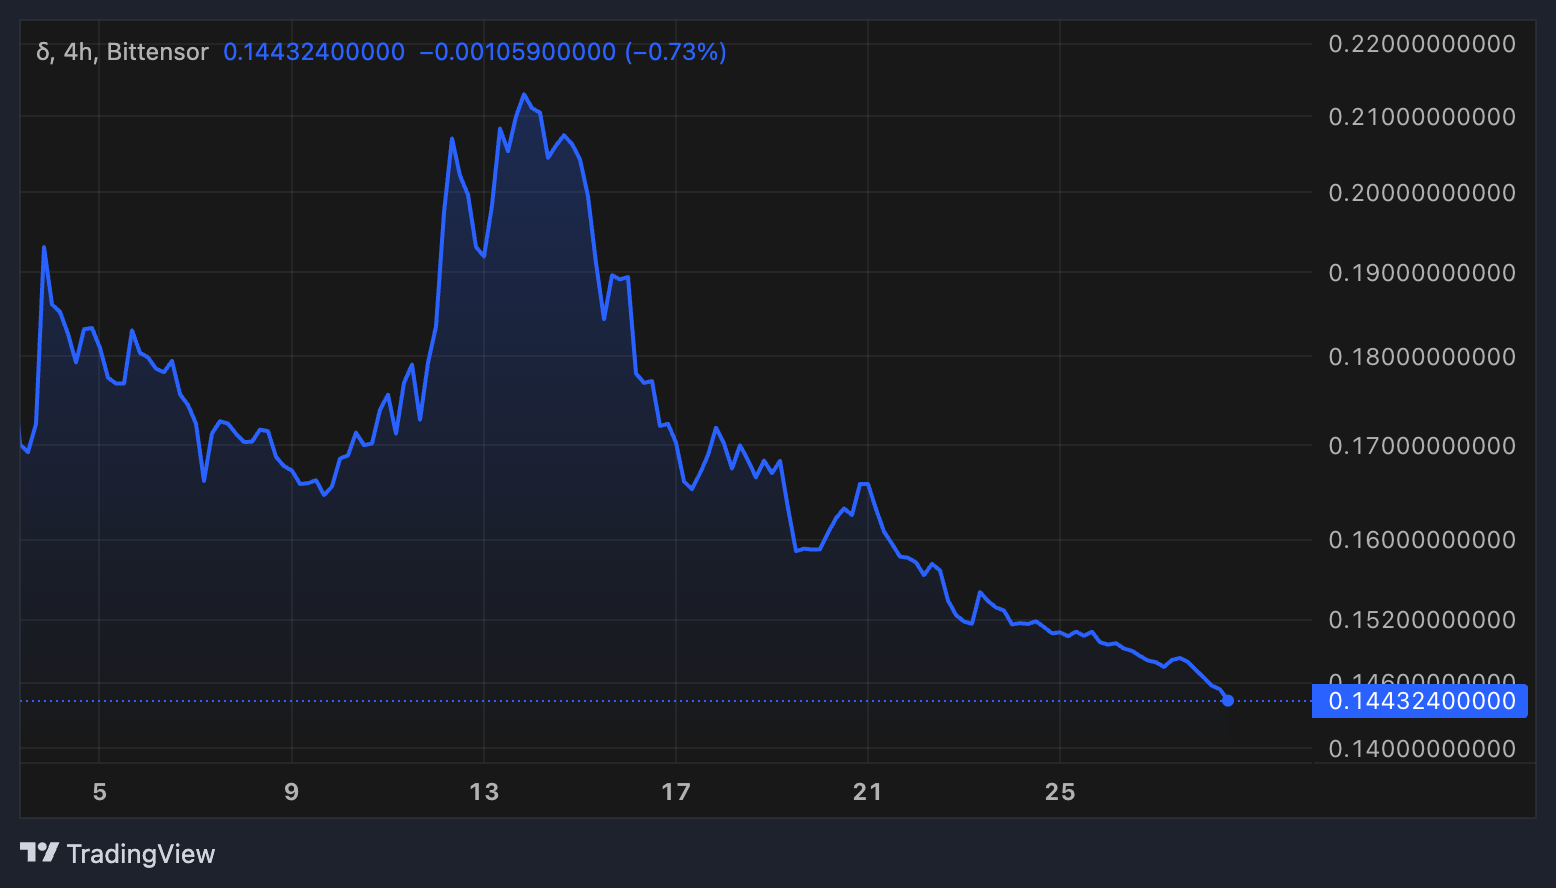
Manifold Labs developed Targon, which is a Bittensor Subnet token that is building an AI cloud platform that enables users to run inferences on AI models at high speed and low cost.
Through its Playground and API, Targon offers many models optimized for completion and chat tasks.
The platform emphasizes fast performance, high scalability, and cost-efficiency, allowing developers and companies to deploy and scale AI models while minimizing infrastructure complexity easily.
Onyxcoin (XCN) has risen more than 3% in the last 24 hours and nearly 12% over the past week, bringing its market cap back to around $640 million.
After a volatile week, XCN’s technical indicators show important shifts that could shape its next move. The token’s RSI, ADX, and EMA structures all suggest a mix of stabilizing momentum and caution signs. Here’s a closer look at the current setup for Onyxcoin heading into the first week of May.
Onyxcoin RSI Bounces Back, Setting Neutral Stage for Next Move
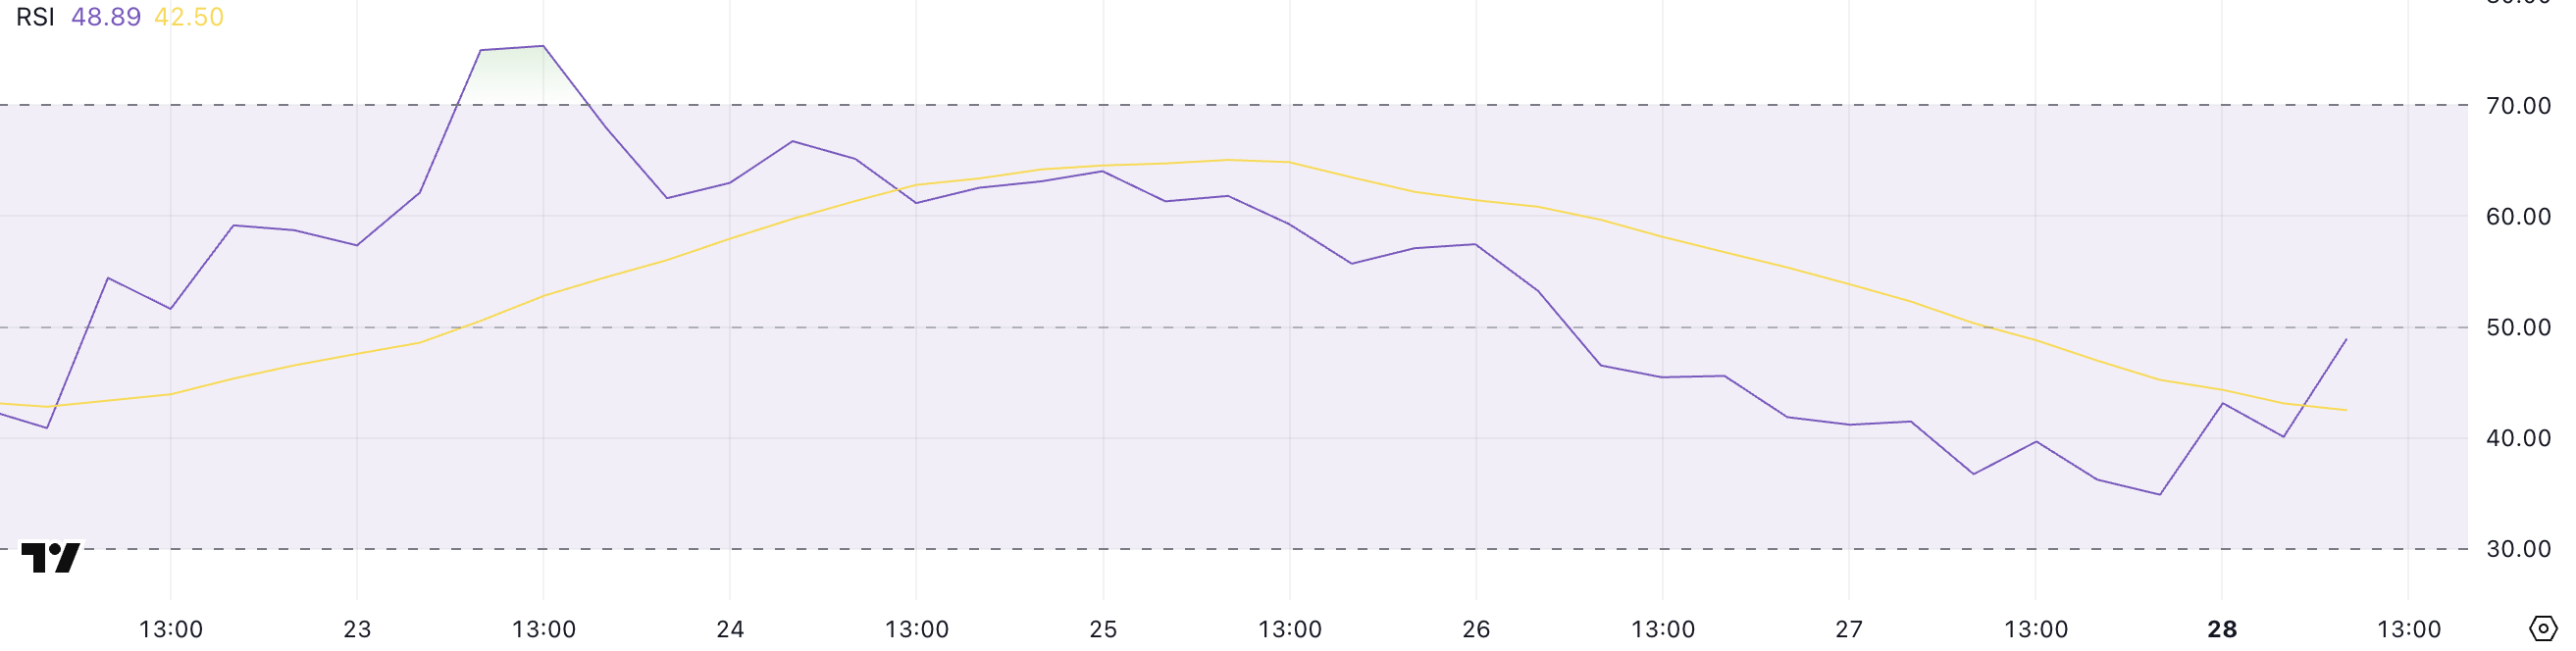
Onyxcoin’s Relative Strength Index (RSI) is currently at 48.89, after reaching as high as 75 just five days ago. The RSI had fallen sharply to 34.88 yesterday but has since recovered, suggesting that selling pressure may be easing.
This recent bounce shows momentum is trying to stabilize, although the token remains well below the recent overbought zone it touched earlier in the week.
The RSI is a widely used technical indicator that measures the speed and magnitude of an asset’s recent price movements to assess whether it is overbought or oversold.
Typically, an RSI above 70 indicates overbought conditions and potential for a pullback, while an RSI below 30 signals oversold conditions and potential for a rebound.
With XCN’s RSI now sitting at 48.89, the token is in a neutral zone, providing room for further upside if positive momentum continues. If buying pressure increases from here, XCN could build a stronger recovery without immediately facing technical resistance from overbought conditions.
XCN Uptrend Remains, But Trend Strength Weakens
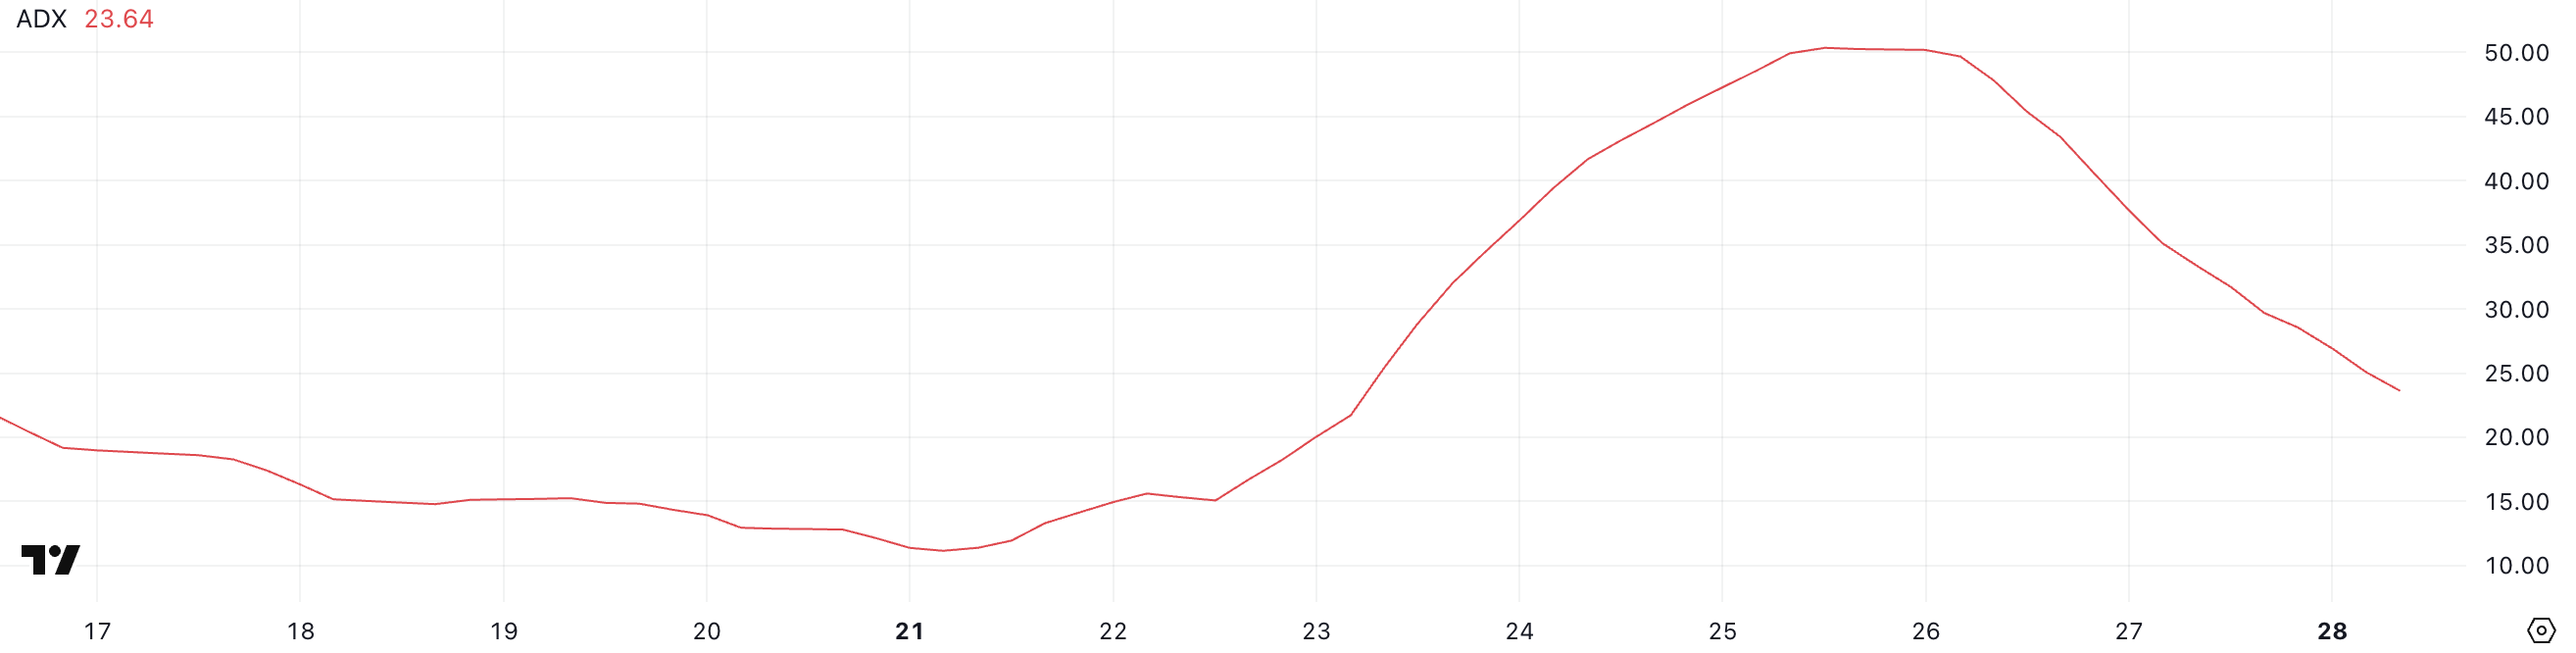
Onyxcoin Average Directional Index (ADX) is currently at 23.64, a significant drop from the 50 level it reached just two days ago.
The decline in ADX reflects a cooling in momentum after a strong directional move earlier in the week. While the uptrend is still intact, the lower ADX reading signals that the trend’s strength is no longer as dominant as it was a few days ago.
The ADX is a technical indicator that measures a trend’s strength, but not the direction. Values above 25 typically suggest a strong trend, while values below 20 point to a weak or directionless market.
With XCN’s ADX now sitting at 23.64, the trend is still moderately strong but close to losing strength if the reading continues to fall.
This means that while Onyxcoin’s uptrend remains, it may require renewed buying pressure soon to avoid slipping into a period of consolidation or sideways movement.
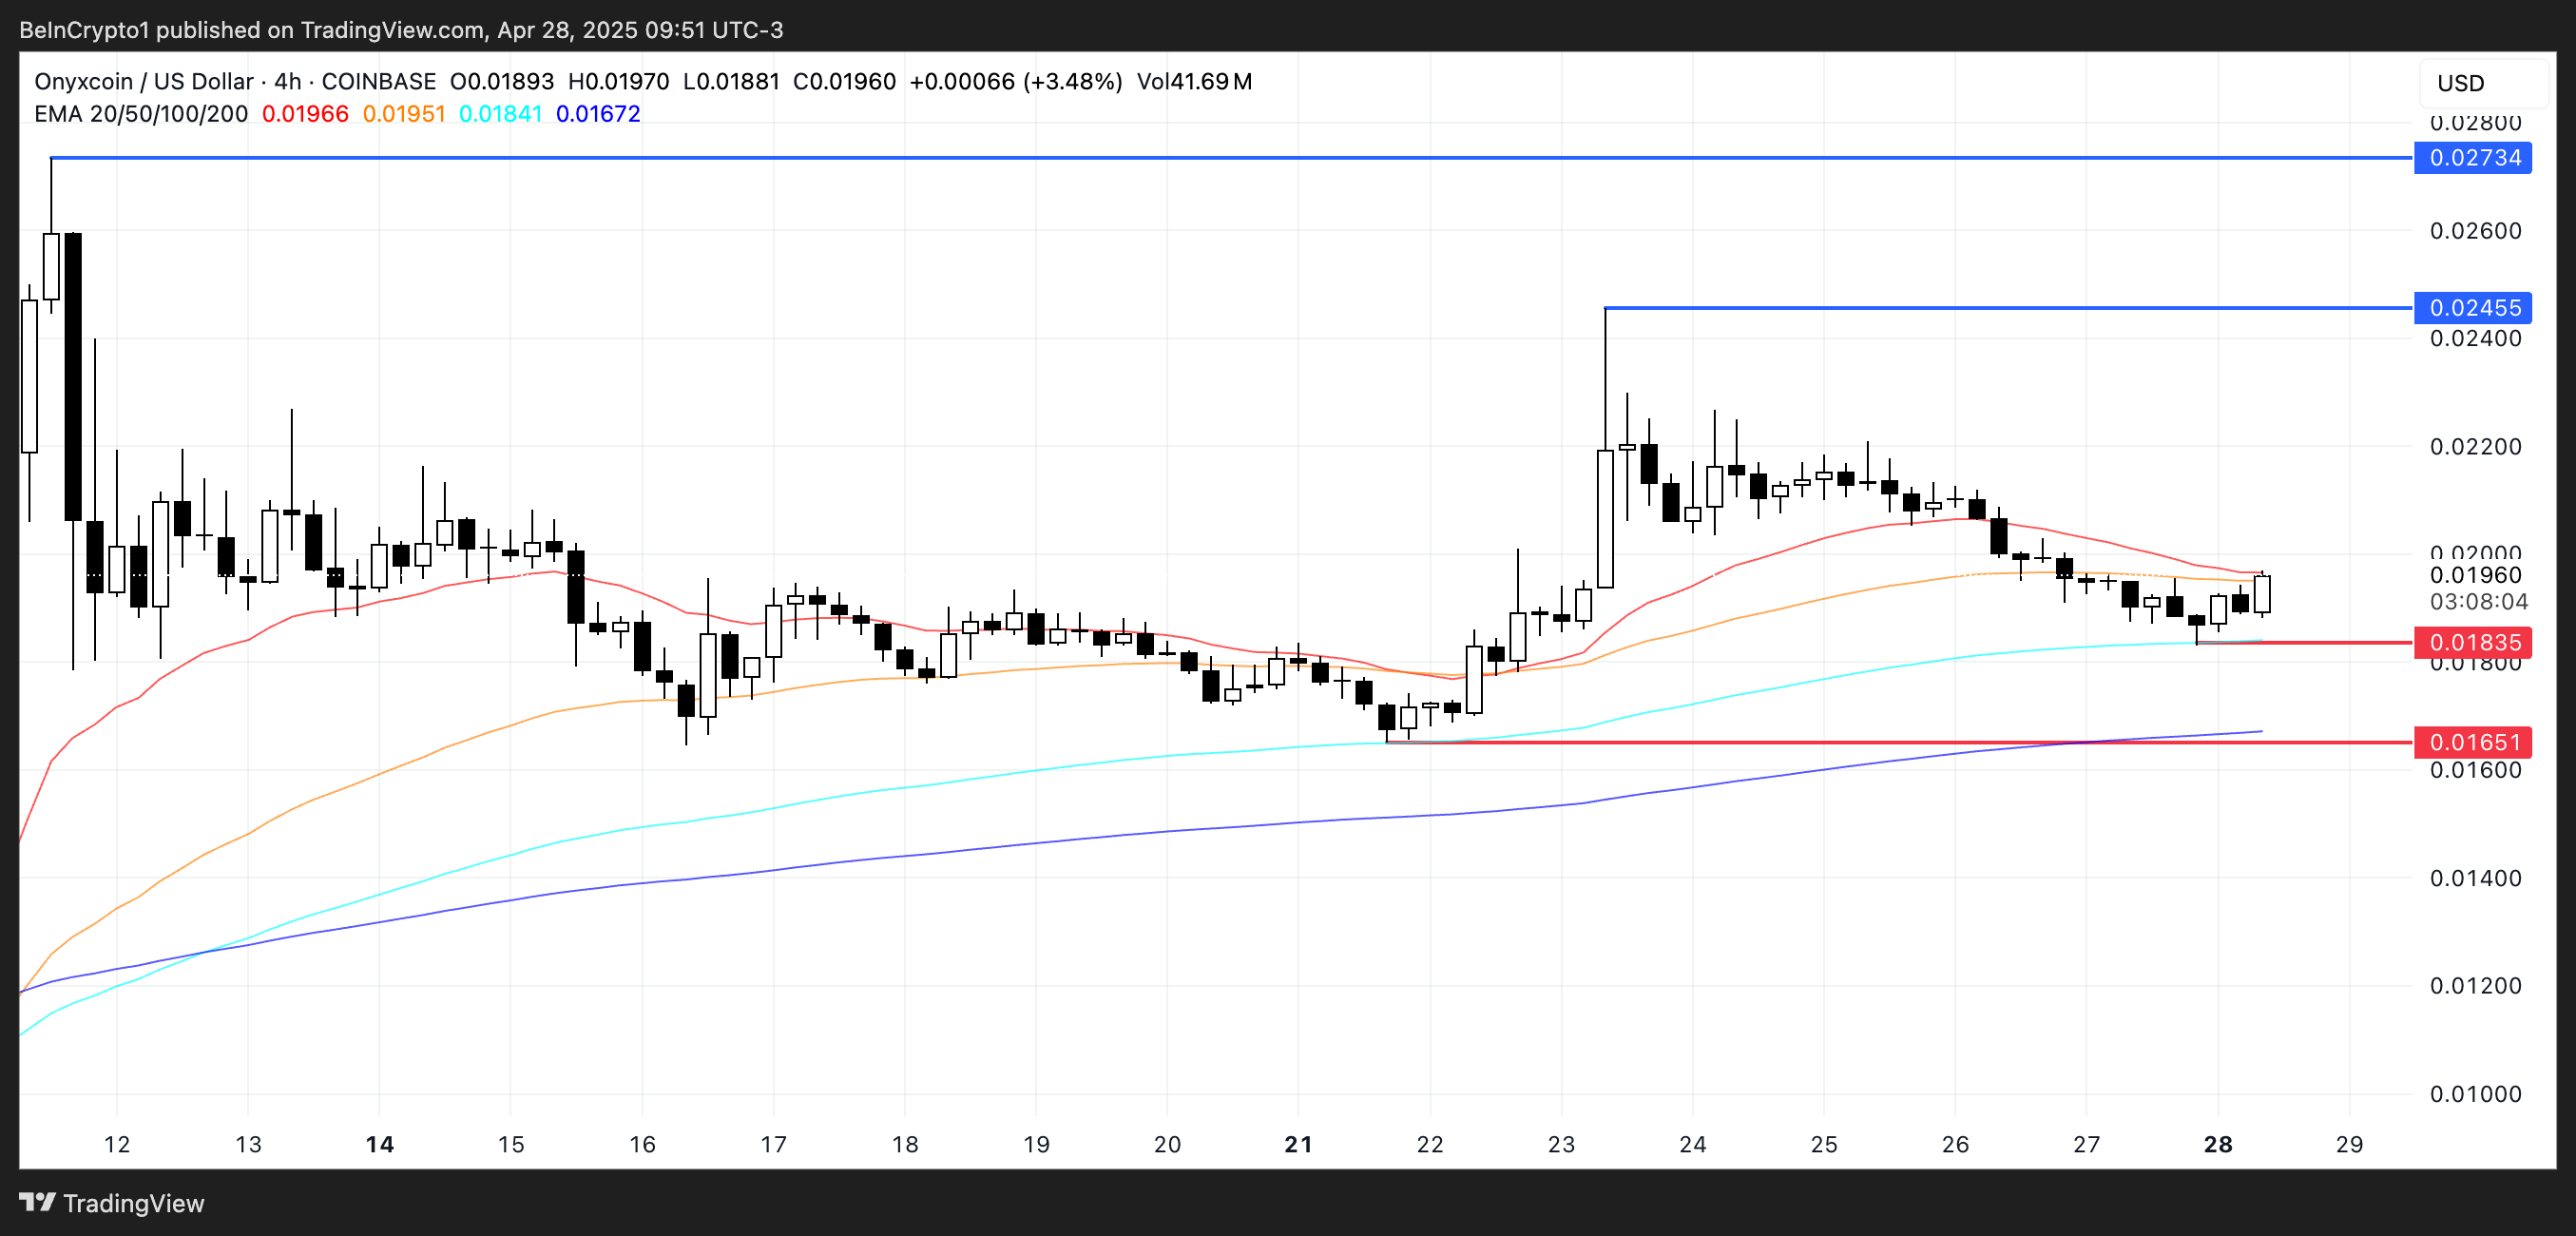
Onyxcoin Holds Support, But EMA Gap Signals Caution
XCN gained around 112% in April, making it one of the best-performing altcoins for the month. Its Exponential Moving Average (EMA) lines remain bullish, with the short-term EMAs still positioned above the long-term ones.
However, the gap between the short-term and long-term EMAs has narrowed compared to previous days, indicating that the bullish momentum is losing some strength.
While the general trend remains positive, the shrinking distance between the EMAs suggests that the market is approaching a critical point where a clearer direction could soon emerge.
If XCN tests this support again and fails to hold it, the price could drop toward the next support near $0.016. On the upside, if buying momentum returns, XCN could rally to test the $0.024 resistance.
A breakout above $0.024 could open the door for a continuation toward $0.027, offering a strong bullish setup if momentum strengthens.
Despite rumors that the SEC approved a spot XRP ETF, this is inaccurate. The only new development concerns ProShares’ Leveraged and Short XRP Futures ETFs, which will begin trading on April 30.
It’s unclear how much these false claims impacted XRP’s price today, but they caused a lot of commotion. Fake crypto news has been taking off lately, and this could negatively impact investor confidence.
However, there’s no shortage of overeager people who can spark and circulate optimistic rumors. ProShares’ new Futures ETF did indeed win approval, but this has no bearing on a Spot ETF:
UPDATE: a lot people posting/reporting that @ProShares will be launching XRP ETFs on April 30th. We’ve confirmed that’s not the case. We don’t have a confirmed launch date yet but we believe they will launch — and likely launch in the short or possibly medium term.
Bitcoin, the first crypto-centric ETF category, achieved a futures ETF before a spot one. In some ways, the SEC’s approval of an XRP Futures ETF is a positive sign.
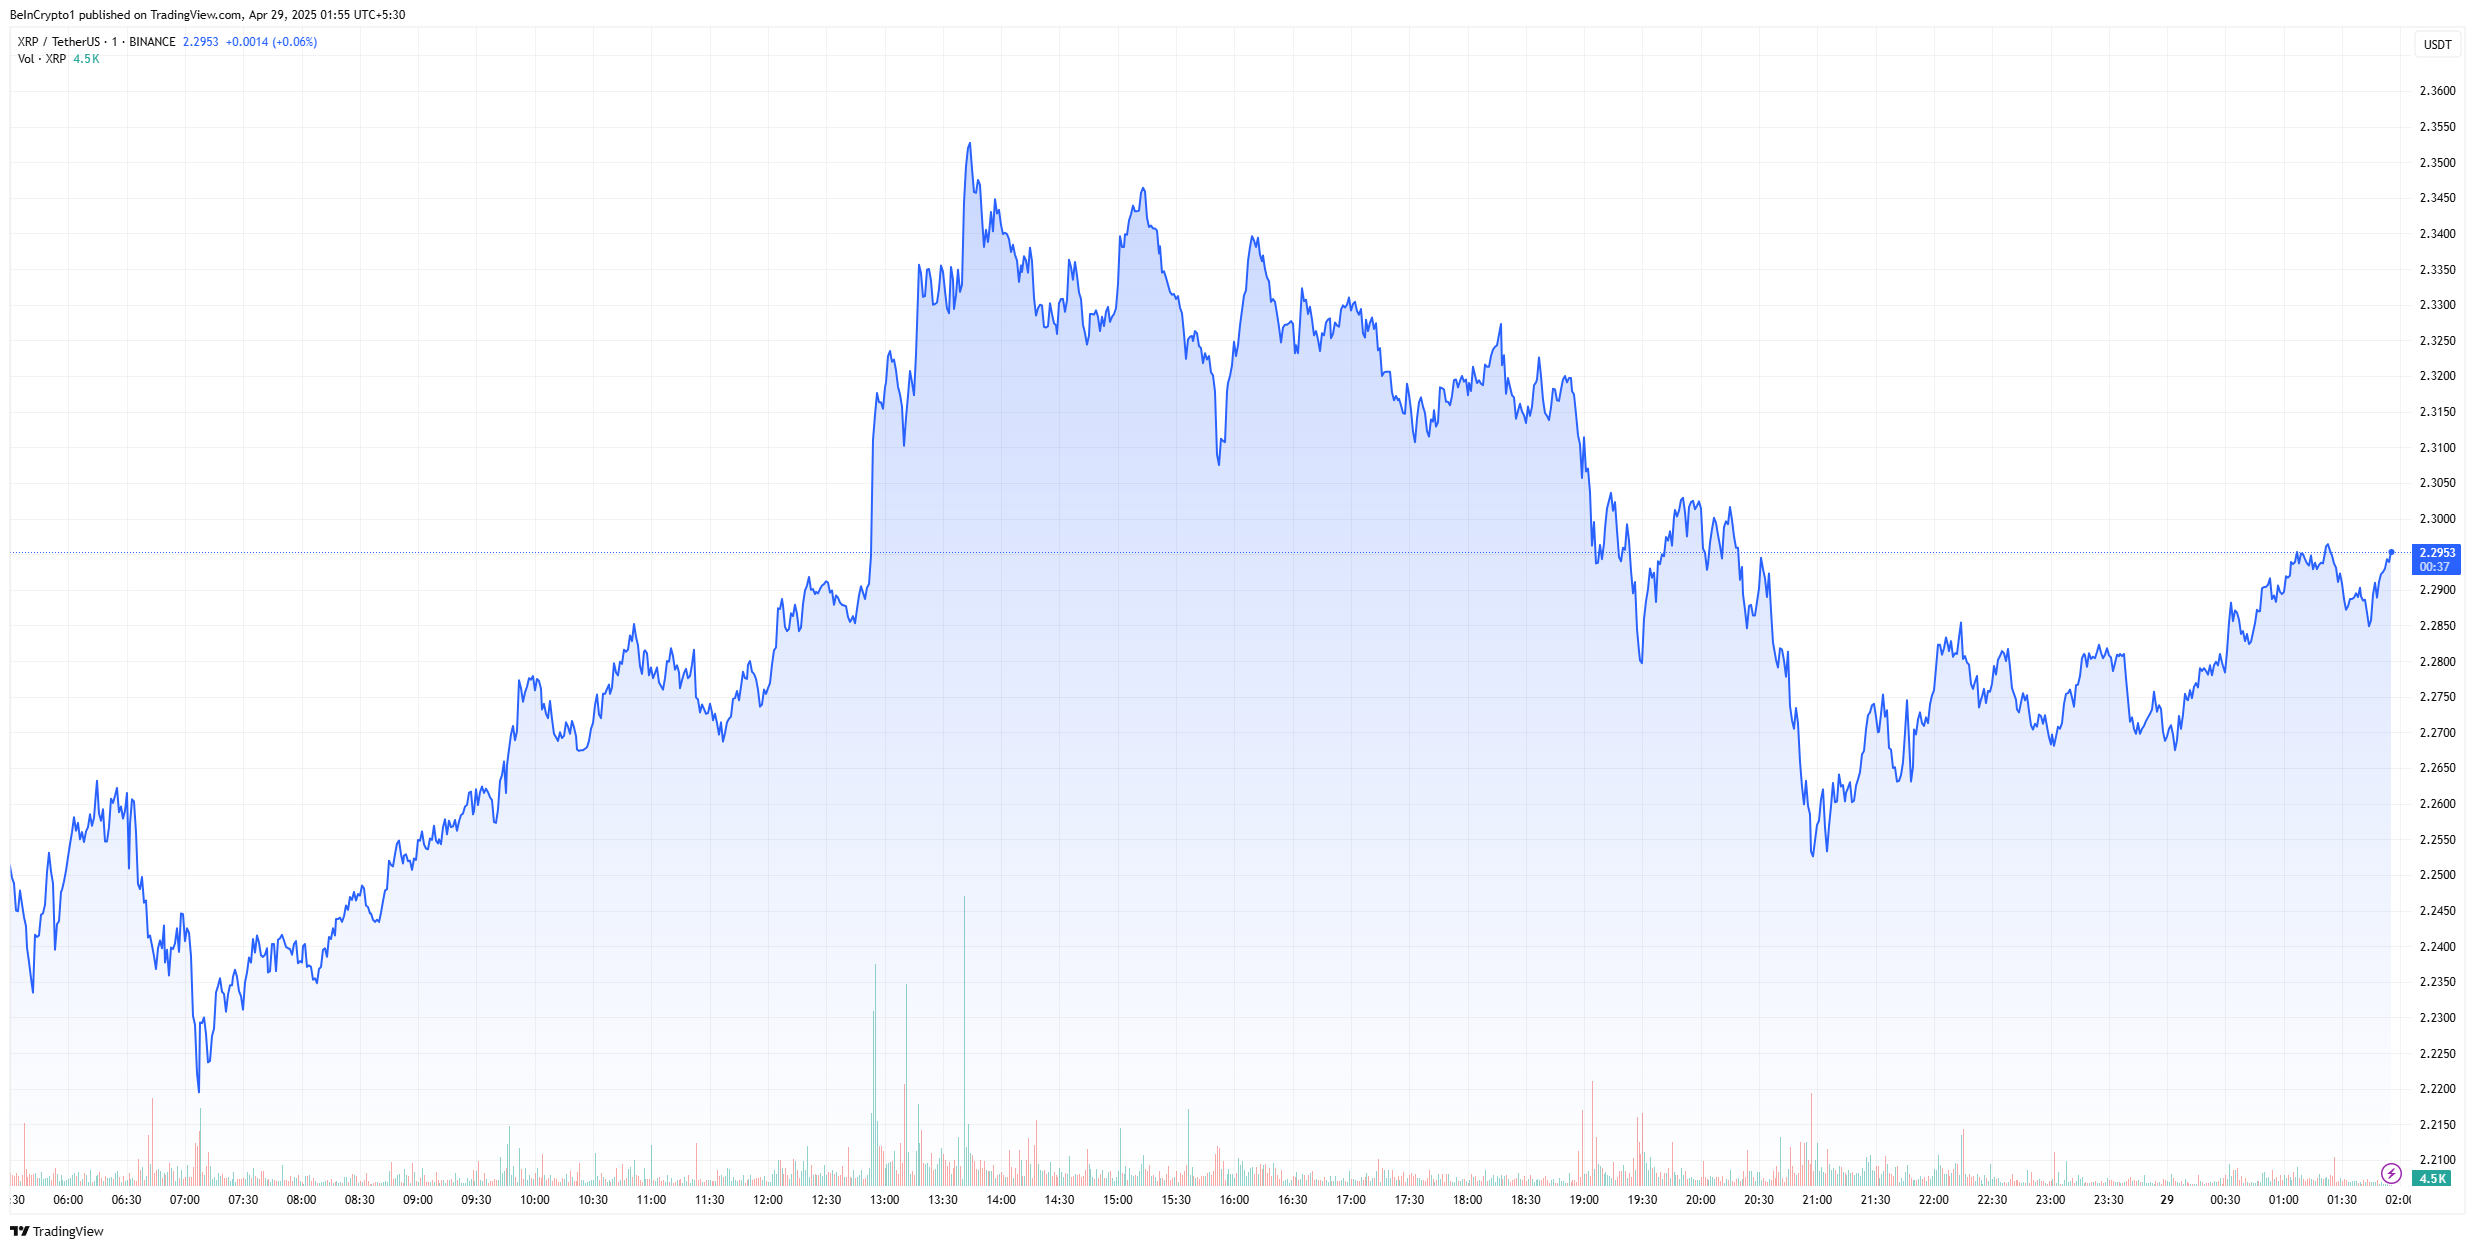
XRP’s price has been zig-zagging in the last 24 hours, with notable pullbacks. It isn’t fair to claim that ETF hype is the source of all XRP moves; several circumstances may be contributing to the situation.
Confusion doesn’t help build a stable industry. Even if false ETF rumors temporarily boost XRP’s performance, that’s not a sign of long-term ecosystem health. Misinformation can significantly damage public trust, especially among retail investors.
For example, Eleanor Terrett commented on these rumors, claiming she’s “getting really sick of all the rude keyboard warriors in this community.”
Apparently, she received online hostility for trying to clarify the news decision despite being both correct and a respected source of pro-crypto journalistic coverage.
Spot ETF vs Futures ETF – What are the Differences?
Spot ETFs directly hold XRP tokens, providing investors with exposure to the actual cryptocurrency. These ETFs aim to mirror the real-time market price of XRP. So, there’s a straightforward correlation between the fund’s value and the token’s spot price.
As of now, spot XRP ETFs are not approved in the US. Applications from firms like Grayscale and Bitwise are under SEC review.
Meanwhile, leveraged futures ETFs do not hold XRP directly. Instead, they invest in futures contracts that speculate on the future price of XRP.
Due to daily resetting of leverage, these ETFs can experience significant volatility and may not be suitable for long-term holding.
Even if these XRP ETF rumors came from a genuine misunderstanding, they’re still dangerous. In the future, the community must be careful to vet its sources and act in good faith to maintain public confidence.
Solana (SOL) has been up nearly 18% over the last 30 days. SOL’s bullish structure remains technically intact, although some key momentum indicators show signs of weakening.
At the same time, Solana continues to dominate DEX volume and blockchain revenue rankings, reinforcing its strong position in the broader ecosystem. Here’s a closer look at the latest technical and on-chain developments for Solana.
Bullish Structure Intact for Solana, But Key Momentum Signals Weaken
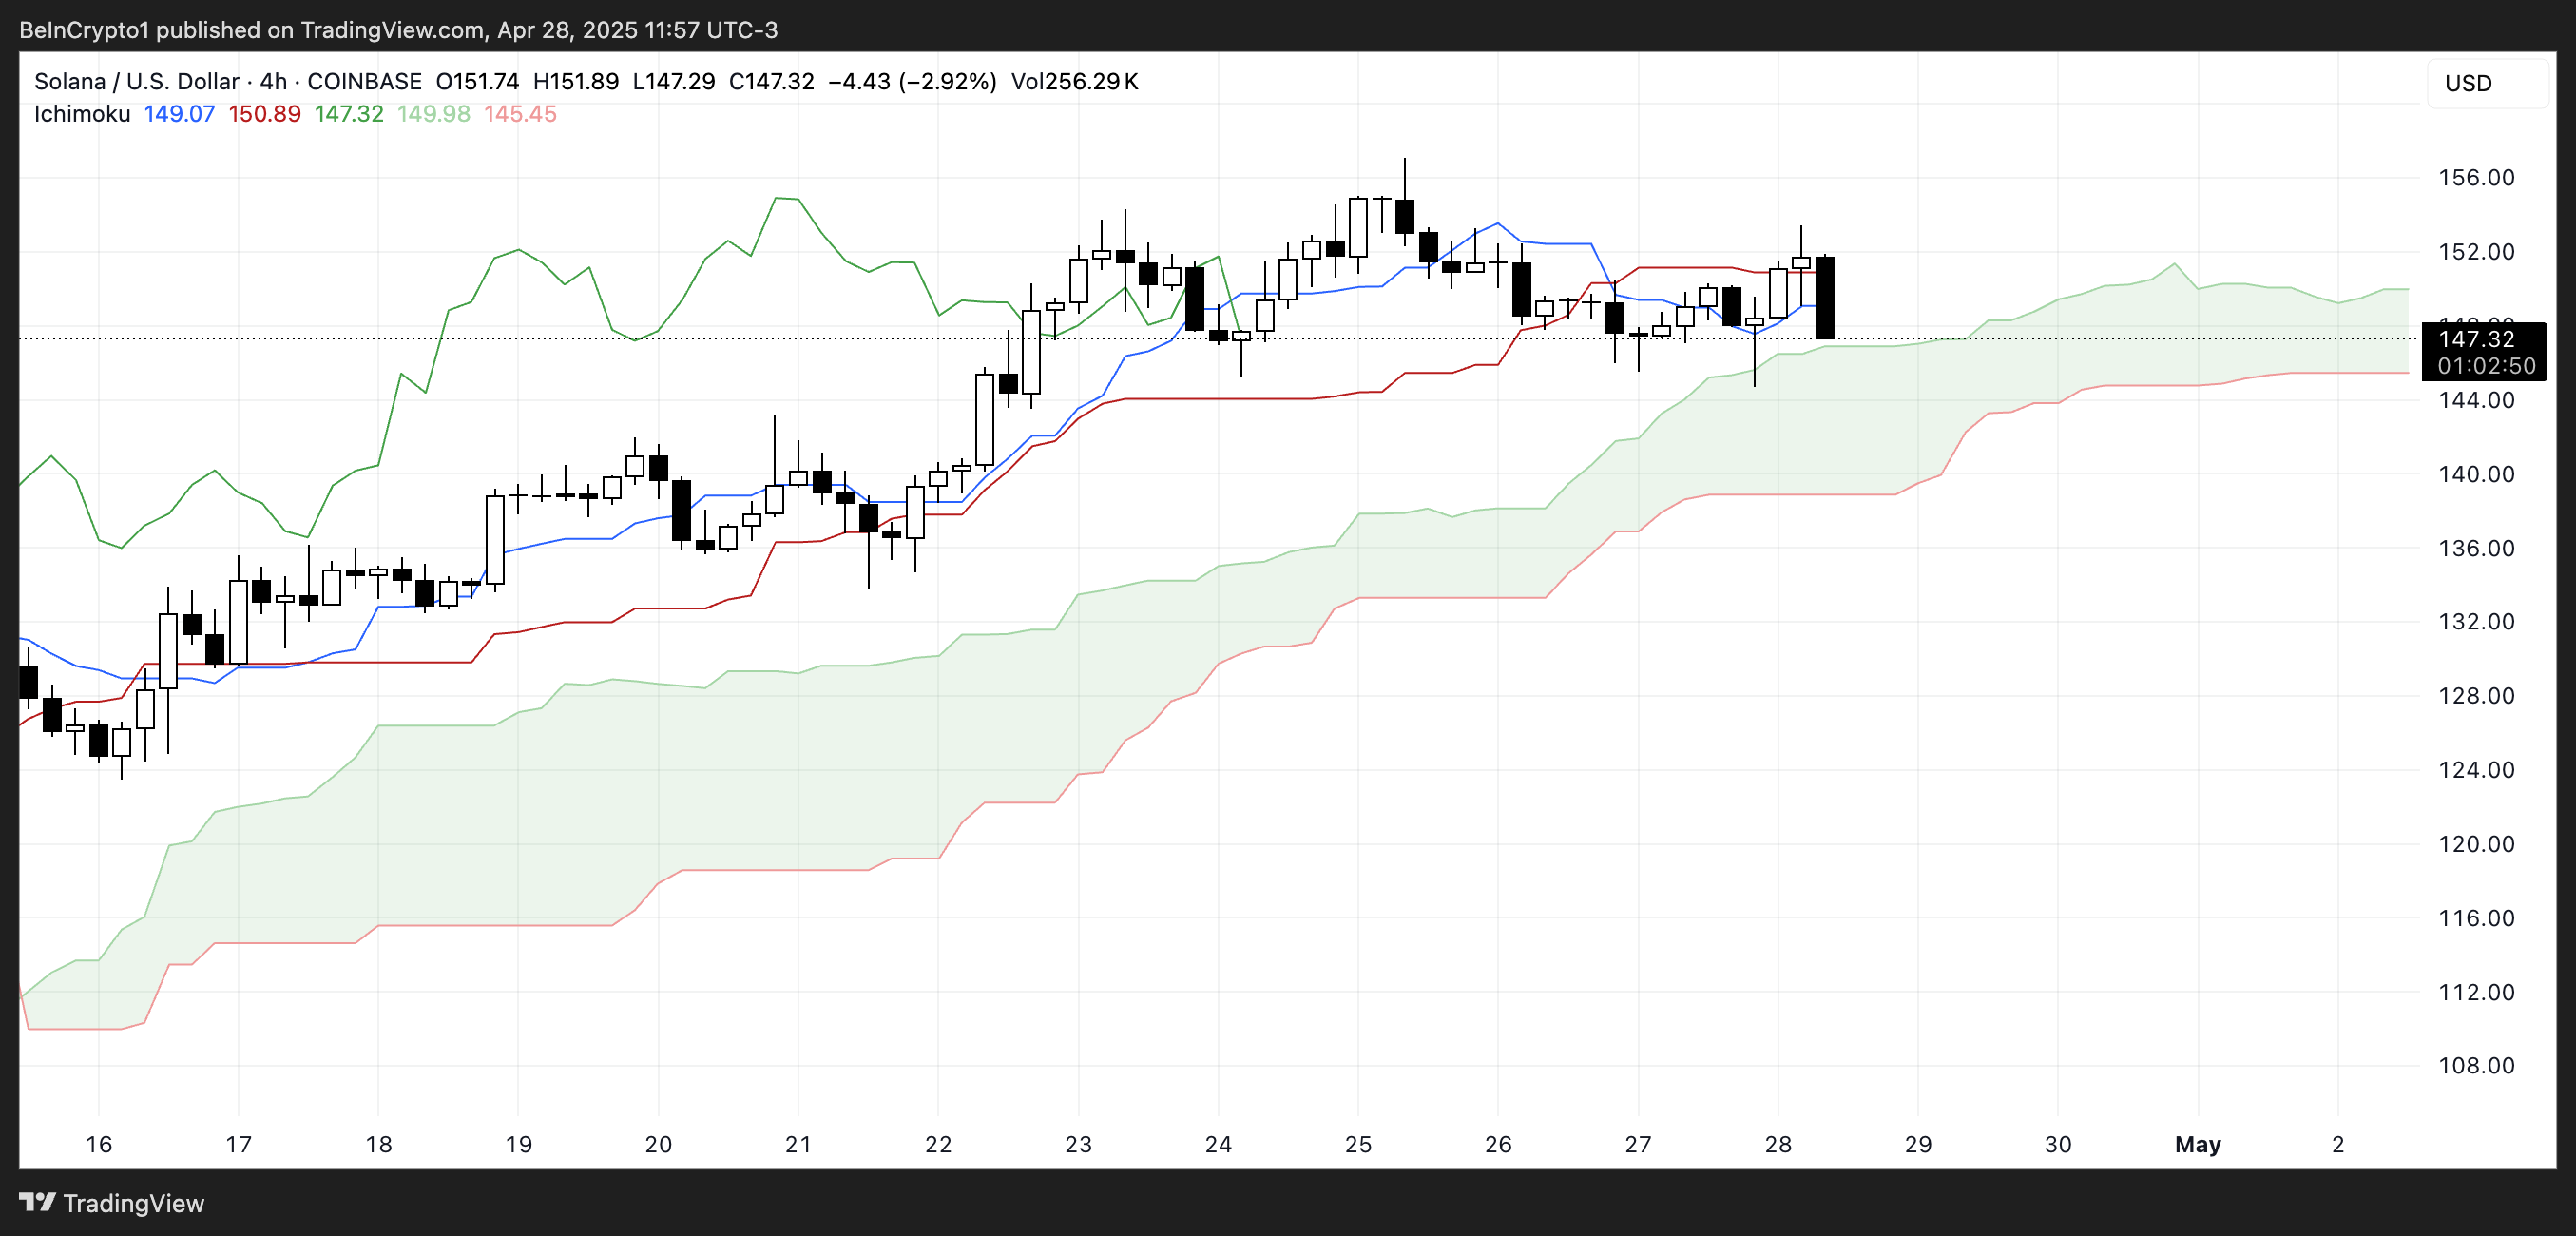
Solana’s Ichimoku Cloud chart shows the price testing support near the top of the green cloud.
The blue baseline (Kijun-sen) and red conversion line (Tenkan-sen) have flattened and run close to the candles, signaling a loss of short-term momentum.
The green leading span (Senkou Span A) remains above the red span (Senkou Span B), but the narrowing distance points to weakening bullish momentum.
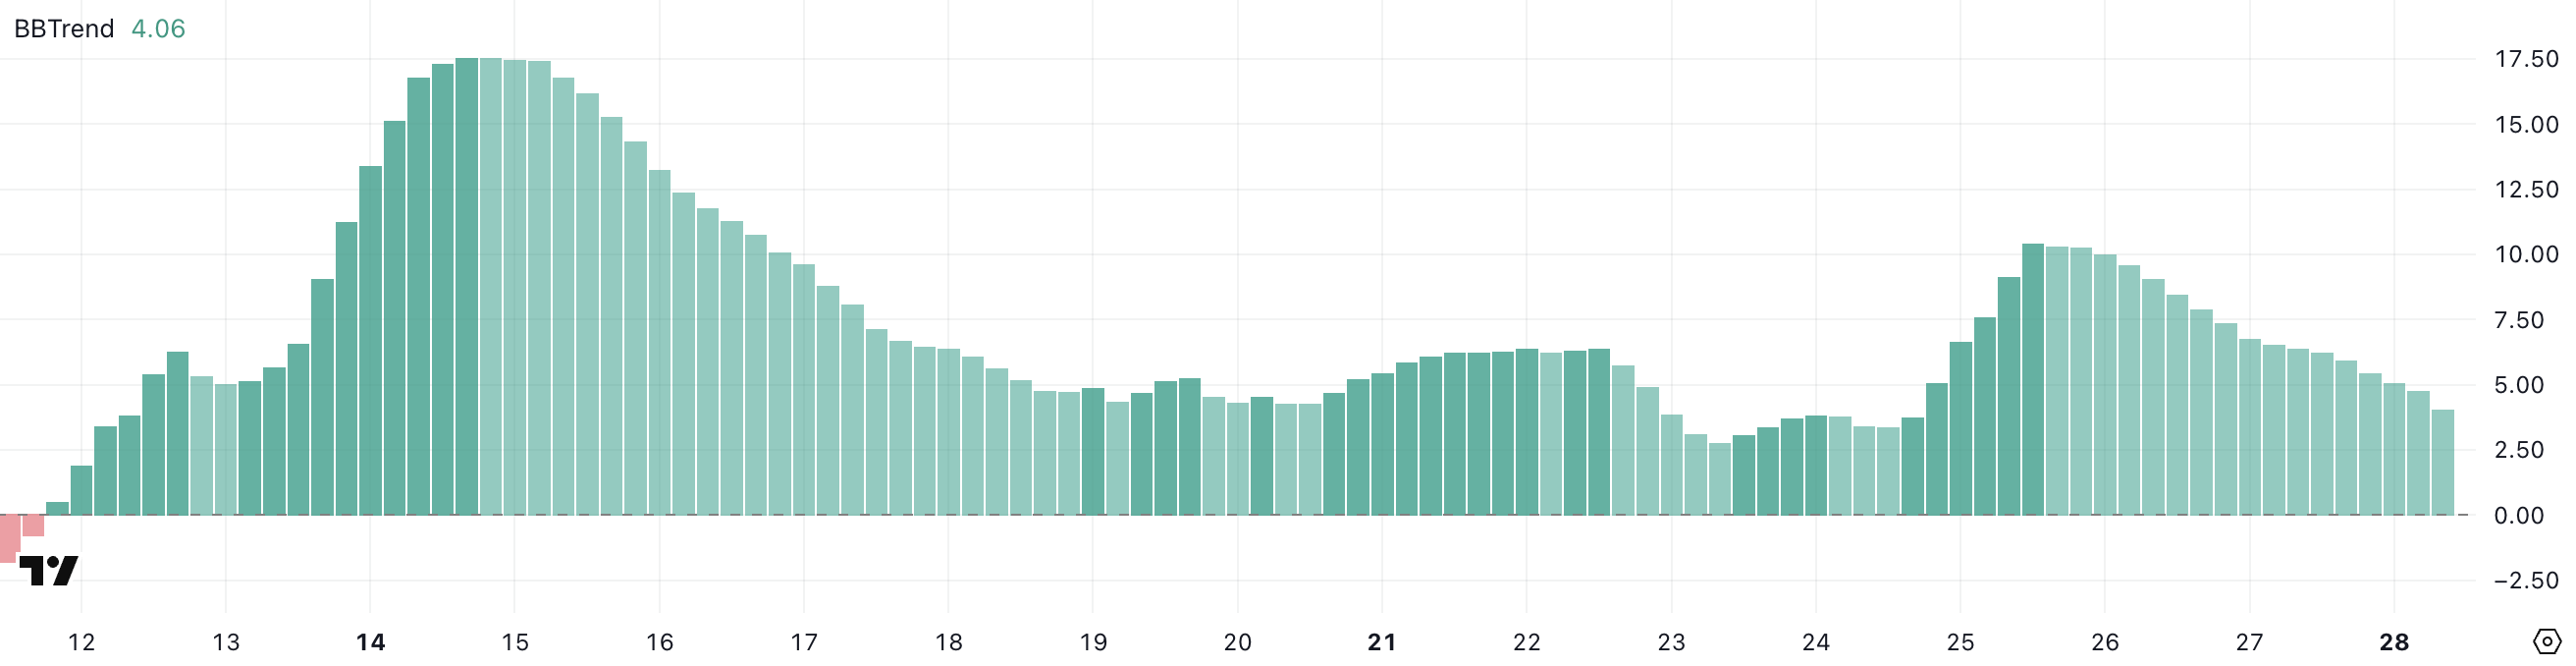
Despite this, BBTrend has stayed positive for 17 days since April 11, showing that broader momentum remains.
The BBTrend measures trend strength through Bollinger Band expansion or contraction; a falling BBTrend often signals slowing momentum or consolidation.
If BBTrend keeps falling, SOL could lose more momentum, but a buyer recovery could still lead to a fresh breakout attempt.
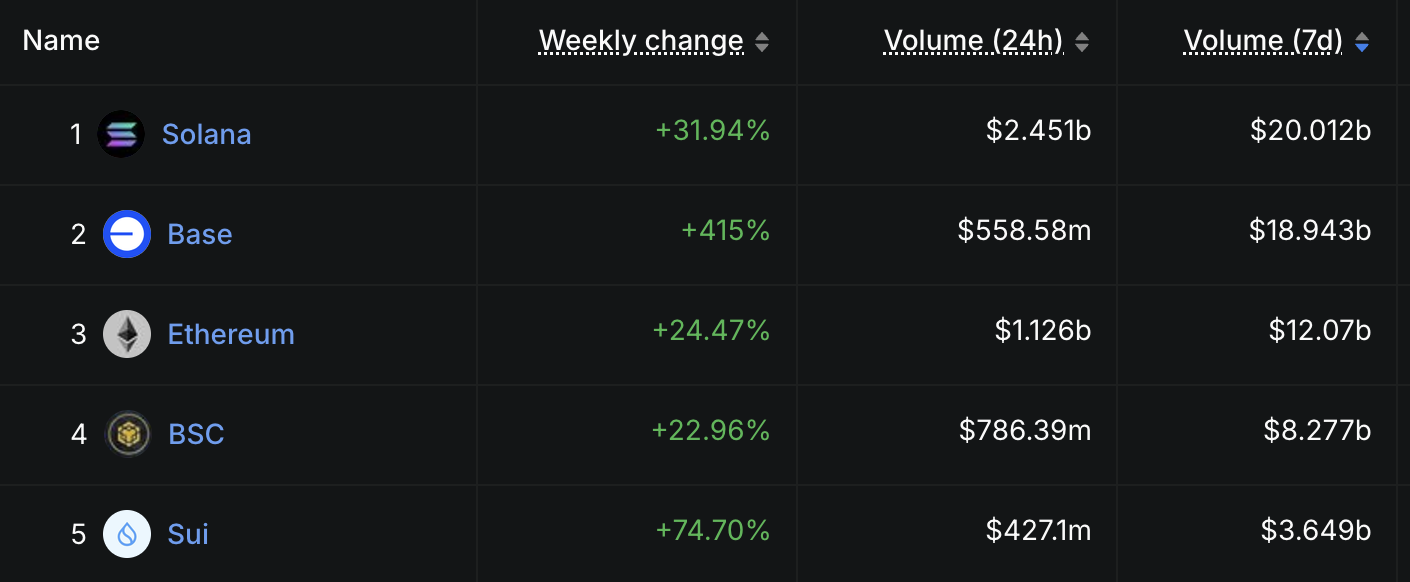
Solana Continues To Dominate DEX Volume and App Fees
Beyond DEX activity, Solana-based applications dominate the charts regarding blockchain revenue and fees.
Six of the top 10 chains and protocols — excluding stablecoins like Tether (USDT) and Circle (USDC) — are directly tied to the Solana ecosystem, with Pump and Jito leading the charge.
SOL at Key Decision Zone With 23% Upside Potential on Breakout
Solana Exponential Moving Average (EMA) lines remain bullish, with the short-term EMAs still positioned above the long-term ones.
However, SOL is now trading very close to a critical support level at $145, which has become an important area to watch. If this support is tested and fails, Solana price could quickly drop to the next support zone around $133.82.
In a deeper selloff scenario, the downtrend could extend further toward $123.41, significantly weakening the current bullish structure.
On the other hand, if buyers step back in and reinforce the uptrend, SOL could rally to test the $157 resistance level.
A successful breakout above $157 would strengthen the bullish momentum and potentially open the way for a move toward $180, offering around 23% upside from current levels.
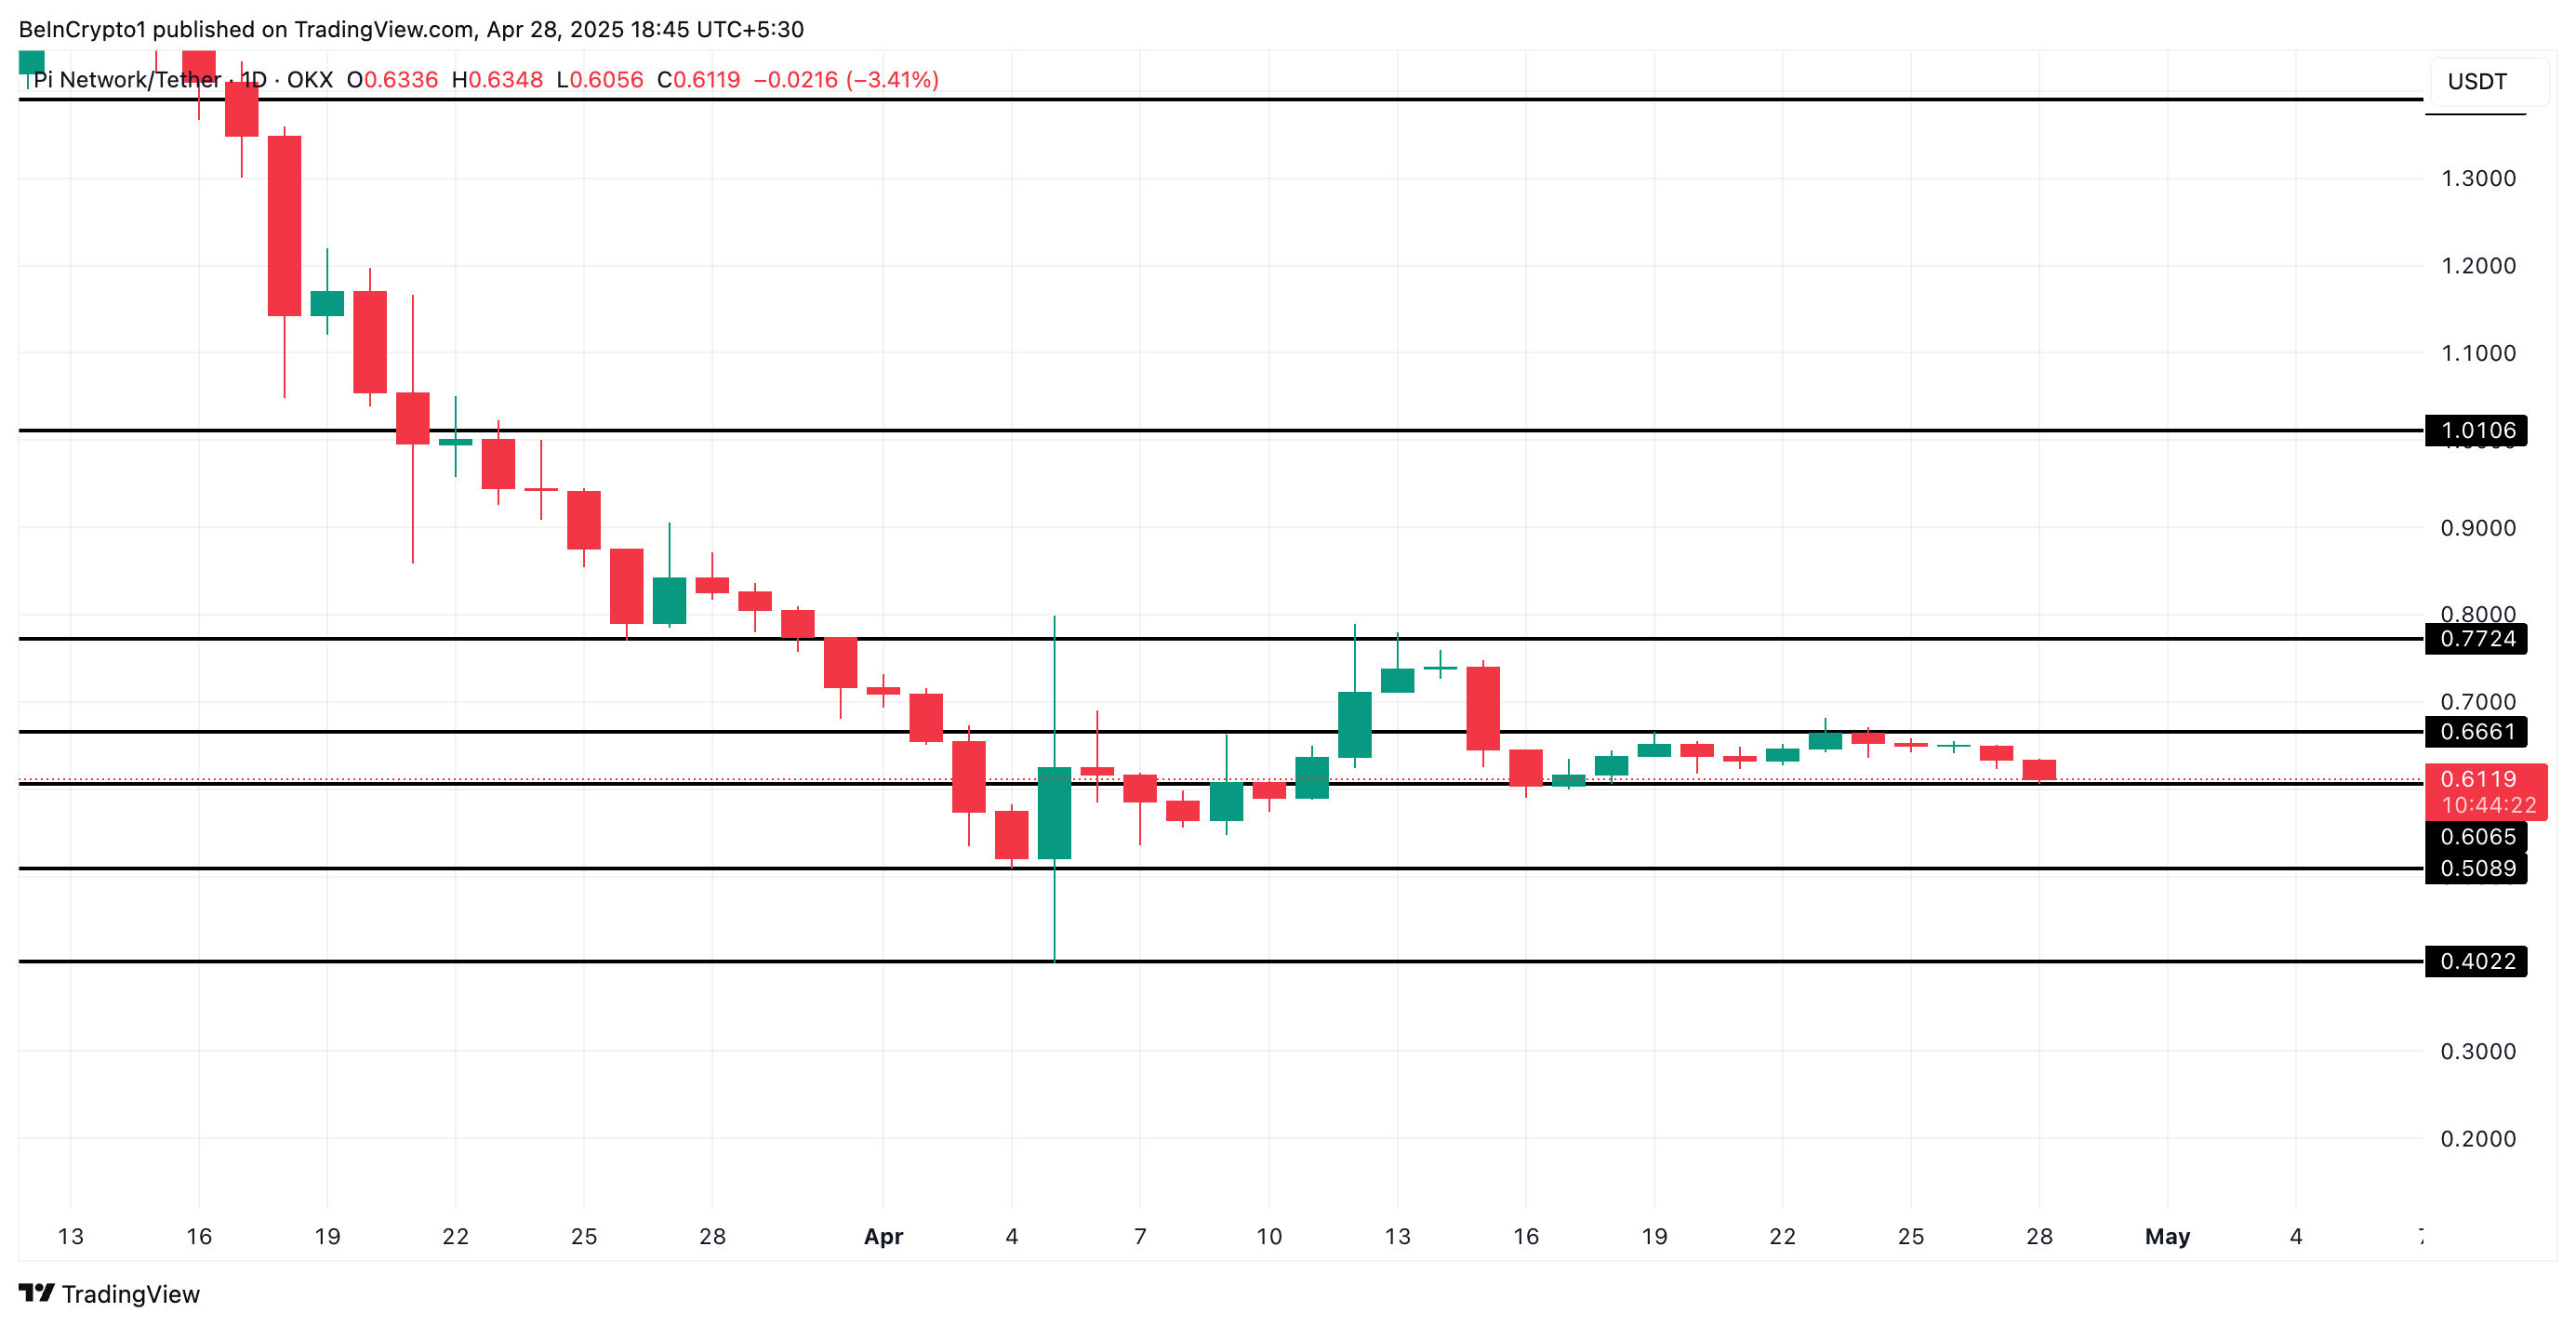
Pi Network’s PI token seems to have entered a consolidation phase, as the price action has leveled off. Since April 16, the token has faced resistance at $0.66 while finding support at $0.60, creating a narrow trading range.
This signals a period of indecision in the market, with neither PI buyers nor sellers taking full control.
PI’s Price Action in Limbo
Readings from PI’s Aroon indicator confirm the recent stagnation in its price. As of this writing, the token’s Aroon Up Line (yellow) is at 0%, while its Aroon Down Line (blue) is in decline at 14.29%.
The Aroon indicator identifies market trends and determines whether a trend is strong or weak.
A 0% reading on the Aroon Up Line suggests that PI has not reached a new high recently, signaling a lack of upward momentum. Meanwhile, the Aroon Down Line’s decline to 14.29% indicates that the token has not been experiencing significant downward pressure either.
This trend suggests a balanced market, where neither bulls nor bears are taking the lead. The setup confirms that PI is in a consolidation phase, with a breakout in either direction dependent on shifts in market sentiment.
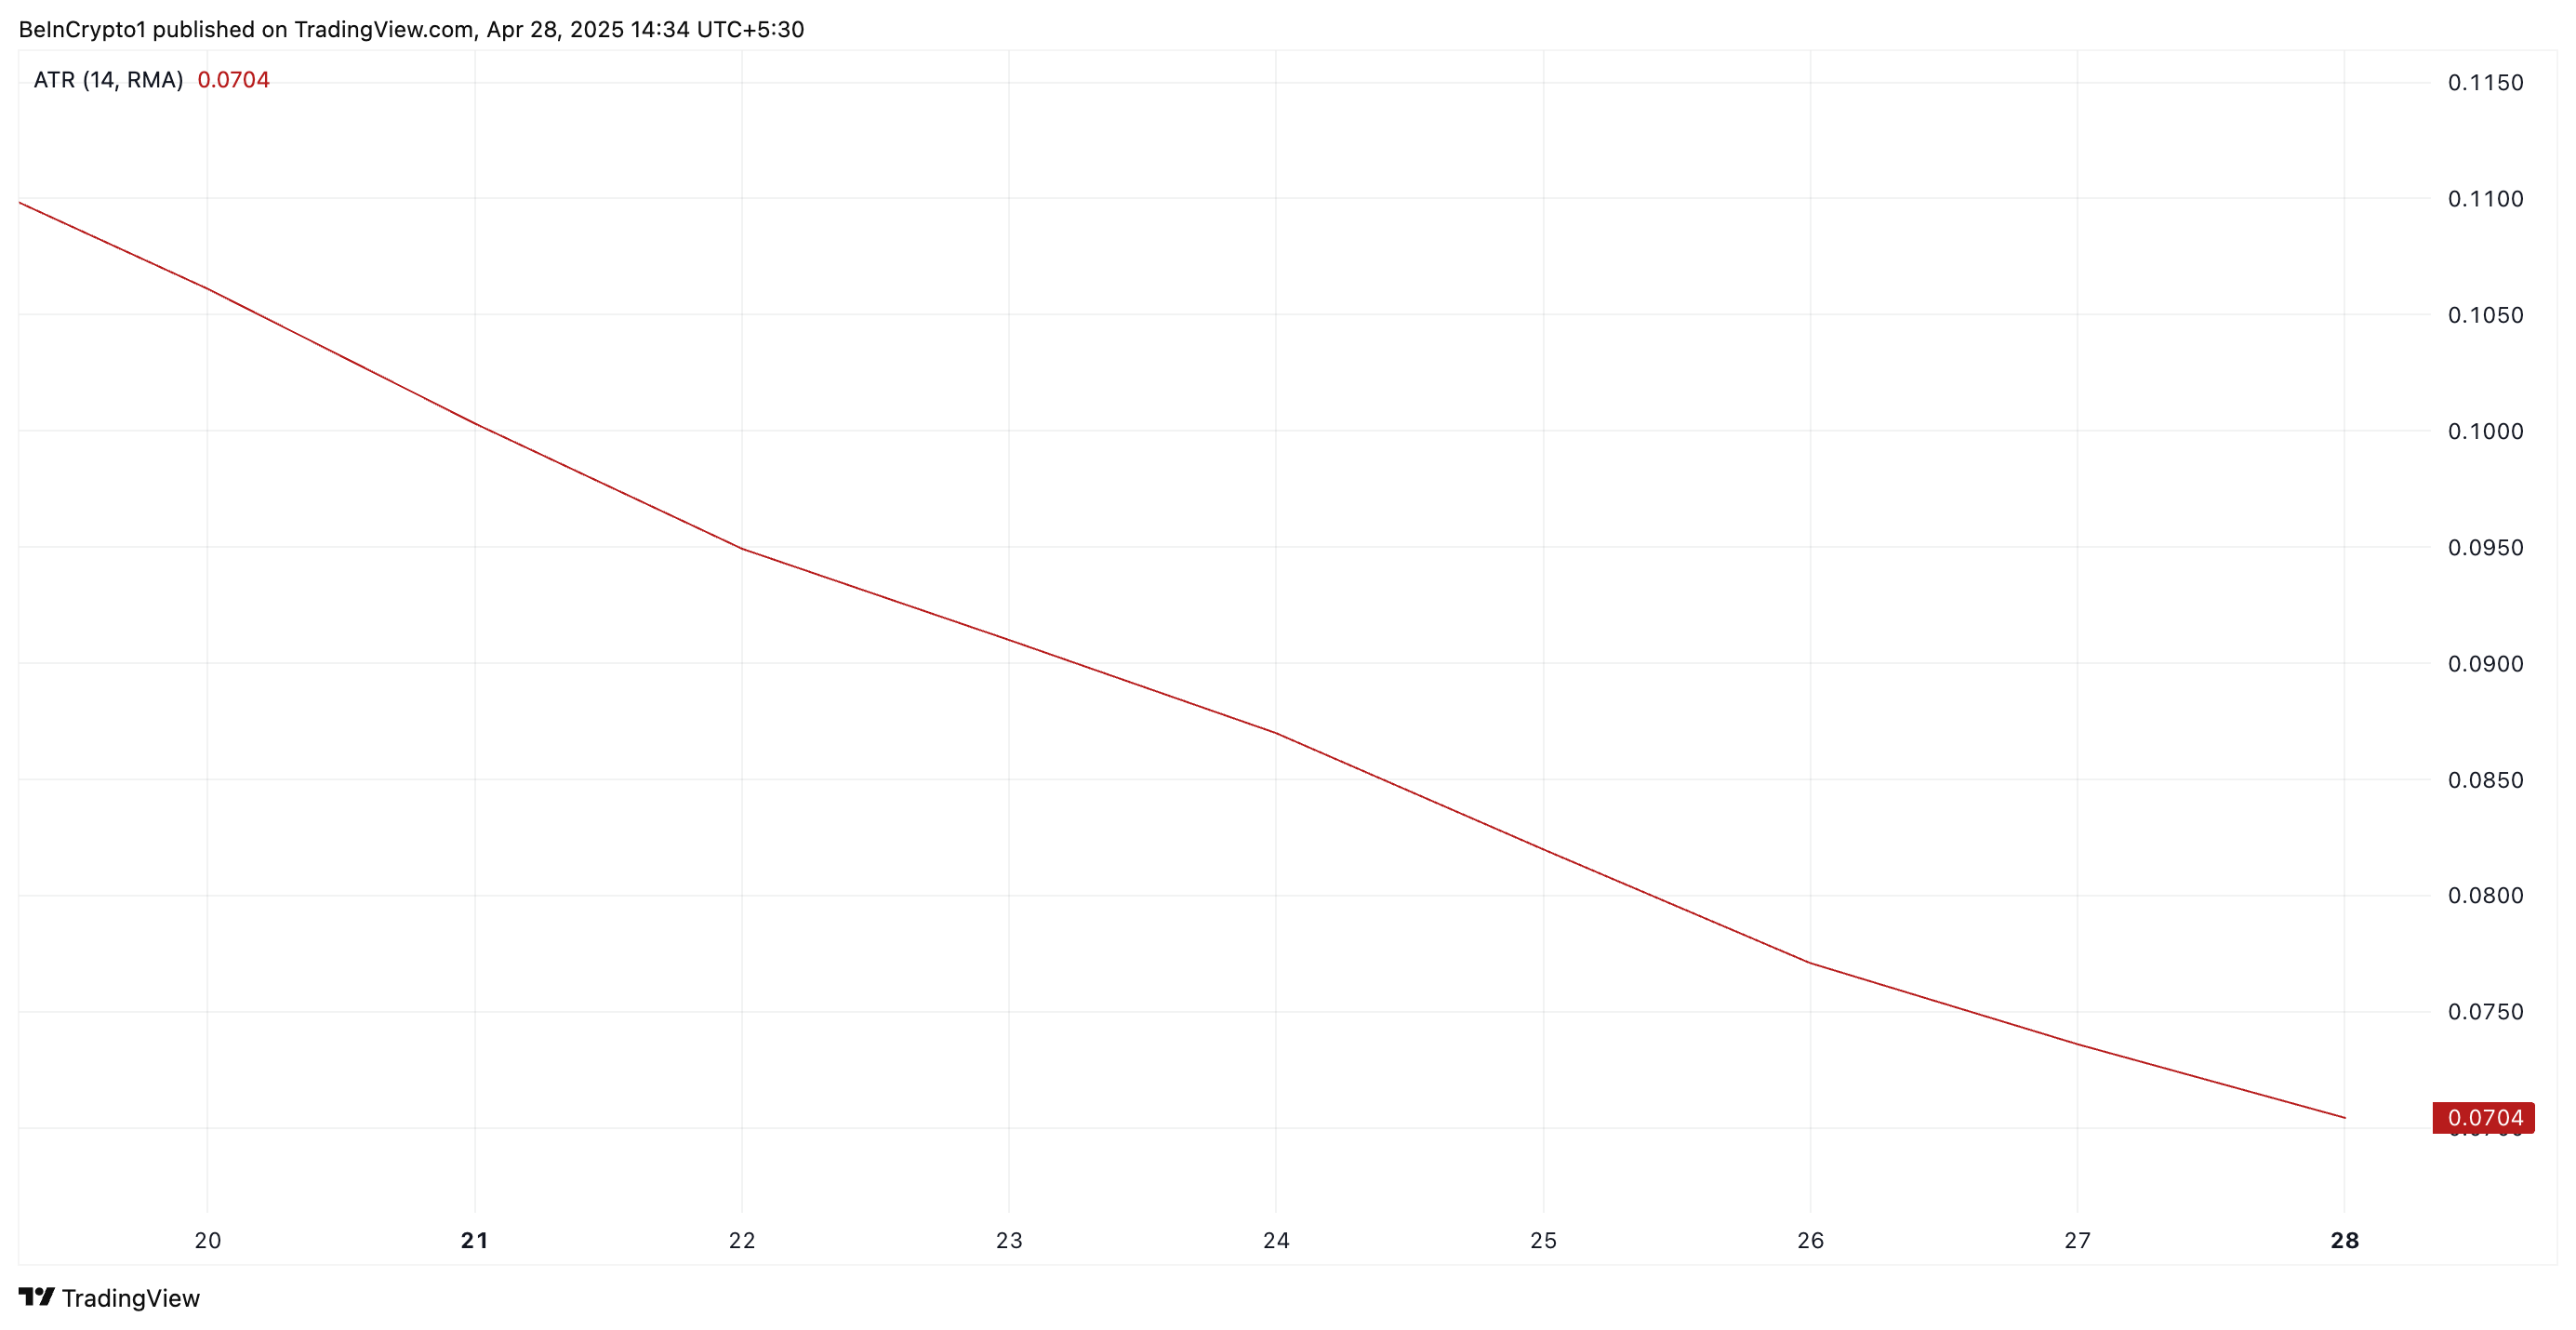
Further, the steady decline in PI’s Average True Range (ATR) since early March confirms the decrease in its market volatility and the shift towards consolidation. At press time, this indicator stands at 0.07.
The ATR indicator measures market volatility by calculating the average range between the high and low prices over a set period. When it falls like this, it indicates a decrease in market volatility, suggesting that price movements are becoming less erratic.
This often signals a period of consolidation or indecision in the market, as traders await a potential breakout or shift in direction. For PI, this is evident as both buyers and sellers hesitate, waiting for a catalyst to drive their next moves.
Will Bullish Momentum Drive PI to $1 or Will Bears Retake Control?
A breakout—whether to the upside or downside—could signal the start of a new trend, making PI a token to watch in the coming days. If bullish pressure soars and demand for the altcoin spikes, its price could witness a rally and attempt to break above the resistance at $0.66.
A successful breach of this level could propel PI’s price to $1.
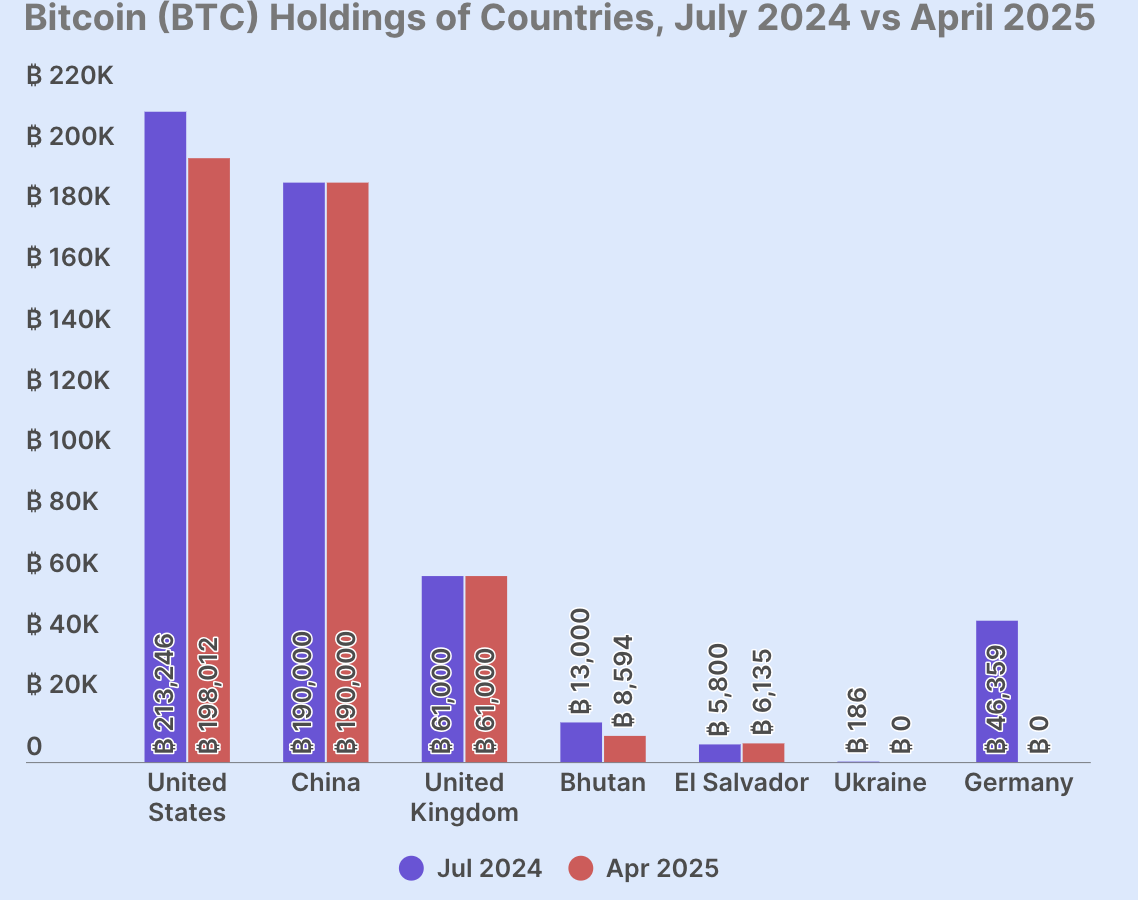
According to a new report from CoinGecko, government accounts hold 2.3% of the total Bitcoin supply. Collectively, their holdings amount to 463,741 BTC, a decrease from 529,591 less than a year ago.
Despite these impressive surface numbers, the general trend is in decline. Two of the seven holders completely liquidated their assets, and only El Salvador is actually buying more Bitcoin.
CoinGecko found some interesting trends when it broke down all the relevant statistics. For example, only five nations currently maintain active Bitcoin holdings.
Government Bitcoin Holdings in Decline. Source: CoinGecko
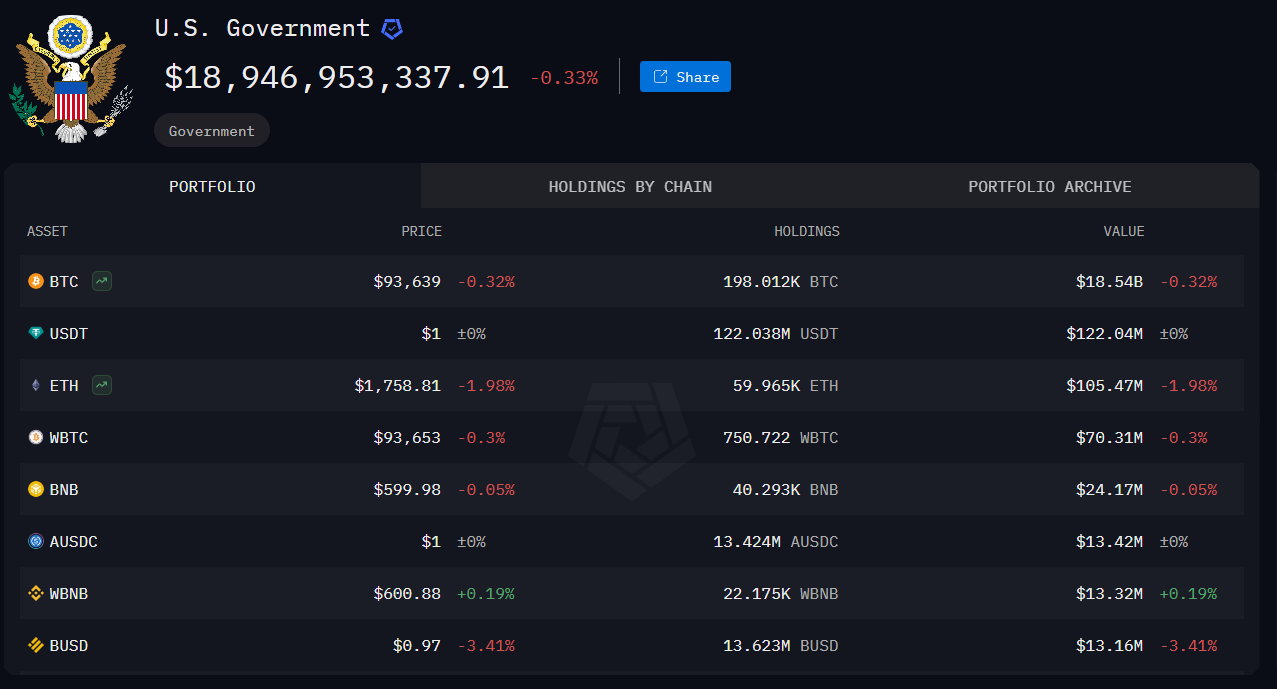
The US federal government is the largest national Bitcoin holder. Crypto has studied its behavior quite closely, and the industry is making major efforts to influence policy. The key issue is this: the US doesn’t purchase BTC, it seizes it in criminal operations.
Towards the end of Joe Biden’s Presidency, the country started to liquidate its BTC holdings, and this is a major motivating factor in Trump’s Crypto Reserve. The Reserve isn’t intended to purchase Bitcoin, but it organizes the existing stockpile and protects it from future sales.
The country seized nearly 200,000 bitcoins in 2020 and hasn’t moved since. Thus, this large stockpile can escape mainstream notice.
US Government’s Total Crypto Holdings. Source: Arkham
The British government mirrors China’s Bitcoin strategy, keeping its substantial reserves in a holding pattern. Germany enacted a complete liquidation last year, bringing its substantial holdings to zero. It did this to cover a budget deficit, not for any anti-crypto ideological reasons.
Ukraine performed a similar total BTC liquidation to fund its ongoing war effort.
All the aforementioned government whales obtained their Bitcoin solely through criminal seizures, except for Ukraine, which accepted cross-border donations.
This is to say that CoinGecko took a closer look at impressive numbers and found revealing conclusions. On paper, governments hold a massive supply of Bitcoin, but this trend is surprisingly fragile.
Only seven governments held BTC last year, and two of them have lost it since. A few political changes could totally change this environment.
The condition of the crypto market has improved considerably as April comes to an end. Meme coins are expected to start off strong in May as investors seem to be taking these joke tokens a lot more seriously, as seen with Housecoin (HOUSE).
BeInCrypto has analyzed three meme coins for investors to watch and how their interest is cementing in these tokens.
Zerebro (ZEREBRO)
Launch Date – November 2024
Total Circulating Supply – 999.95 Million ZEREBRO
Maximum Supply – 1 Billion ZEREBRO
Fully Diluted Valuation (FDV) – $60.01 Million
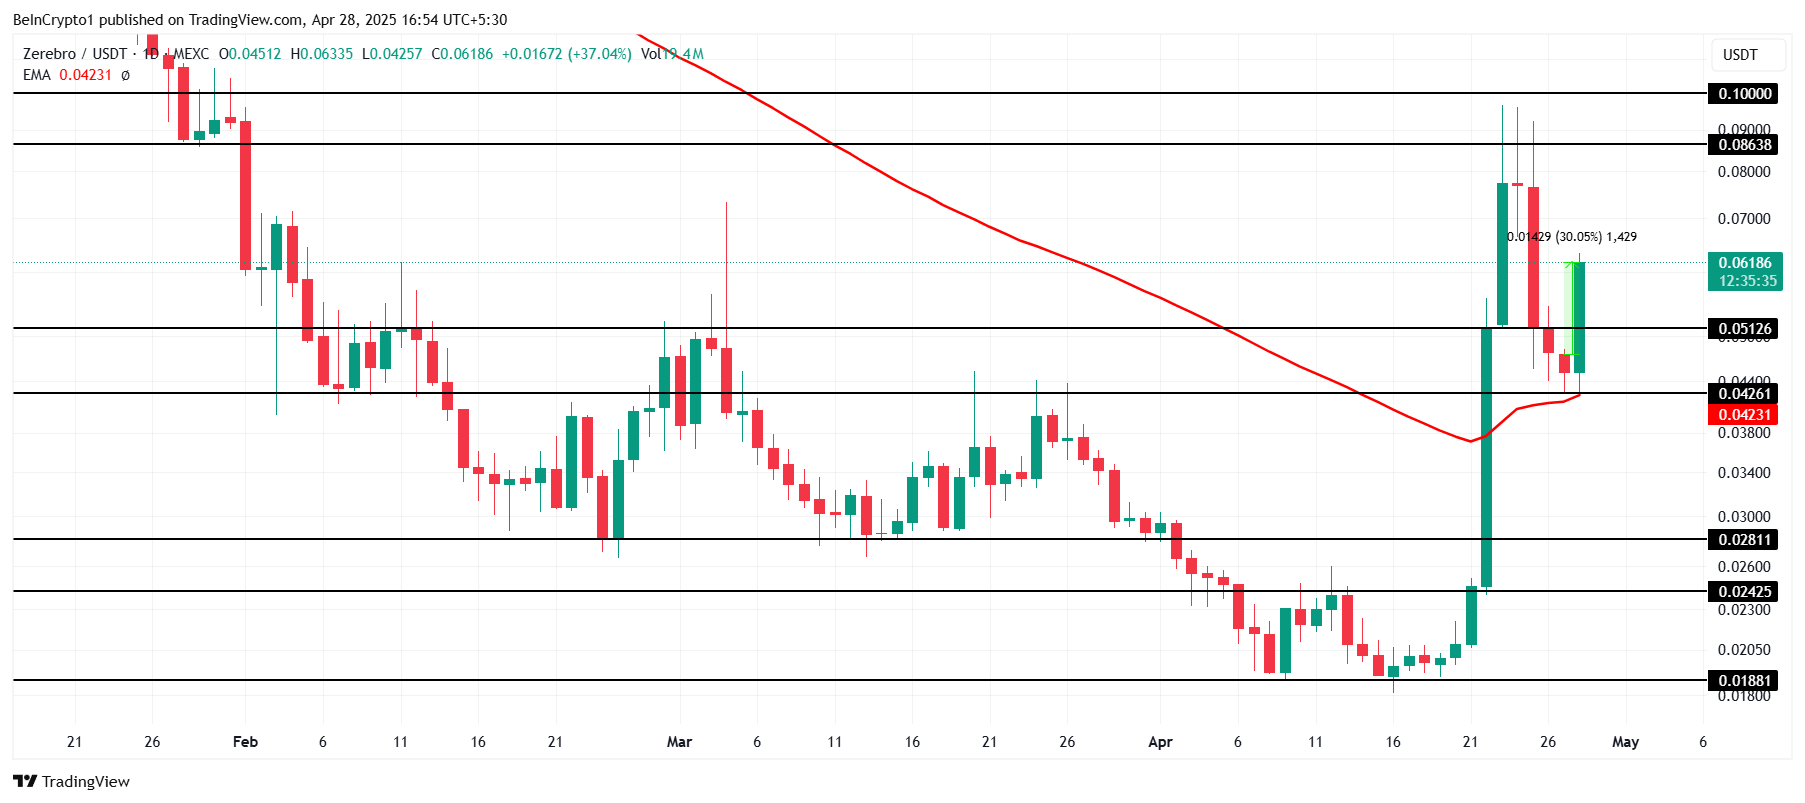
ZEREBRO has surged by 30% in the last 24 hours, trading at $0.061. The meme coin is showing strong bullish momentum and looks poised to continue its uptrend.
With the 50-day Exponential Moving Average (EMA) providing solid support, ZEREBRO demonstrates strong technical strength. This support level could help propel the altcoin toward the next major resistance at $0.086. If the altcoin continues to hold above the 50-day EMA, it may continue its upward trajectory with sustained investor interest.
However, profit-taking from investors could trigger a price correction, sending ZEREBRO lower. A drop below the $0.051 support level could lead to further declines toward $0.042. The recent gains could be wiped out if this support is breached, and the bullish outlook would be invalidated.
Pudgy Penguins (PENGU)
Launch Date – December 2024
Total Circulating Supply – 62.86 Billion PENGU
Maximum Supply – 88.88 Billion PENGU
Fully Diluted Valuation (FDV) – $943.05 Million
PENGU has surged by 25% since Sunday, trading at $0.0123, showing strong upward momentum. The meme coin is aiming to breach the $0.0147 resistance. For this to happen, continued strong support from investors is necessary. If momentum continues, PENGU could make its way through this key level to further gains.
A breakout above $0.0147 resistance could set PENGU on a path toward $0.0225, indicating the potential for continued upward movement in the coming days.
A failure to break the $0.0147 resistance would likely trigger a decline in PENGU’s price. If the altcoin falls below $0.0100, it could continue to slide toward the $0.0071 support level. Such a drop would invalidate the current bullish outlook and could lead to a prolonged downturn.
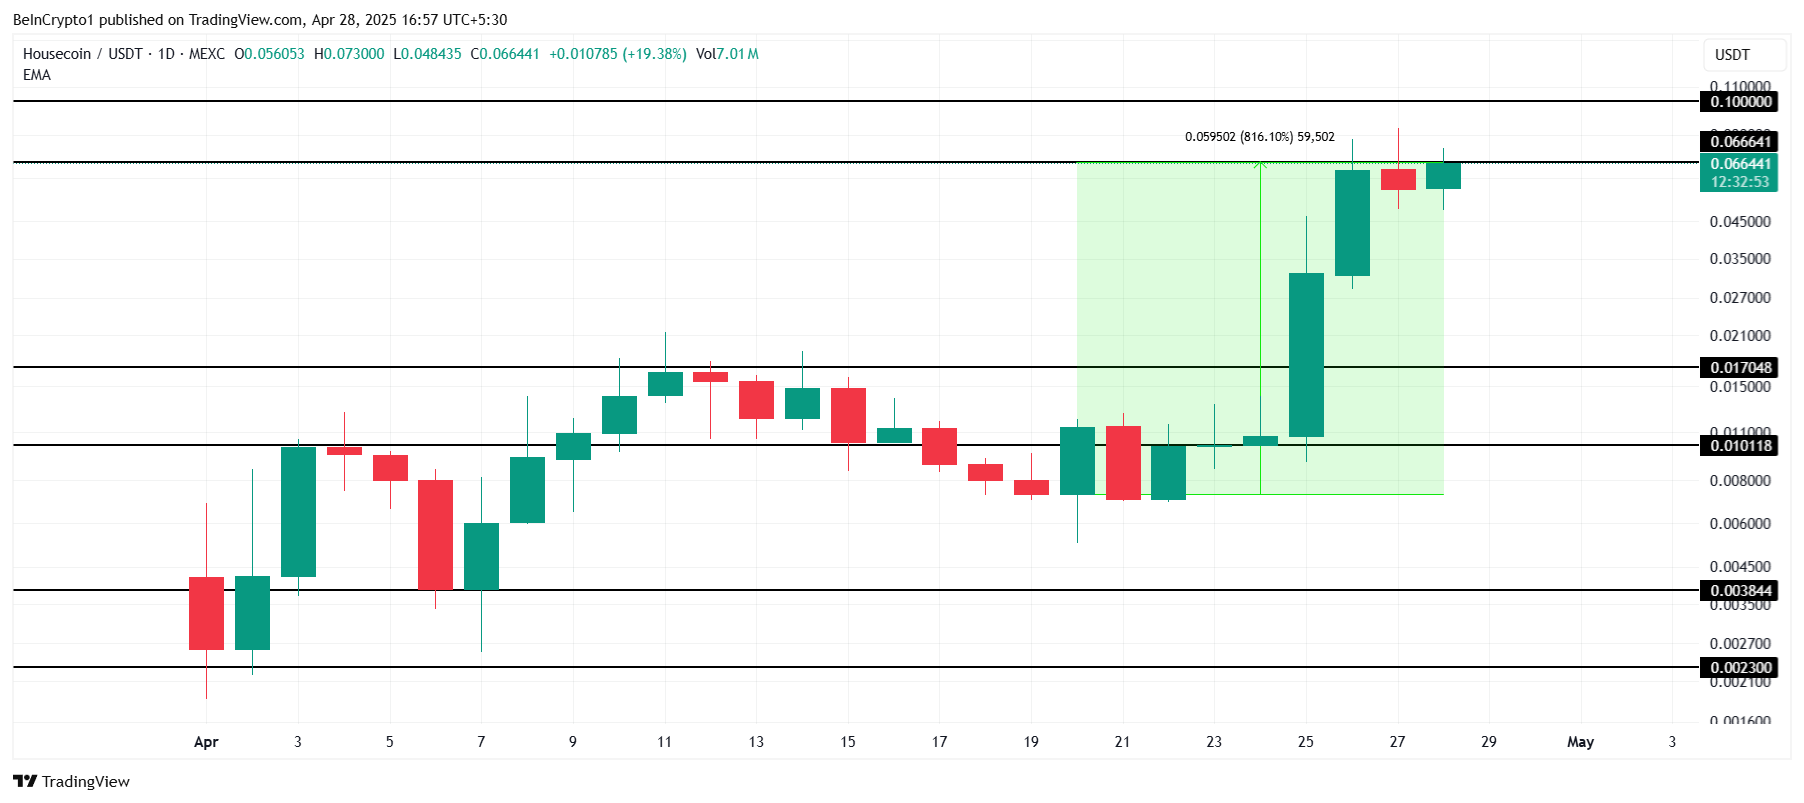
Small Cap Corner – Housecoin (HOUSE)
Launch Date – April 2025
Total Circulating Supply – 998.83 Million HOUSE
Maximum Supply – 998.83 Million HOUSE
Fully Diluted Valuation (FDV) – $66.90 Million
HOUSE has emerged as a surprising contender in the meme coin market, drawing attention with its humorous concept of investing in crypto rather than purchasing real estate. This fresh approach has resonated with investors, and many are actively supporting the token as it gains traction within the crypto community.
Over the past week, HOUSE has skyrocketed by 816%, currently trading at $0.0664. The altcoin is aiming to flip the $0.0666 level into support, a crucial step before targeting the $0.1000 resistance. If successful, this would set the stage for continued growth, potentially drawing more investors into the token.
However, if the novelty of the idea fades or investors decide to lock in profits, HOUSE could see a sharp decline. A fall below $0.0666 could lead to a drop to $0.0170, invalidating the current bullish outlook. Such a correction would likely signal the end of the altcoin’s recent uptrend.
Welcome to the US Morning Crypto News Briefing—your essential rundown of the most important developments in crypto for the day ahead.
Grab a coffee to see what analysts say about Bitcoin amid the showdown between BTC behemoth Strategy (formerly MicroStrategy) and Jack Mallers’ investment firm, 21 Capital. With their Bitcoin models coming into question, is there a specific definition of what winning means in Bitcoin?
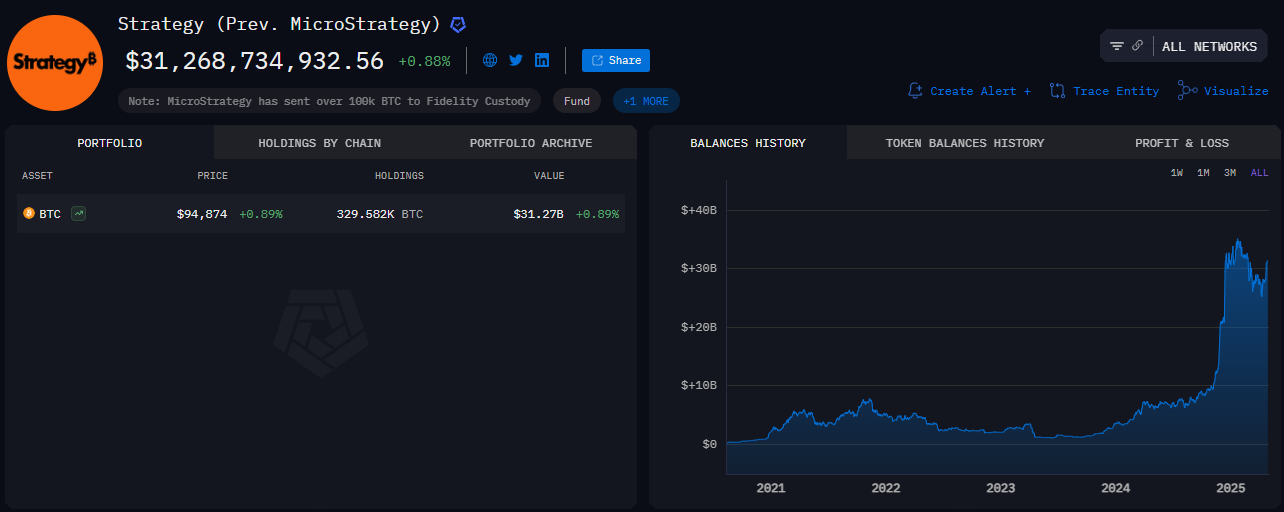
Strategy Grows Bitcoin Stockpile, Buys $1.42 Billion in BTC
Strategy announced that it recently purchased another 15,355 BTC worth approximately $1.42 billion at an average price of $92,737 last week.
The firm currently holds 553,555 BTC, valued at approximately $52.7 billion. The average buying price is $68,459, and the unrealized profit is $14.8 billion.
“By continuing to grow its Bitcoin holdings, the company maintains its status as a major force in the cryptocurrency market, drawing interest from investors and industry analysts. Strategy is the largest Bitcoin Treasury Company, an independent, publicly traded business intelligence company, and a Nasdaq 100 stock,” Phoenix reported.
A recent US Crypto News publication highlighted the advent of 21 Capital. The Bitcoin investment firm sprouted after Cantor Fitzgerald, SoftBank, Tether, and Bitfinex pooled $3 billion in capital.
Based on sentiment, this new venture could inadvertently challenge Strategy’s position at the helm of corporate Bitcoin ownership in a model sense. According to 21 Capital, Strategy size could make increasing its Bitcoin per share difficult, a metric investors tend to consider.
Amid chatter that 21 Capital could threaten the Michael Saylor-led firm, BitStrategy, a shareholder at Strategy, challenged the prospective market rival’s business model.
Tension Grows in Bitcoin Treasury Space
In a detailed post on X (Twitter), BitStrategy acknowledged the brewing tension in the Bitcoin treasury arena. However, it holds that Strategy is way ahead of the competition.
“Their company is in direct competition with ours, and they seek to exploit a perceived vulnerability in our structure, openly highlighting their strengths relative to ours to win investment,” BitStrategy challenged in a recent post.
Beyond BTC Yield, also reported in a recent US Crypto News publication, the firm initiated key performance indicators months ago- BTC Gain and BTC $ Gain.
Bitcoin Gain multiplies the BTC Yield by Strategy’s aggregate balance, reflecting the scale of the firm’s operations.
Bitcoin $ Gain takes this further, converting the BTC Gain into dollar terms, for added transparency.
This proactivity by Strategy suggests a commitment to defend its position as a leading Bitcoin-holding corporation amidst rising rivals.
“You can fake an impressive BTC Yield. You cannot fake an impressive BTC Gain,” BitStrategy chimed.
However, analyst KenjiKoshu argues that while Strategy may show substantial Bitcoin gains, smaller companies like 21 Capital could achieve higher Bitcoin per share.
“As someone who has done deep thinking about why MSTR is undervalued, it might be true BTC gain can still be substantial if not higher for MSTR. On a per-share basis, however, which would be what supports the stock; it will be hard to deny a smaller, similarly reputable company is going to make more Bitcoin per share when on the same strategy,” the analyst wrote.
This outlook aligns with sentiment from 21 Capital that Strategy’s large size impedes increasing its Bitcoin per share.
However, BitStrategy articulated that the point of BTC Gain and BTC $ Gain signals the importance of a whole-of-company view of performance relative to a per-share view.
Per the shareholder, there is no agreed-upon conventional valuation methodology for Bitcoin companies. This means any metric is somewhat arbitrary.
Investors increasingly turn to digital assets as a safe haven, with Bitcoin becoming a hedge against the US dollar’s volatility as crypto inflows surge to $3.4 billion.