Solana Price Fails to Stay Above $200 As 1.4 Million New Holders Retrace

Solana (SOL) recently attempted to break the $200 mark but failed as investor sentiment shifted. The altcoin, after briefly surpassing this level, has been unable to maintain momentum. 

Now, Solana’s price is facing further declines as market conditions weaken and investor behavior changes.

Solana Investors Are Bearish

The Liveliness metric has shown a sharp increase over the past 12 days, reaching a monthly high this week. Liveliness measures the movement of long-term holders (LTHs), and when it spikes, it typically signals selling activity. 

This is currently the case with Solana, as many LTHs are selling off their holdings. Given that LTHs significantly influence price action, this selling pressure is contributing to the price decline. The large-scale selling could increase the downward pressure, making it harder for Solana to regain traction in the market.

Solana Liveliness
Solana Liveliness. Source; Glassnode

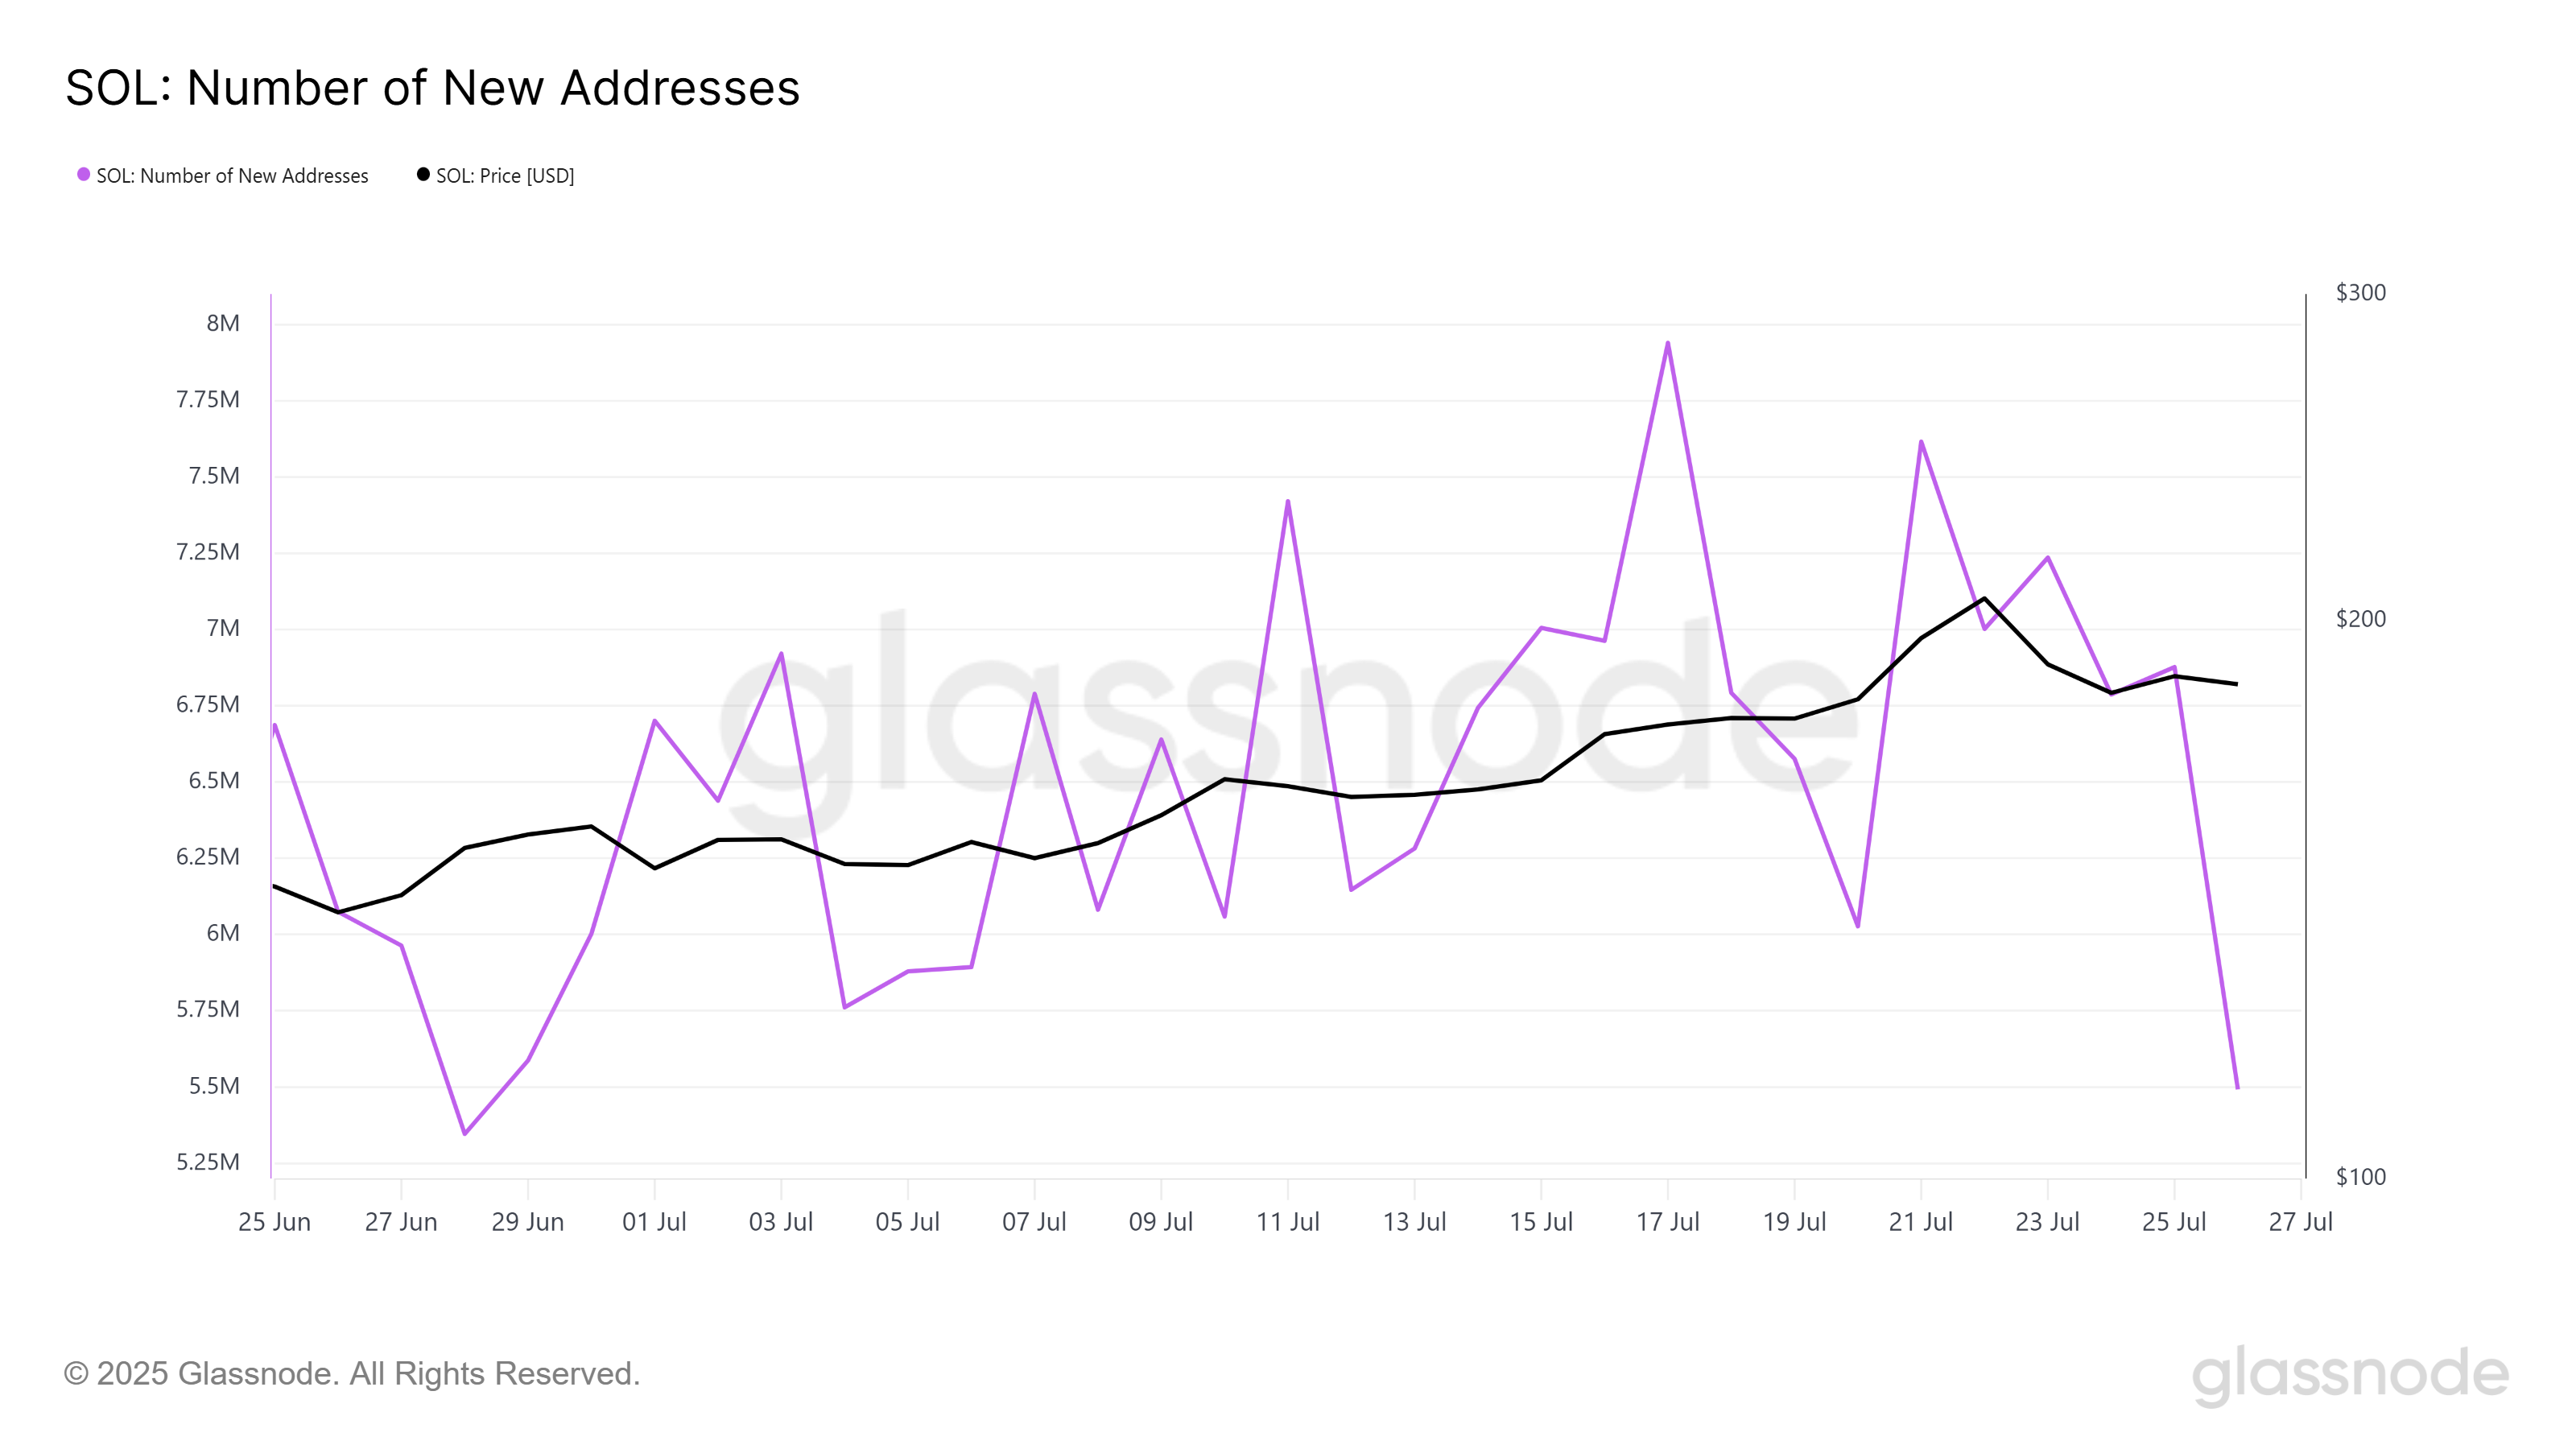
Solana’s macro momentum is also showing signs of weakness. The number of new addresses has hit a monthly low, with the daily rate of new address creation dropping significantly. In the past 48 hours, Solana saw a decline of 1.4 million new addresses, highlighting a lack of interest from fresh investors.

The declining number of new addresses suggests that Solana is losing its appeal to new investors, which could prolong the current downtrend. As fewer people are willing to invest in the asset, its price is more likely to continue its retreat.

Solana New Addresses
Solana New Addresses. Source; Glassnode

SOL Price Fails Again

Solana’s price is currently trading at $187, just below the resistance of $188. After its recent failed attempt to hold above $200, the altcoin has struggled to maintain its value. With the LTHs selling off and new investors pulling back, Solana faces a challenging road ahead.

Given the current market conditions, Solana is vulnerable to further price declines. If the selling pressure continues, it could slip below the support of $176, deepening the losses for investors. This would confirm the bearish sentiment surrounding the altcoin.

Solana Price Analysis.
Solana Price Analysis. Source: TradingView

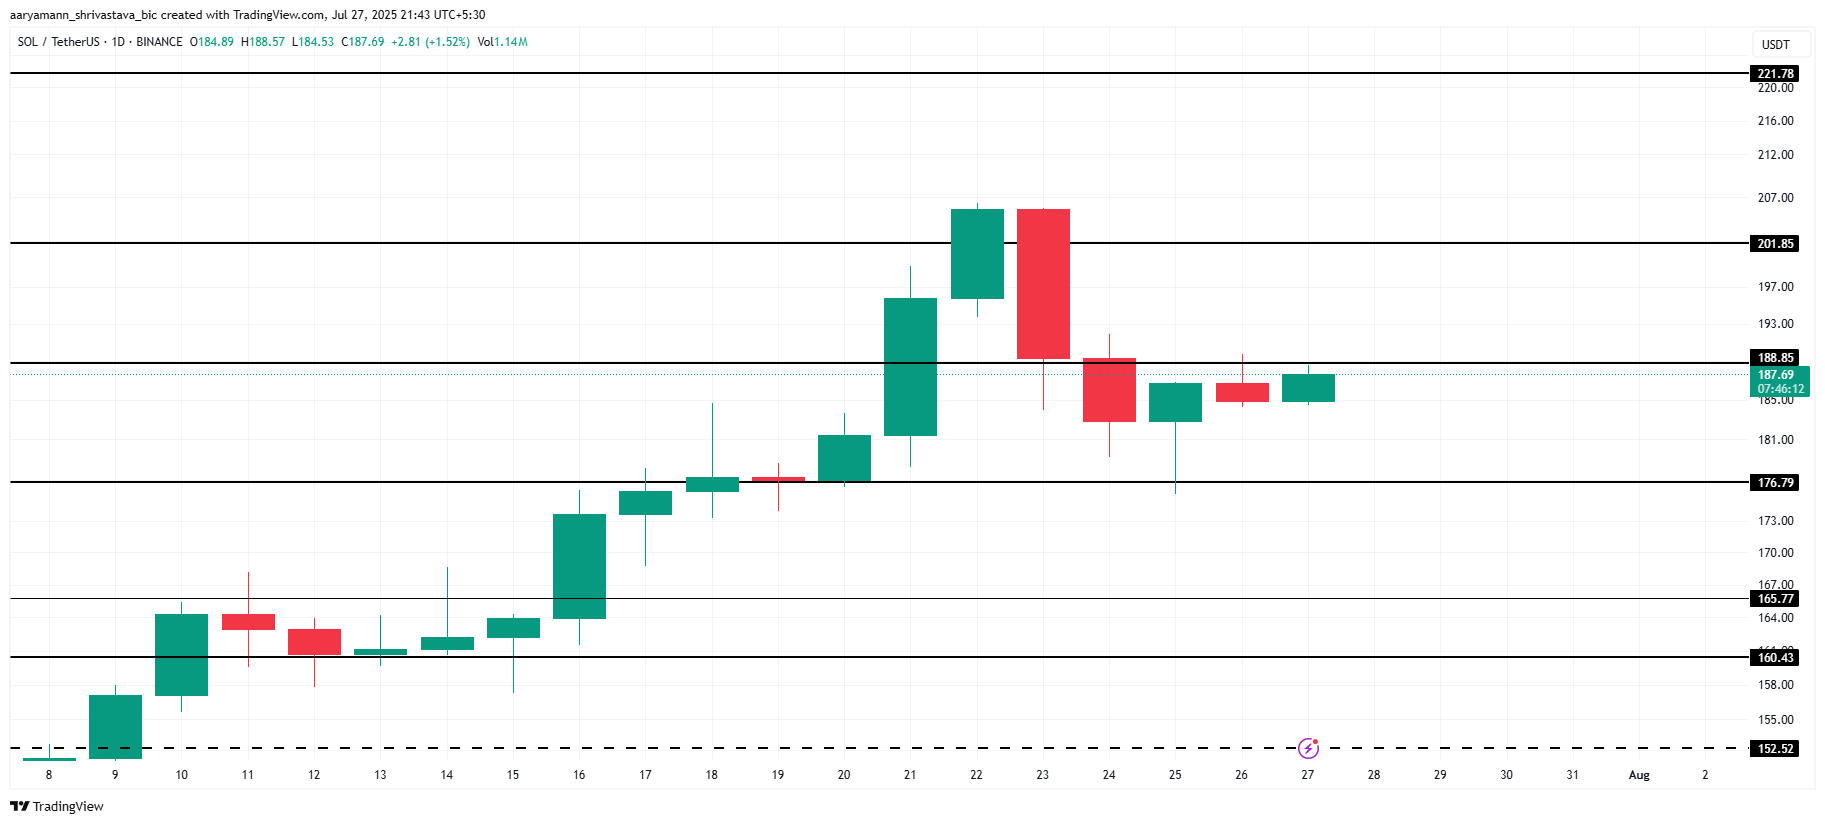
However, if broader market conditions shift favorably, Solana could potentially bounce back. Should the altcoin reclaim $188 as support, it might target a rise back to $201, giving it another opportunity to attempt holding above the $200 mark. 

The post Solana Price Fails to Stay Above $200 As 1.4 Million New Holders Retrace appeared first on BeInCrypto.

Ethereum Nears 10-Year Uptime but Critics Question Its Scaling and Legal Risks

As Ethereum (ETH) approaches its tenth anniversary, community members have come forward to highlight the network’s decade-long resilience.

Ethereum started the countdown to its 10th anniversary just over a week ago, unveiling an NFT torch first held by co-founder Joseph Lubin.

Ethereum Hits 10 Years Online With Zero Downtime

BeInCrypto reported that the countdown to Ethereum’s 10th anniversary started with the network launching an NFT Torch, which exchanges hands every 24 hours.

As hype builds, with only two days to the event, community members highlight the network’s resilience spanning 10 years.

Binji Pande, an Ethereum Foundation and Optimism (OP) contributor, articulated the network’s record of accomplishment, citing ten years of neither pauses nor maintenance windows.

“Ethereum has been online ten years straight with zero pauses and zero maintenance windows. in that time: – Facebook went down for 14 hours – AWS kinesis froze for 17 – Cloudflare dropped 19 datacenters – Alt L1s…well, you know. Every centralized giant blinks, they rely on on-call humans and scheduled downtime,” wrote Binji.

The contributor noted that Ethereum has proven unstoppable, enduring diverse market forces, unlike other networks, which suffer downtime during congestion seasons.

“…Ethereum never stops, not through forks, crashes, bubbles, lawsuits, hacks, wars, and every kind of drama the internet can throw at it,” the contributor added.

According to Binji, this record of accomplishment is ascribed to the Ethereum community, comprising developers, stakers, researchers, and users.

Ethereum co-founder Vitalik Buterin echoed the sentiment, re-sharing the post on X (Twitter). However, not everyone bought into the idea of Ethereum as an infinite machine.

Critics Challenge Ethereum’s Uptime Narrative and Legal Foundations

Analyst Marty Party challenged the view, pointing out the Ethereum network’s slow speed and its Layer-2 (L2) infrastructures. He also says Ethereum’s uptime record is misleading, calling L2s centralized, escrow-bound proxies.

“Stop sugar couting the facts. It is slow and unusable at 13 tps. L2s are not blockchains, they are centralized sequencers that just gather pseudo “transactions”, zip them up and write them in zips to Ethereum with a 7-day escrow window,” the analyst challenged.

He warns that most assets are unregistered securities, especially on platforms like Hyperliquid, and urges caution until new US crypto laws clarify what is legal.

Notably, Hyperliquid has a native bridge to Ethereum and is designed to be compatible with the Ethereum Virtual Machine (EVM)

“I’d wait for Market Structure Act and Clarity Act to conclude the guidelines before contributing large amounts to Ethereum L2s,” he cautioned.

Notwithstanding, the countdown to Ethereum’s tenth anniversary continues, with reports suggesting Alex Bornyakov, Deputy Minister of Digital Transformation of Ukraine, is the current holder of the Ethereum Torch NFT.

Ethereum NTF Torch holders
Ethereum NTF Torch holders. Source: Ethereum.org

Previous holders of the Ethereum NFT Torch include Joseph Lubin, the ceremonial holder, and Michael Egorov, the founder of Curve Finance.

BeInCrypto reported that a rotating cast of prominent community figures and builders will hold the torch for 24 hours since July 20. The next holder is due in a few hours after this publication.

Ethereum (ETH) Price Performance
Ethereum (ETH) Price Performance. Source: BeInCrypto

As of this writing, Ethereum was trading for $3,848, up by over 2.3% in the last 24 hours amid soaring institutional interest.

The post Ethereum Nears 10-Year Uptime but Critics Question Its Scaling and Legal Risks appeared first on BeInCrypto.

Here’s Why Shiba Inu Price Drop Could Trigger $50 Million In Liquidations

Shiba Inu (SHIB) has seen a significant drop in price over the past week, triggering bearish sentiment among traders. This has led to a wave of selling pressure in the market. 

However, should SHIB recover, it could cause substantial losses for short traders who are betting against the altcoin.

Shiba Inu Traders Should Be Aware

The liquidation map shows a fascinating development: if Shiba Inu recovers the 10% losses it has sustained, it could trigger over $52 million worth of short liquidations. Short sellers have been betting on a decline, but if SHIB rebounds, these traders will face considerable losses.

As traders exit their short positions due to losses, the market will likely see a surge in buy orders, which can propel SHIB’s price upward. This scenario is beneficial for SHIB holders, especially if the altcoin manages to secure a recovery, thereby validating the bullish outlook for the token.

Shiba Inu Liquidation Map.
Shiba Inu Liquidation Map. Source: Coinglass

However, the broader market signals suggest some concerns. Active addresses for Shiba Inu have seen a decline of 36% over the last 48 hours. This indicates that investors may be losing hope in a quick recovery for the altcoin and are swiftly exiting their positions. 

The decreasing number of active addresses reflects a lack of confidence in the altcoin’s short-term prospects. As more investors exit, the buying pressure necessary to trigger a recovery becomes harder to build.

Shiba Inu Active Addresses.
Shiba Inu Active Addresses. Source: Glassnode

SHIB Price Needs To Breach Resistance

At the time of writing, Shiba Inu’s price is $0.00001407, sitting just below the resistance level of $0.00001435. The altcoin has been facing mixed signals, with both bearish and bullish factors playing a role in its price action.

The key resistance level of $0.00001435 needs to be broken for a potential recovery.

If SHIB continues to hover within the consolidation range of $0.00001435 and $0.00001317, traders will remain safe from liquidation risks. This sideways movement will keep the altcoin within a neutral zone, avoiding drastic price changes in the immediate term.

Shiba Inu Price Analysis.
Shiba Inu Price Analysis. Source: TradingView

However, if Shiba Inu’s price manages to break the resistance at $0.00001435 and flips it into support, SHIB could potentially climb back to $0.00001553. This would mark a 10% recovery, invalidating the current bearish sentiment and shifting the outlook to a more optimistic tone.

The post Here’s Why Shiba Inu Price Drop Could Trigger $50 Million In Liquidations appeared first on BeInCrypto.

Major SUI Liquidations Loom as Price Breaks 2-Week Consolidation

SUI price has experienced a sharp surge in the last 24 hours, pushing the altcoin toward a potential breakout. 

The recent rally, coupled with favorable broader market conditions, has sparked optimism for a price move to new highs. The altcoin is inching closer to breaking out after a period of consolidation.

Sui is Building Momentum

The Relative Strength Index (RSI) for SUI remains in the bullish zone, suggesting that the altcoin’s upward momentum is strong. The RSI has not yet reached overbought territory, indicating that there is still room for further growth.

This signals that SUI could continue climbing as investor confidence grows.

The healthy position of the RSI supports the view that the price of SUI can maintain its bullish trajectory. The ongoing positive momentum suggests that the altcoin has enough strength to push through the resistance levels ahead, particularly if market conditions remain favorable.

Want more token insights like this? Sign up for Editor Harsh Notariya’s Daily Crypto Newsletter here.

SUI RSI
SUI RSI. Source: TradingView

While the market sentiment appears bullish, SUI faces the threat of massive liquidations. The liquidation map reveals that approximately $25 million in short contracts will likely be triggered if the price reaches $4.35.

This would create significant buying pressure, contributing to a potential surge in price.

The liquidation of short positions is generally viewed as a positive factor for the asset’s price, as it leads to increased demand. The absence of short contracts would help maintain bullish sentiment around SUI, as the market would need to push against fewer sell orders. This sets the stage for a potential breakout.

SUI Liquidation Map.
SUI Liquidation Map. Source: Coinglass

SUI Price Is Breaking Out

SUI is currently trading at $4.13, attempting to secure support at $4.12 after a 10% jump over the last 24 hours. The altcoin bounced off $3.69, indicating that the recent correction may be over, and the next phase could involve an upward movement. The goal is to establish $4.12 as support and continue the bullish trend.

The next major resistance level for SUI is $4.35. To reach this price target, SUI must hold the $4.12 support level. If the token successfully secures this support, it could push toward $4.35, potentially leading to further gains.

SUI Price Analysis.
SUI Price Analysis. Source: TradingView

However, the current market uncertainty remains a risk.

If the bullish momentum falters and investors begin to sell, SUI’s price could fall back to $3.93. Losing this support level would likely invalidate the bullish thesis, and SUI may struggle to regain upward momentum.

The post Major SUI Liquidations Loom as Price Breaks 2-Week Consolidation appeared first on BeInCrypto.

What Crypto Whales are Buying Ahead of the White House Crypto Report

The coming week is critical for the crypto market as the Trump administration publishes its assessment of the US crypto industry. The White House’s crypto report on July 30 is building anticipation among investors.

In line with this, BeInCrypto has analysed three altcoins that the whales have been buying over the past 24 hours.

Tutorial (TUT)

TUT has seen a significant surge, with the price rising by 17.68% over the last 24 hours. The increase is primarily due to the steady accumulation of TUT by investors. This rise indicates growing interest in the altcoin, signaling a potential bullish trend in the near term.

Over the last 24 hours, TUT whales have purchased 30 million TUT, valued at over $2.4 million. This accumulation suggests strong investor belief in TUT’s future potential, especially ahead of a potentially positive report this week.

Such behavior reinforces the bullish outlook for the altcoin, indicating increased confidence among large holders.

Want more token insights like this? Sign up for Editor Harsh Notariya’s Daily Crypto Newsletter here.

TUT Whale Holdings.
TUT Whale Holdings. Source: Nansen

Currently trading at $0.072, TUT is edging closer to its next price target of $0.080. If TUT successfully surpasses this level, it could trigger increased optimism among investors. A break above $0.080 would likely propel the price higher, attracting more buyers and strengthening the bullish momentum.

Pudgy Penguins (PENGU)

PENGU has become one of the most sought-after altcoins, as whales accumulated 400 million PENGU, valued at over $16.8 million in the last 24 hours.

This large-scale buying activity signals strong investor interest and suggests that the altcoin is poised for further upward movement in the short term.

The whale accumulation led to a 17% rise in PENGU’s price over the past day. Currently trading at $0.043, PENGU is nearing its all-time high (ATH) of $0.0469. With the current momentum, the altcoin is expected to likely breach its ATH, pushing prices even higher.

PENGU Whale Holdings.
PENGU Whale Holdings. Source: Nansen

However, if the broader market shifts to a bearish trend, PENGU could face significant resistance. A decline below the $0.040 support level could signal further weakness, potentially pushing the altcoin down to $0.0299.

This would invalidate the bullish outlook, suggesting caution for potential investors.

Pendle (PENDLE)

PENDLE has experienced a 5% gain over the last 24 hours, signaling potential for further upward movement. Despite increased whale accumulation, a major price surge has yet to occur.

If buying pressure continues, the cryptocurrency could see a sustained rally in the near future.

In the past 24 hours, PENDLE whales have purchased over 30,000 tokens, valued at approximately $133,200. This accumulation reflects a strategic move by larger investors, indicating potential bullish sentiment.

Should the demand from these whales increase, PENDLE may see its price continue to rise in the coming days.

PENDLE Whale Holdings.
PENDLE Whale Holdings. Source: Nansen

However, if whales decide to sell their holdings, PENDLE could face downward pressure. A drop below the $4.21 support could lead the token to fall from its current price of $4.43 to $3.90.

This bearish scenario would suggest a shift in investor sentiment, weakening the altcoin’s short-term outlook.

The post What Crypto Whales are Buying Ahead of the White House Crypto Report appeared first on BeInCrypto.

Gemini CEO Says JPMorgan Punishing Criticism with Banking Freeze

Wall Street banking giant JPMorgan has halted its efforts to re-establish banking ties with Gemini, one of the largest US-based crypto trading platforms.

The decision comes amid growing friction over data access between major banks and fintech companies.

Gemini’s Winklevoss Slams JPMorgan After Sudden Banking Reversal

On July 25, Tyler Winklevoss, co-founder of Gemini, disclosed that JPMorgan informed the exchange it would no longer proceed with plans to reintegrate the platform.

This move follows the earlier offboarding of Gemini during the period crypto advocates dubbed “Operation Chokepoint 2.0.” At the time, several banks, under regulatory pressure, cut off services to crypto firms, citing industry risk.

The recent pause, however, appears tied to a different conflict—one centered on financial data rights.

Winklevoss has been outspoken about JPMorgan’s push to charge fintech firms for access to customer banking data. He argues that this effort is aimed at undermining startups that rely on such access to offer users seamless financial services.

Last week, Winklevoss publicly criticized JPMorgan and other banks for attempting to impose fees on fintechs that connect to user bank accounts through tools like Plaid.

These fintech tools enable users to access and share their banking data. They also allow customers to transfer funds to crypto exchanges and related platforms.

“[JPMorgan] want us to stay silent while they quietly try to take away your right to access YOUR banking data for free through third-party fintechs like,” Winklevoss said.

According to him, JPMorgan’s strategy is an attempt to block user-friendly innovations in finance by locking up access to personal financial data.

Winklevoss suggested that his criticism may have prompted the bank’s latest decision to cut off his exchange.

Despite the setback, the Gemini CEO emphasized that he would not back down from his advocacy.

“Sorry Jamie Dimon, we’re not going to stay silent. We will continue to call out this anti-competitive, rent-seeking behavior and immoral attempt to bankrupt fintech and crypto companies. We will never stop fighting for what is right,” he stated.

JPMorgan’s action has drawn scrutiny from community members. Many see it as part of the ongoing struggle between legacy financial infrastructure and the future of open systems.

Lily Liu, President of the Solana Foundation, emphasized her long-standing belief in the resilience of open systems. She expressed confidence that these systems will ultimately achieve dominance in the digital space.

“The ‘market’ the ‘user base’ – however one wants to put it – of humans on the internet and their assets is larger than any company/country or feasible coalition of companies/countries can muster,” she stated.

The post Gemini CEO Says JPMorgan Punishing Criticism with Banking Freeze appeared first on BeInCrypto.

3 Altcoins Showing Accumulation Sign This Week

With the crypto market exhibiting strong signs of an altcoin season ahead, investors are accumulating their choice of tokens. Dropstab data currently shows 59 altcoins that are flashing the accumulation sign.

During the accumulation phase, trading volumes surge, and the price stays within a specific range for a prolonged time. This often leads to unsuccessful attempts to break out in either direction. However, emerging signals are starting to indicate a potential direction.

BeInCrypto has analysed three such tokens from DropsTab charts that are showing strong accumulation signals this week.

Pepe (PEPE)

PEPE price currently sits at $0.00001257, holding above the crucial support level of $0.00001216. The altcoin recently fell through the $0.00001389 support, wiping out a portion of the gains made earlier this month. This price action suggests that short-term volatility may continue for PEPE.

For the last nine days, PEPE has been in an accumulation phase, which suggests that investors are considering it an altcoin to buy. Although the price is vulnerable to minor fluctuations, a significant decline seems unlikely.

If PEPE manages to bounce off $0.00001216, it could recover and aim for a retest of $0.00001389 in the near future.

Want more token insights like this? Sign up for Editor Harsh Notariya’s Daily Crypto Newsletter here.

PEPE Price Analysis.
PEPE Price Analysis. Source: TradingView

However, if PEPE falls through its current support of $0.00001216, the price could drop further to $0.00001152 or lower. A move below this level could indicate further bearish pressure, invalidating the bullish outlook for the token and suggesting potential losses for investors.

Convex Finance (CVX)

CVX has shown strong momentum in the past week, with a nearly 21% increase in the last 24 hours. This accumulation phase suggests that the altcoin is gaining traction within the market, indicating growing interest and potential for further upward movement in the short term.

Currently trading at $5.85, CVX is testing the resistance level of $5.88. The Parabolic SAR below the candlesticks indicates a bullish trend, which could push the price above $6.00 if the uptrend continues.

CVX Price Analysis.
CVX Price Analysis. Source: TradingView

However, if CVX encounters bearish market conditions, the price could drop to $4.16, erasing the recent gains. A decline through this support level would invalidate the current bullish thesis, signaling potential further downside risk for the altcoin.

Tezos (XTZ)

XTZ is currently trading at $0.89, maintaining its position above the key support level of $0.87 for the past two days. This stability is attributed to the ongoing accumulation phase observed over the past four days, suggesting that the altcoin may be preparing for further upward momentum.

The 50-day and 200-day EMAs are nearing a Golden Cross, a bullish signal that could indicate further price growth. If the 50-day EMA crosses above the 200-day EMA, it will likely push XTZ’s price back above $0.99, possibly reaching $1.08, reinforcing the upward trend.

XTZ Price Analysis.
XTZ Price Analysis. Source: TradingView

However, if XTZ fails to hold the $0.87 support, the price could decline to $0.76. A drop below this level would invalidate the bullish outlook, signaling further potential downside for the cryptocurrency.

The post 3 Altcoins Showing Accumulation Sign This Week appeared first on BeInCrypto.

Bit Digital Seeks $1 Billion Pivot Towards Ethereum

Bit Digital, a Nasdaq-listed crypto firm, is deepening its commitment to Ethereum as it pivots from its previous Bitcoin-centric operations.

In a July 25 filing with the US Securities and Exchange Commission (SEC), the company proposed a significant increase in authorized share capital, from 340 million to 1 billion ordinary shares.

Bit Digital Proposes $10 Million Raise to Expand Ethereum Reserves

According to the filing, the new capital will primarily fund Ethereum acquisitions. The firm stated that its goal is to raise approximately $10 million, with a shareholder vote scheduled for September 10.

The company also clarified that proceeds from the proposed share issuance will support broader corporate initiatives, including mergers and acquisitions, employee compensation, dividend distributions, and general operations.

Bit Digital believes that its current share capital structure restricts its ability to scale, particularly in alignment with its long-term growth strategy centered around Ethereum.

This proposal reflects a dramatic transformation in the company’s strategic direction. Once known for its Bitcoin mining business, Bit Digital now views Ethereum as a core treasury asset.

Earlier in July, the firm sold 280 Bitcoin from its reserves, reallocating roughly $172 million to boost its Ethereum holdings.

Following this move, Bit Digital’s Ethereum balance surged from 24,434 ETH to over 100,600 ETH. An additional purchase of 19,683 ETH on July 18 further lifted its total to approximately 120,306 ETH.

This places it among the top 10 Ethereum treasury reserve holders, behind SharpLink and BitMine. Cumulatively, these kinds of firms hold more than 2.3 million ETH, valued at nearly $9 billion.

Nonetheless, Bit Digital’s aggressive accumulation strategy demonstrates the company’s growing conviction in Ethereum’s future.

“ETH can offer a rare combination of capital appreciation and native yield, making it an institutional titan. Its value is reinforced by strong onchain utility and a global community of developers. No other asset, including BTC, matches the depth of its ecosystem and built-in earning potential,” Bit Digital stated.

Beyond Ethereum accumulation, the company actively stakes its holdings and operates Ethereum validators, transforming its treasury into a yield-generating asset base.

The post Bit Digital Seeks $1 Billion Pivot Towards Ethereum appeared first on BeInCrypto.

Pi Coin Eyes Recovery As Investor Inflows Jump to 2-Week High

Pi Coin has seen significant price movement recently, experiencing a notable drawdown that brought it close to crucial support levels. 

Despite this decline, the altcoin managed to hold its ground above a potential all-time low (ATL). Inflows from investors are now providing the much-needed momentum for Pi Coin’s recovery.

Pi Network Is Gaining Traction

The current market sentiment for Pi Coin shows some positive signs. The Moving Average Convergence Divergence (MACD) indicator reveals that the bearish momentum has yet to gain strong traction. 

A recent bullish crossover, accompanied by green bars on the histogram, suggests that Pi Coin still has the potential to recover. This is a crucial development, as it indicates that the altcoin could regain upward momentum, potentially avoiding a drop to its ATL.

Want more token insights like this? Sign up for Editor Harsh Notariya’s Daily Crypto Newsletter here.

Pi Coin MACD
Pi Coin MACD. Source: TradingView

The macro momentum for Pi Coin is also showing signs of improvement, as indicated by the Chaikin Money Flow (CMF). The CMF has seen a sharp uptick, signaling an increase in inflows into the altcoin. 

While the indicator is still below the zero line, the rising trend suggests that Pi Coin is regaining traction. This could be a critical factor in helping the altcoin maintain its price above the support levels and prevent it from falling to new lows.

Moreover, the growing investor participation in Pi Coin is a positive indicator of its recovery potential. As more investors show interest in the token, it could create a stable foundation for future price growth.

This influx of capital could also support the altcoin in breaking through resistance levels, leading to a potential price rebound.

Pi Coin CMF
Pi Coin CMF. Source: TradingView

Pi Coin Price Finds Support

Pi Coin’s price has decreased by 9.7% in the last four days, with the altcoin trading at $0.442 at the time of writing. It has recently approached the local support level of $0.440, which has been holding steady.

A key factor for Pi Coin’s recovery will be its ability to bounce off the $0.440 support and secure $0.450 as a new level of support. This could set the stage for a price rebound, pushing Pi Coin towards $0.493 and helping it regain the losses incurred over the past days.

Pi Coin Price Analysis.
Pi Coin Price Analysis. Source: TradingView

However, if investor sentiment shifts from accumulation to selling, Pi Coin may face further downside risk. A breakdown below $0.440 could see the altcoin testing the all-time low of $0.400.

Pi Coin is currently just 9.6% away from this critical level, and if selling pressure mounts, it could reach the ATL once again.

The post Pi Coin Eyes Recovery As Investor Inflows Jump to 2-Week High appeared first on BeInCrypto.

Ethena (ENA) Pumps 20% On A Dull Day—Charts Hint at More Upside

While the broader crypto market is in retreat, Ethena (ENA) is defying the trend, rallying nearly 20% in the past 24 hours and catching the attention of traders across the board.

But what really stands out is the convergence of key signals such as rising whale activity, steady exchange outflows, and a bullish chart setup. All signs suggest that something bigger may be brewing. Could ENA be gearing up for a breakout rally?


Whales Are Gobbling Up Ethena

The most important trend right now is that whales are buying, and not selling. According to Nansen’s dashboard, ENA whale holdings have jumped 8.15% in the last seven days. At the current price, that stands close to $1.87 million.

Ethena price and whale accumulation pattern
Ethena price and whale accumulation pattern: Nansen

That’s a sharp increase, and it’s happening while most of the market is either flat or down. This kind of whale behavior usually signals confidence; big players are positioning for a larger move.

At the same time, exchange balances are falling. Over the past week, 1.07 billion ENA tokens have left exchanges.

That means Ethena (ENA) is moving into private wallets, not trading platforms. When this happens, it’s often a sign that holders plan to sit tight. Less supply on exchanges means fewer chances of sudden selling.

In short, big wallets are scooping up ENA, and the token is quietly disappearing from exchanges. That’s a strong bullish setup.


OBV Divergence Hints at Momentum Building Underneath

The chart shows something even more interesting. While ENA’s price made a lower high, the On-Balance Volume (OBV) made a higher high at the time of writing. This is called a bullish divergence; it happens when volume flows suggest buyers are stronger than the price action shows.

ENA price and OBV divergence
ENA price and OBV divergence: TradingView

At the time of writing, ENA is still inside a converging wedge pattern and trading near $0.57. The OBV trend is breaking higher, which hints that buying pressure is building under the surface. Buyers are quietly stepping in even as the price consolidates.

This kind of divergence often appears before a breakout. Combined with the whale activity, it shows that accumulation may already be underway.

On-Balance Volume (OBV) tracks whether volume is flowing into or out of a token, helping spot hidden trends.

For token TA and market updates: Want more token insights like this? Sign up for Editor Harsh Notariya’s Daily Crypto Newsletter here.


The Wedge Breakout Could Ignite the Next Leg for ENA’s Price, But $0.60 Is Key

Technically, ENA has been trading inside a wedge since late June. However, just to add another layer of validation, the chart uses the trend-based Fibonacci extension tool. This tool or indicator is used to chart price targets during an uptrend.

The first point of the Fibonacci extension plotting began near $0.22 and extends to a recent swing high around $0.59. Yesterday, ENA retraced to $0.42, but today it’s bouncing back hard and hovering just under the breakout zone.

ENA price analysis
ENA price analysis: TradingView

The big number to watch now is $0.60. That’s the 0.5 Fibonacci extension level from the recent trend. A clean breakout above the wedge at $0.58, followed by the $0.60 mark, could unlock a rally toward $0.65, $0.71, or even beyond. More so with the current whale and volume backing.

However, here’s the catch. If ENA fails to break out and drops back below $0.51, the bullish case weakens. That would invalidate the wedge breakout thesis and could trigger a pullback.

The post Ethena (ENA) Pumps 20% On A Dull Day—Charts Hint at More Upside appeared first on BeInCrypto.