Stablecoin Summer: Hong Kong and US Regulatory Convergence Sparks Market Euphoria

Global stablecoin infrastructure undergoes unprecedented transformation as Hong Kong’s Stablecoin Ordinance approaches August 1 implementation and the U.S. GENIUS Act catalyzes institutional adoption.

Consequently, synchronized regulatory frameworks across both jurisdictions trigger extraordinary market responses and strategic institutional positioning.

Market Euphoria Meets Regulatory Scrutiny

Traditional financial institutions in Hong Kong position themselves within the emerging digital asset infrastructure. Market dynamics reveal significant speculation surrounding regulatory opportunities. Over fifty companies express licensing interest, spanning mainland Chinese state enterprises to technology giants. However, most applicants lack substantive use cases or technical capabilities.

Meanwhile, Hong Kong Monetary Authority Chief Eddie Yue warns against excessive market optimism. Initial licensing approvals will remain highly selective, potentially numbering single digits. Regulatory standards emphasize anti-money laundering compliance and robust technical implementation.

Strategic Positioning Beyond Immediate Gains

Nevertheless, the Stock market performance demonstrates stablecoin narrative power. Companies announcing licensing preparations experience dramatic price increases, with some achieving multi-fold gains. OSL Group, OKX Chain, and Winsway Enterprise lead sector appreciation.

Strategic considerations extend beyond Hong Kong dollar implementations toward yuan-denominated infrastructure. Chinese tech giants JD.com and Ant Group actively lobby Beijing for offshore yuan stablecoin authorization, viewing dollar-dominated markets as strategic threats. These discussions reflect growing urgency around yuan internationalization amid expanding USDT adoption by Chinese exporters.

The licensing framework demands substantial capital commitments and ongoing compliance costs. Companies require HK$25 million paid-up capital alongside comprehensive risk management systems. Market observers anticipate continued speculation until licensing clarity emerges.

US GENIUS Act Catalyzes Global Momentum

The United States provides additional catalyst through President Trump’s July 18 signing of the GENIUS Act. This comprehensive stablecoin legislation establishes dual federal-state chartering pathways and monthly attestation requirements. Market capitalization surged $4 billion within one week, demonstrating institutional confidence in regulatory clarity.

The legislation enables broader institutional participation through bank-chartered stablecoin issuance. Circle, Paxos, and JPMorgan’s Kinexys position themselves as primary beneficiaries under new frameworks. Cross-venue liquidity expansion across Base and Solana networks reflects enhanced compliance infrastructure.

Stablecoins already process more annual settlement volume than Visa and Mastercard combined. With formal regulatory rails established, traditional financial institutions can integrate tokenized cash solutions. The Treasury must publish technical reserve-report schemas within 180 days, while CFTC oversight encompasses automated compliance mechanisms.

Sangho Hwang contributed.

The post Stablecoin Summer: Hong Kong and US Regulatory Convergence Sparks Market Euphoria appeared first on BeInCrypto.

New All-Time High In Sight? What To Expect From Ethereum In August

Ethereum (ETH) price is flirting with the $4,000 level once again, rising over 2.5% in the past 24 hours and trading near $3,877. That has reignited hopes of a new leg higher and possibly a fresh all-time high.

The setup might feel familiar, but the backdrop this time is very different. As July draws to a close, ETH finds itself caught in a web of converging catalysts: heavy leveraged bets, deep-pocketed ETF inflows, thinning exchange supply, and rising strength versus Bitcoin. And all of it sets the stage for a potentially explosive August. Fingers crossed!

Leverage Stack is Heavy Below: Can ETF Inflows Stabilize the Zone?

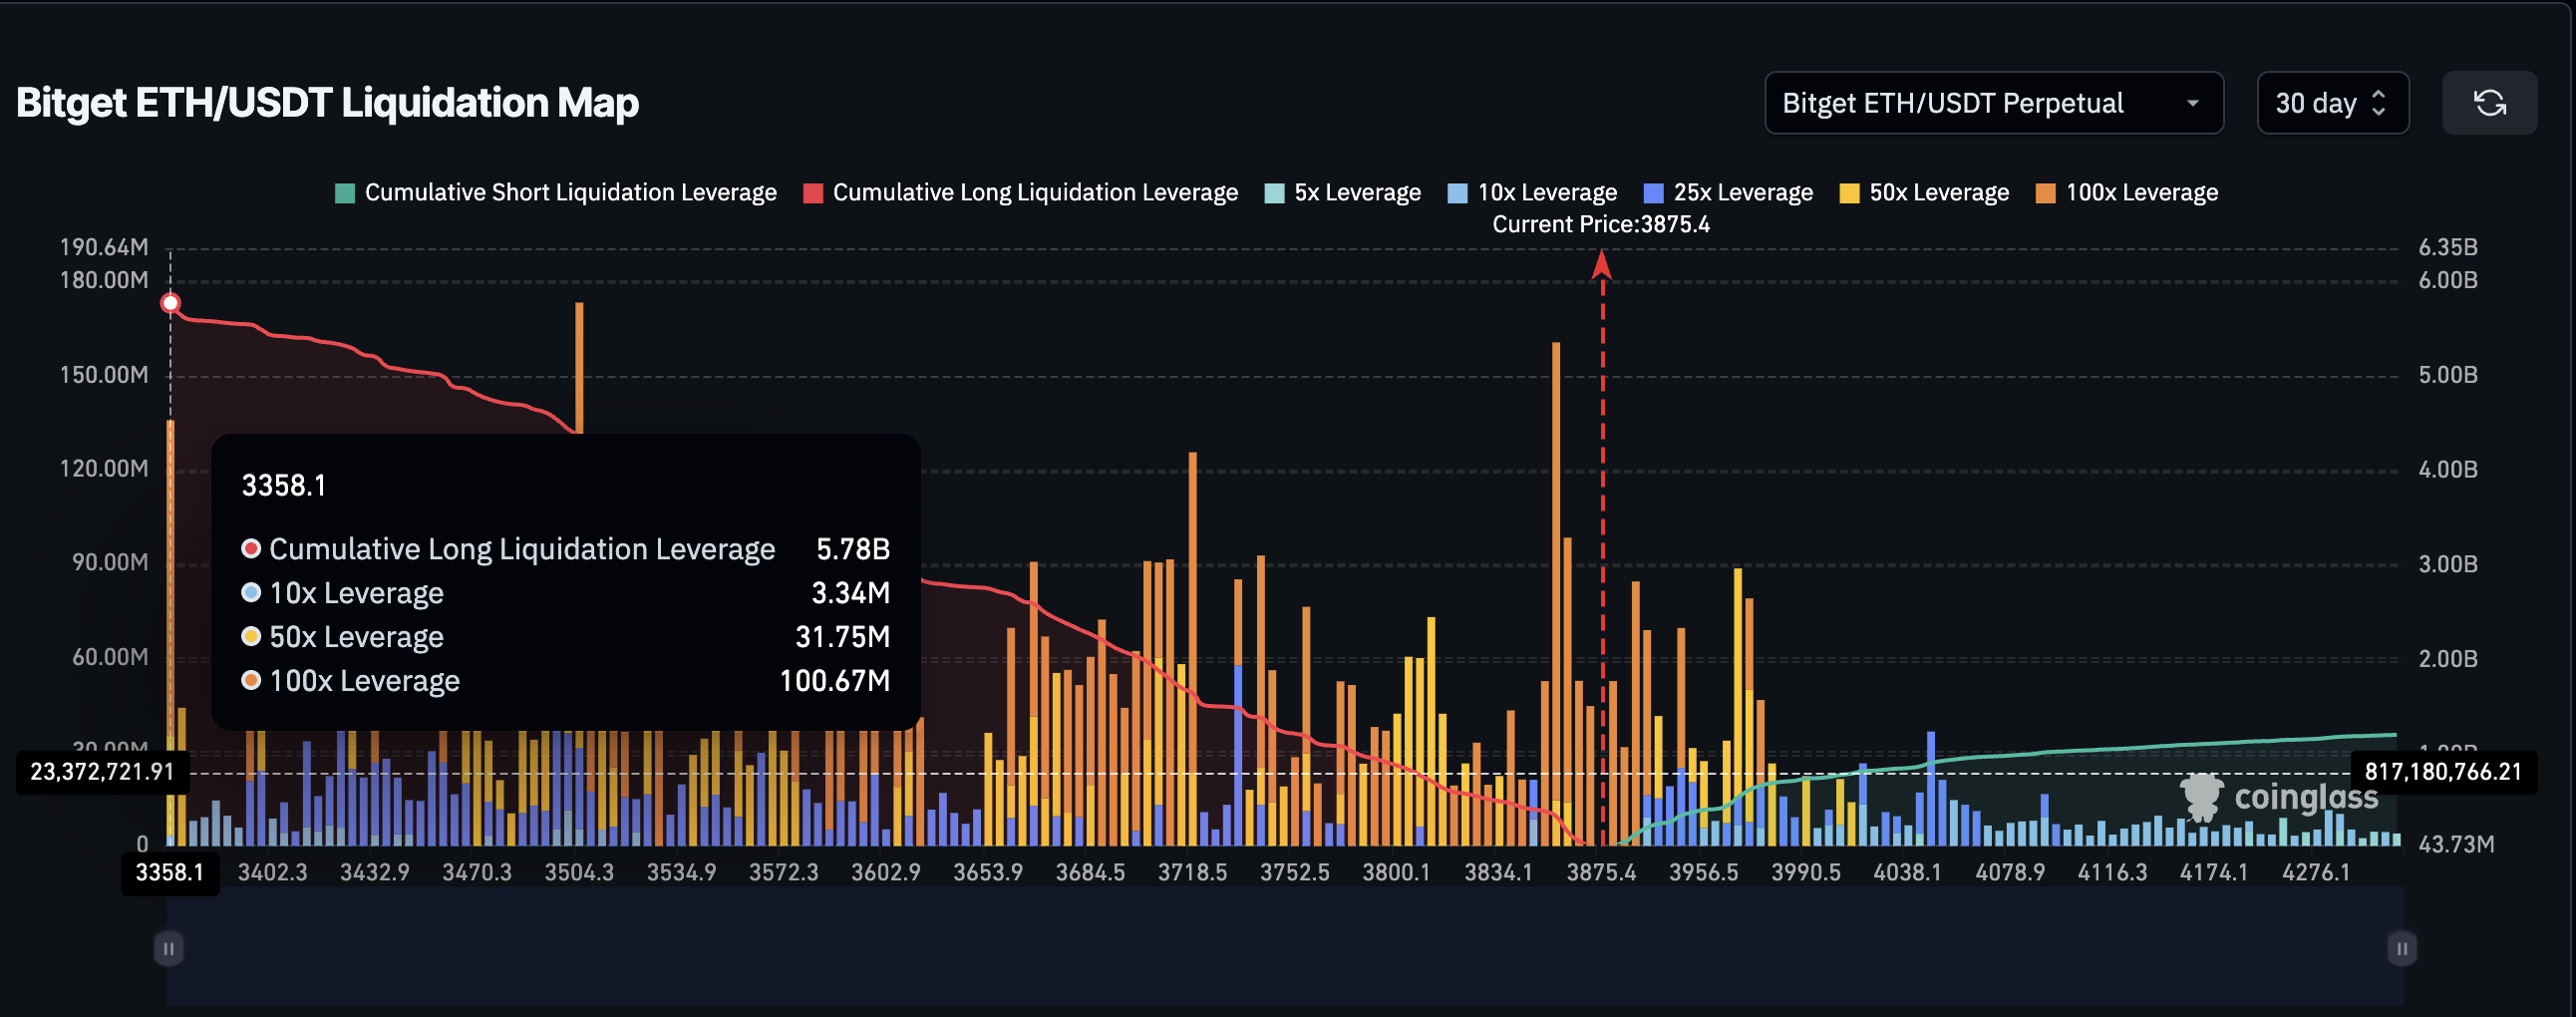
According to the latest Bitget ETH/USDT liquidation map, over $5.78 billion in cumulative long leverage is currently stacked between $3,358 and $3,875. With ETH trading right around the upper end of this zone, it’s hovering near a danger pocket.

A push higher could flip this zone into a price launchpad; or, if it slips, it could trigger a cascade of liquidations.

ETH liquidation map
ETH liquidation map: Coinglass

What makes this cluster different from previous leverage buildups is the kind of money backing it.

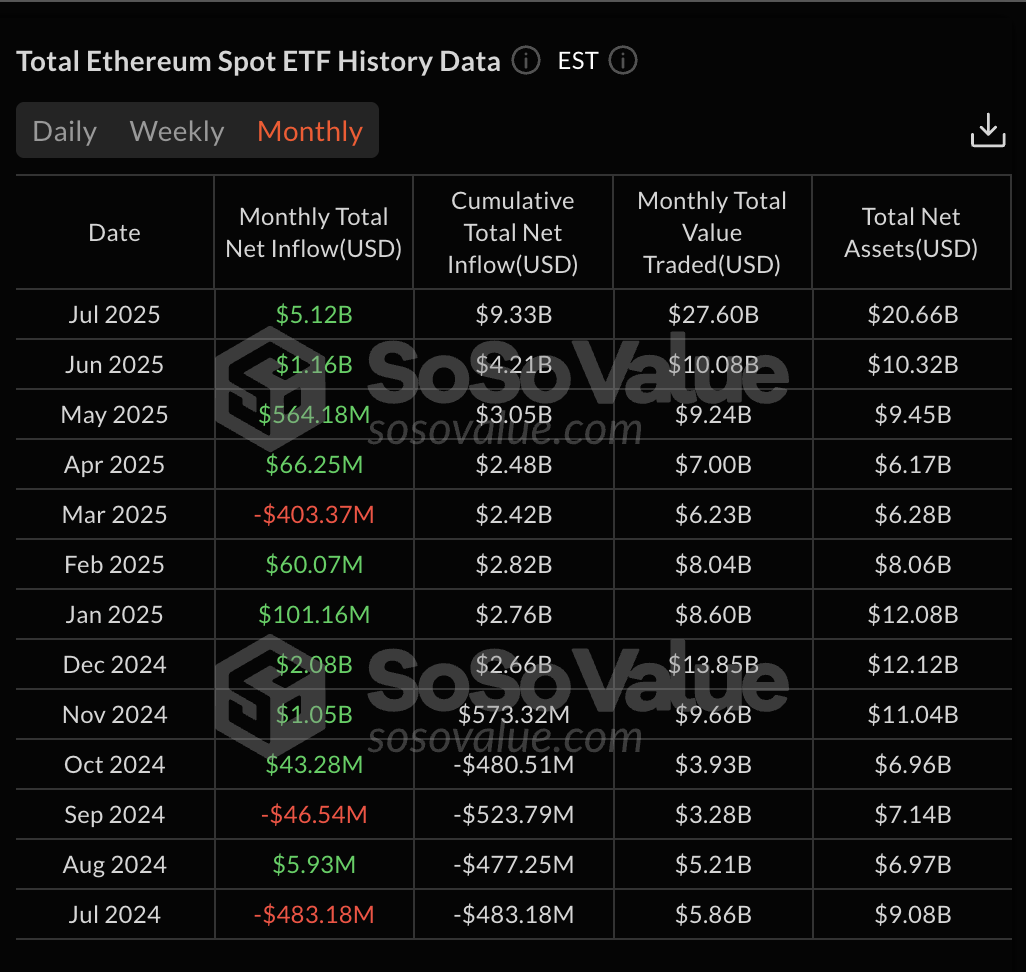
In July 2025, ETH ETFs (Exchange Traded Fund) recorded $5.12 billion in net inflows, the highest monthly tally over the past year, in dollar terms. This isn’t just retail. It’s institutional firepower piling in, showing up both in spot allocations and, clearly, in derivatives.

ETH ETF inflows in USD
ETH ETF inflows in USD: SoSo Value

That conviction is what gives bulls some breathing room in what would otherwise be a high-risk leverage trap. There is no good reason to believe that the July ETF fever won’t trickle down to August.

Should ETH reclaim $3,900 with momentum, it could trigger a forced short squeeze, especially with $1 billion+ in short positions waiting to be taken out. Yes, even short positions are considerable.

Exchange Reserves Add Another Bullish Layer

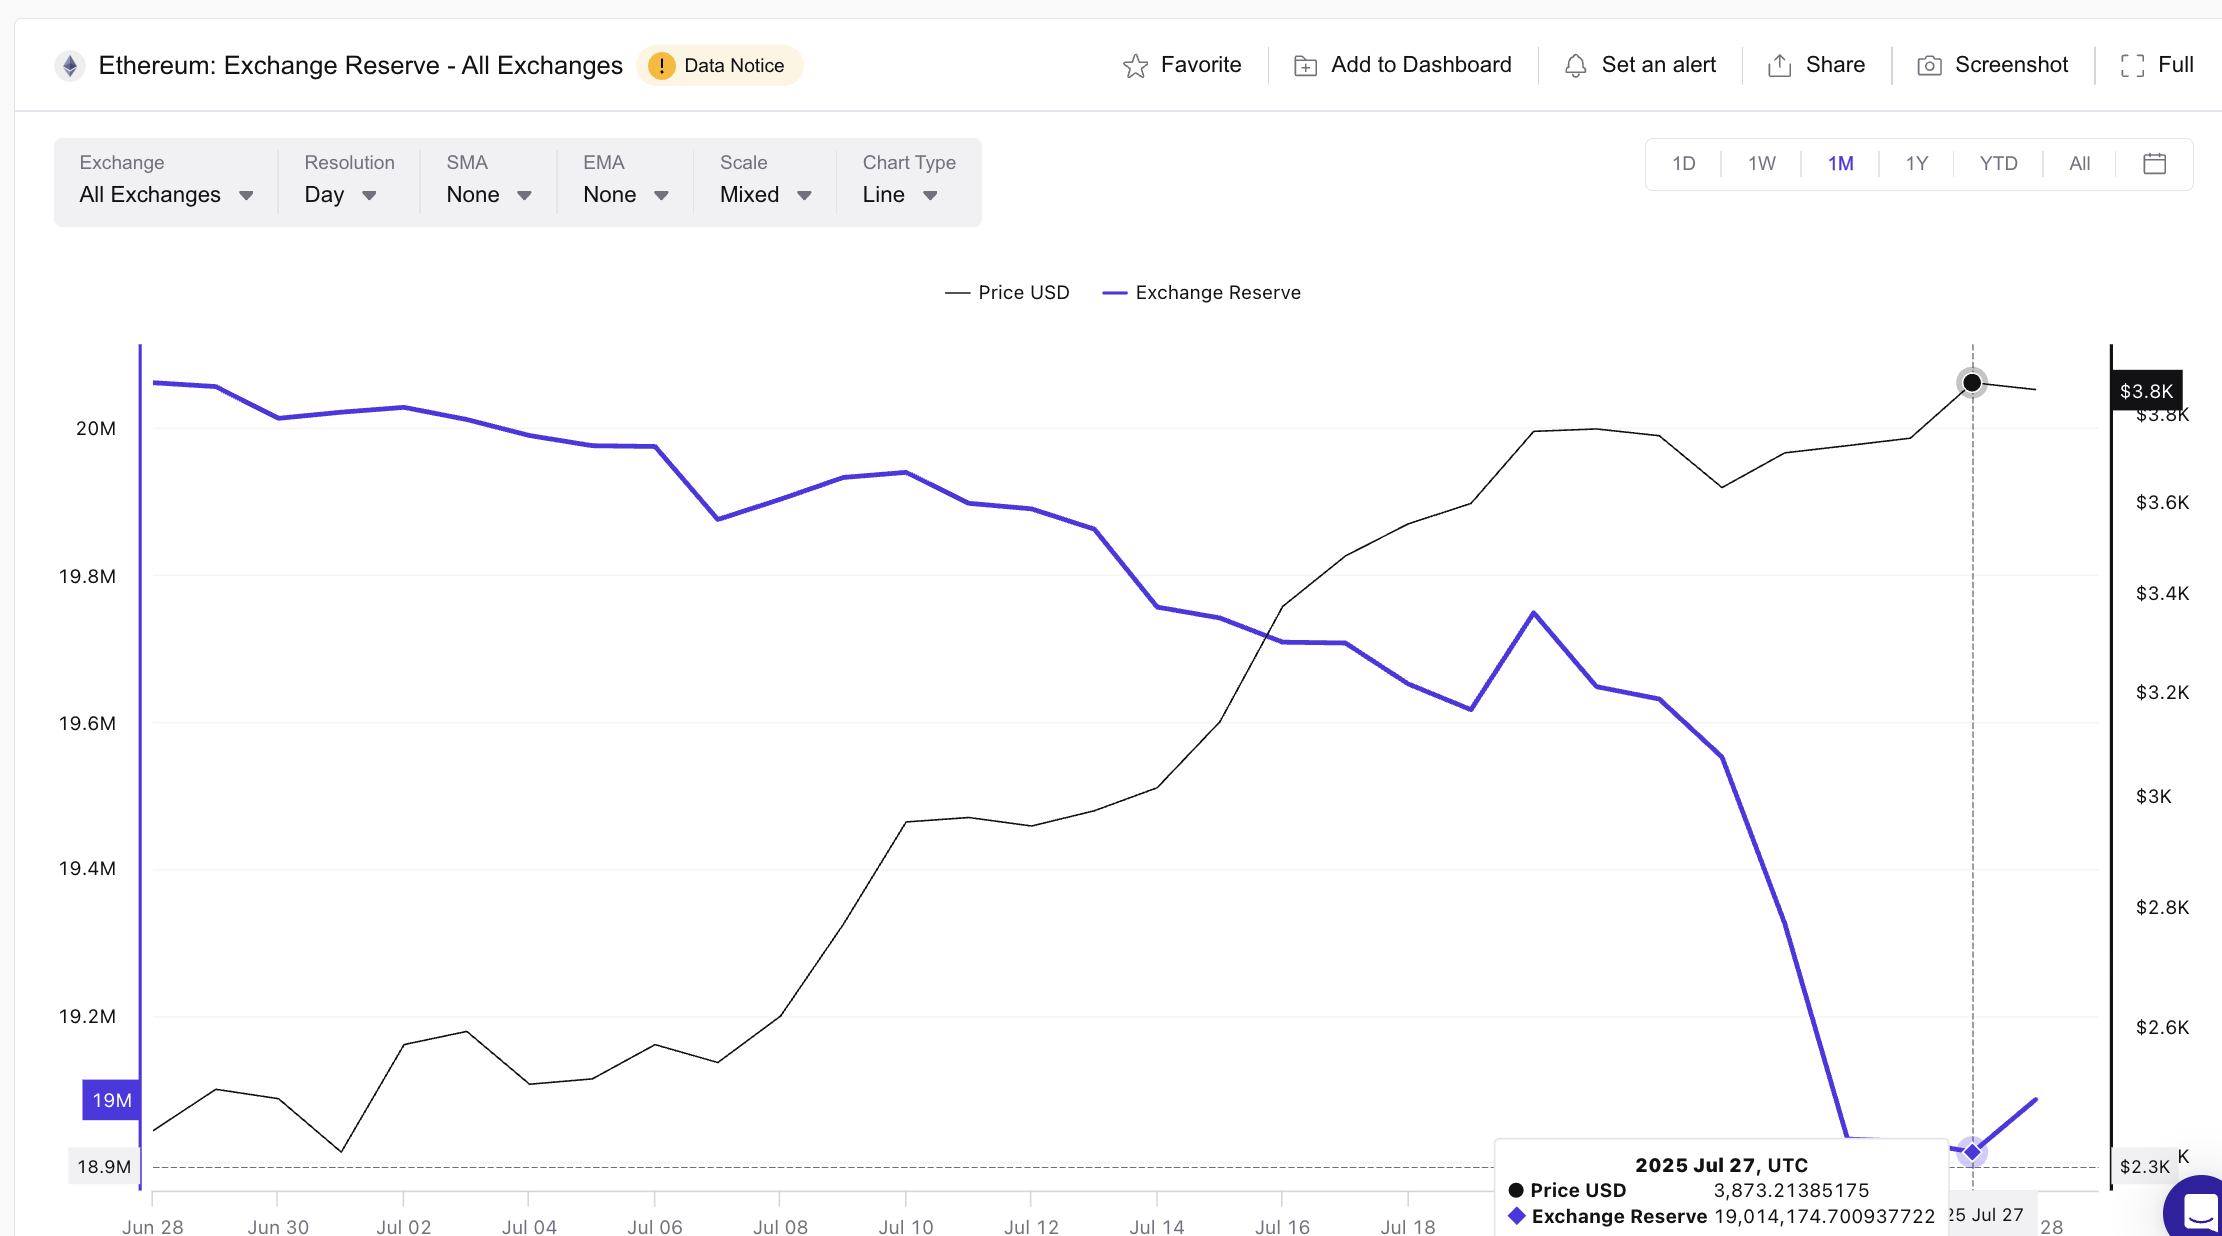
Adding to the bullish narrative is the low exchange reserve data. Despite ETH gaining over 57% from last month’s lows, exchange holdings haven’t increased. In fact, monthly exchange reserves are at their second-lowest point in over a year.

Ethereum price and exchange reserve
Ethereum price and exchange reserve: Cryptoquant

This isn’t just about low supply. What’s more striking is that despite large wallets selling, reserves haven’t spiked.

This suggests supply absorption, where retail and institutional demand are soaking up the sell-side pressure.

When ETF money is entering and exchange reserves are shrinking during a price rise, the takeaway is simple: conviction is strong, and sellers are being outpaced.


ETH/BTC Ratio Surges; Altseason in the Air?

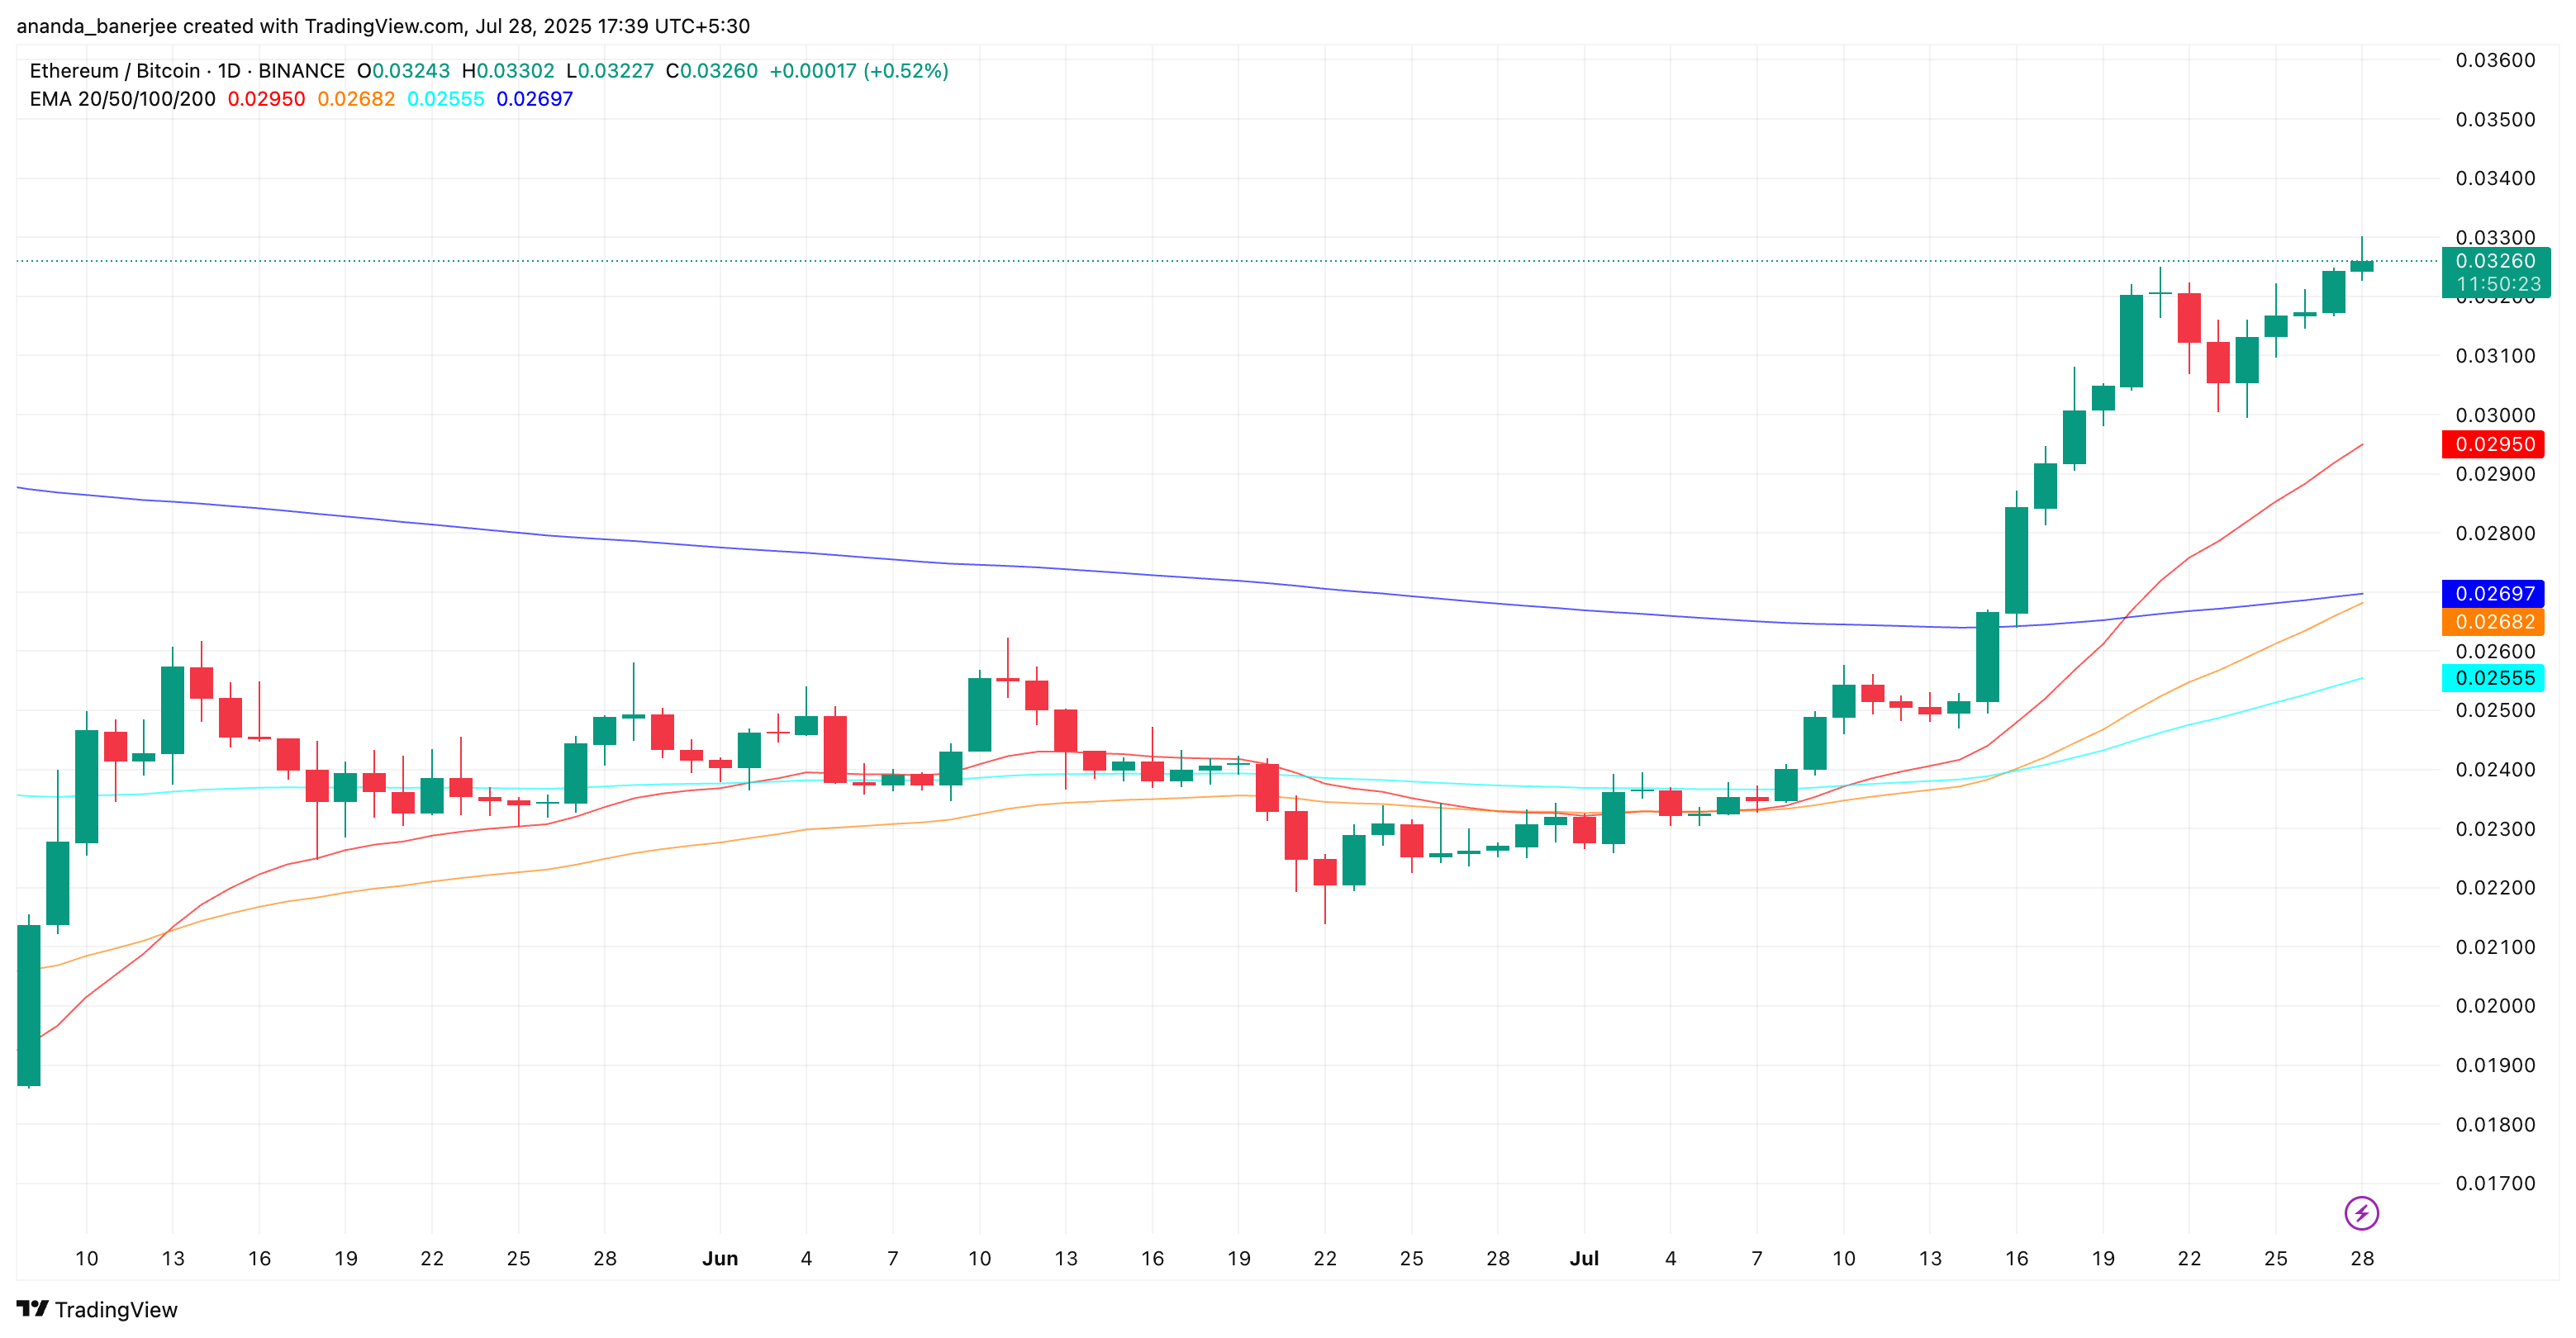
Zooming out, the ETH/BTC ratio is telling its own bullish story. The pair has climbed to 0.032, up nearly 40% from June’s lows, and now sits at the brink of completing a rare sequence of golden crossovers across the 20D, 50D, 100D, and 200D EMAs (Exponential moving averages).

ETH/BTC ratio
ETH/BTC ratio: TradingView

Only one move remains: the 50-day EMA (orange) overtaking the 200-day (blue). Once that happens, it would confirm a full-fledged bullish structure; the same kind that historically precedes extended altcoin runs.

Given the context: strong ETF inflows, thinning exchange reserves, and long leverage stacks — this crossover wouldn’t just be symbolic. It could be the technical validation bulls need to extend momentum deeper into August.


Ethereum Price Action: Key Resistance Defines the Battle Zone

With Ethereum’s outperformance against Bitcoin gaining traction, that strength may soon spill over into ETH/USD price action. The ETH/BTC ratio has historically acted as a lead indicator for USD breakouts, and with a golden crossover nearly complete, ETH’s momentum looks ready to shift gear

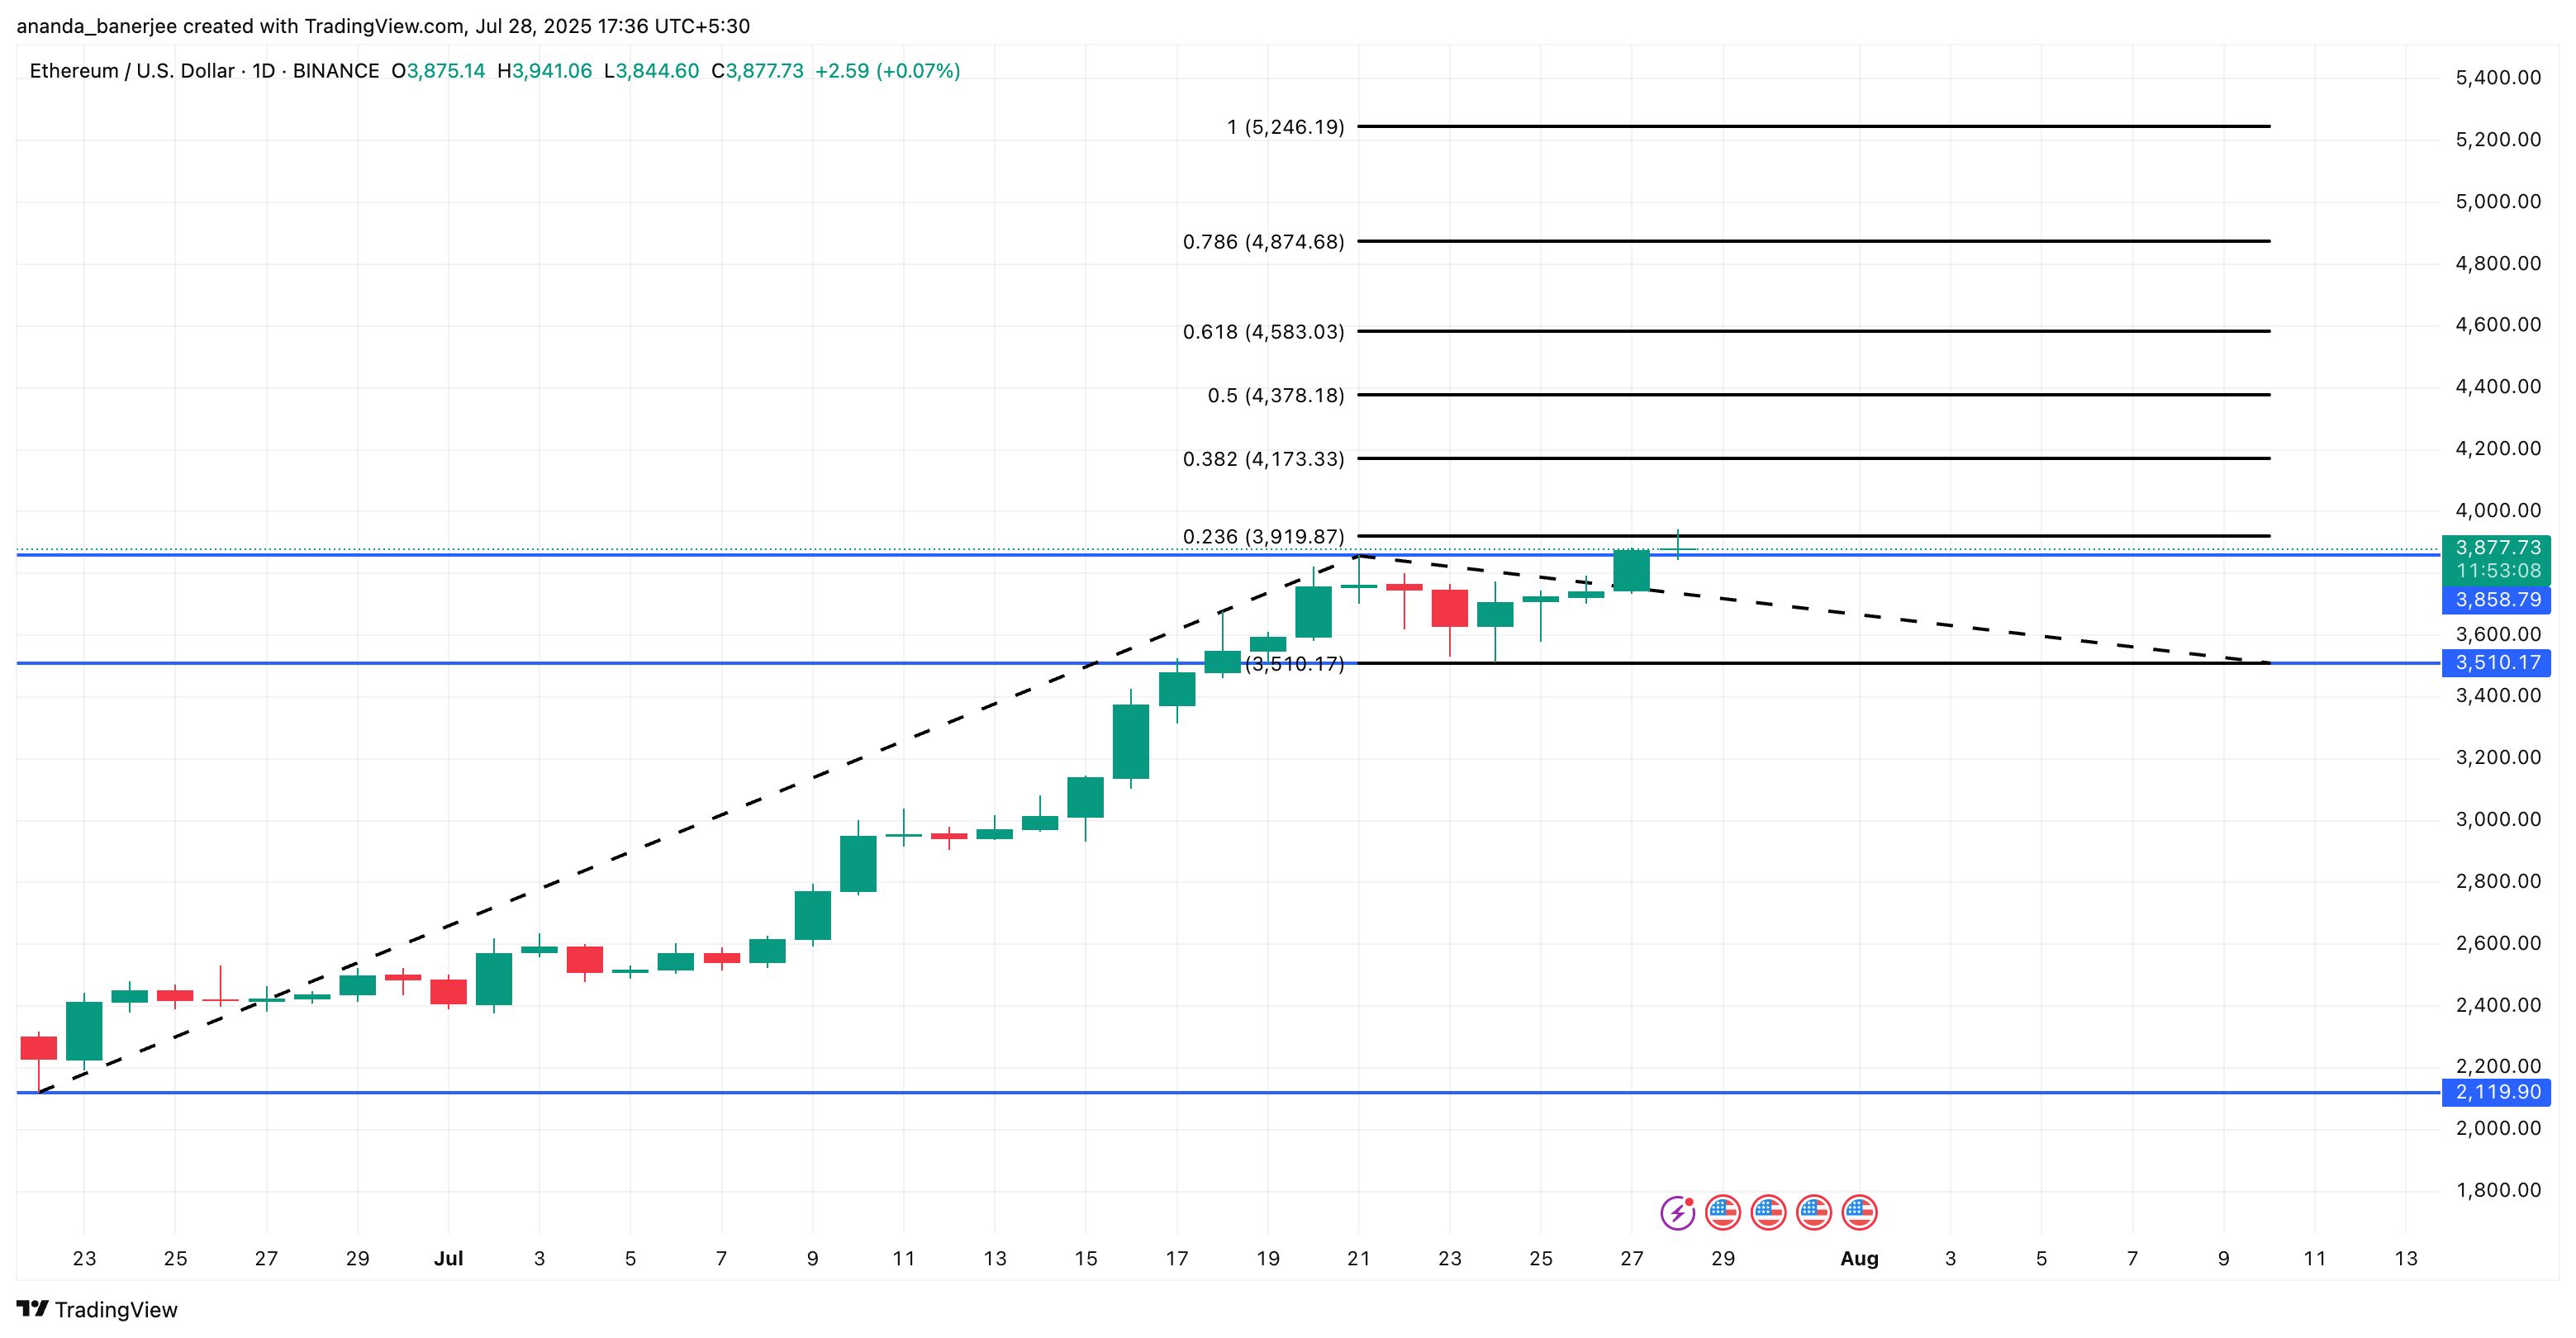
ETH is now pressing against the 0.236 Fibonacci extension level at $3,919. A clean break and daily close above this could ignite upside momentum, with targets at:

  • $4,173 (0.382 Fib)
  • $4,378 (0.5 Fib)
  • $4,583 (0.618 Fib)
  • $4,874 (0.786 Fib)

A move above $4,874 would prime the Ethereum price for a new all-time high (ATH). And with ETH doing a 55% rally in July alone, the “ATH” probability looks increasingly possible.

ETH price analysis
ETH price analysis: TradingView

However, a failure to hold above $3,919 would stall the rally, leaving ETH vulnerable to a retest of support around $3,510; the trendline invalidation level. That’s the line bulls need to defend to avoid re-entering a broader consolidation range. And remember, price drips can trigger the liquidation levels that were discussed earlier.

For token TA and market updates: Want more token insights like this? Sign up for Editor Harsh Notariya’s Daily Crypto Newsletter here.

The post New All-Time High In Sight? What To Expect From Ethereum In August appeared first on BeInCrypto.
Coinbase’s Roadmap Update Sparks Price Gains for 2 Altcoins

Coinbase, one of the leading cryptocurrency exchanges, has announced the addition of Bio Protocol (BIO) and Euler (EUL) to its asset listing roadmap. 

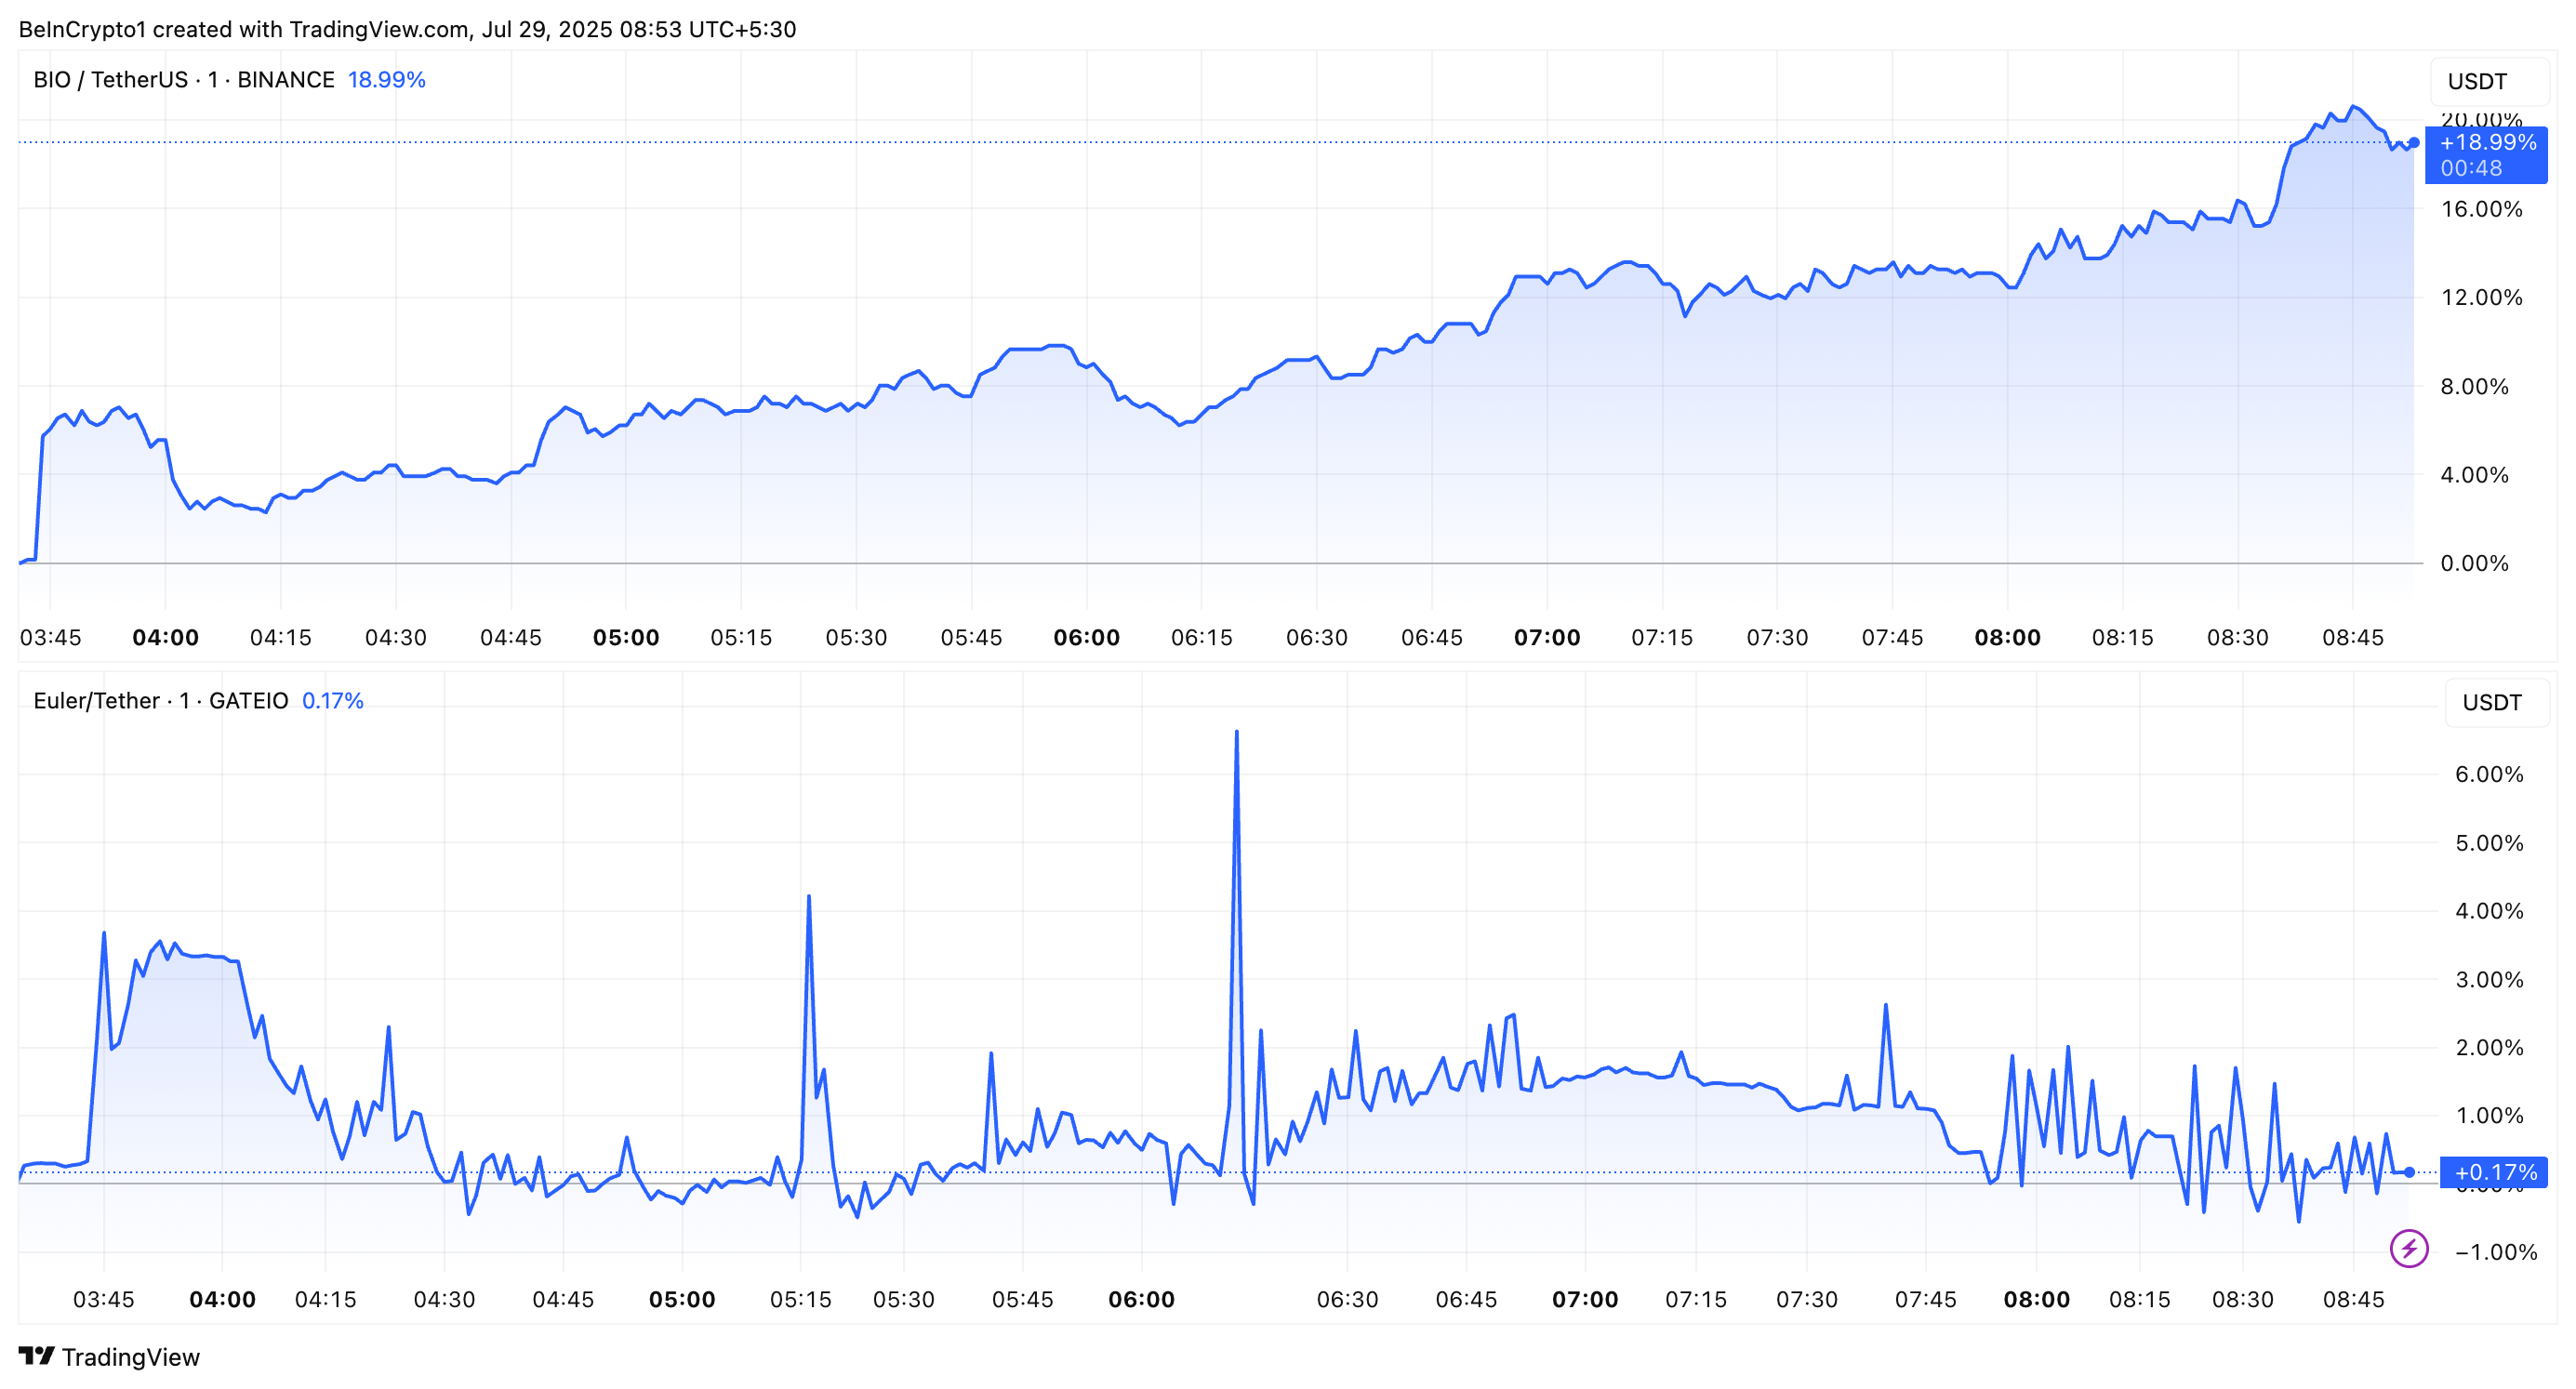
The announcement, posted on X, has triggered significant market reactions, with both assets experiencing notable price increases.

Bio Protocol and Euler Join Coinbase’s Listing Roadmap 

The exchange notified users that the launch of trading for BIO and EUL remains contingent on market-making support and sufficient technical infrastructure. Coinbase will provide a separate announcement once these conditions are met, which is a standard procedure to manage expectations and mitigate risks for users

It also cautioned that depositing these assets before an official listing could result in permanent loss of funds. Meanwhile, BIO, an Ethereum-based ERC-20 token with the contract address 0xcb1592591996765ec0efc1f92599a19767ee5ffa, saw an immediate surge following the news. 

The token’s price rose from $0.0612 to $0.0669, marking a 9.31% increase. The uptrend continued. Furthermore, at the time of this report, BIO was trading at $0.0733, reflecting an 18.99% gain since the announcement. 

BIO and EUL Price Performance Post Coinbase Listing Roadmap Addition

EUL, another ERC-20 token with the contract address 0xd9fcd98c322942075a5c3860693e9f4f03aae07b, experienced an even sharper initial spike. 

The token jumped from $13.51 to $16.50 , quickly post-announcement. This represented a 22.22% uptick. However, EUL quickly shed most of its gains, stabilizing at $13.52 by press time, a modest 0.17% rise.

This development follows a consistent pattern of Coinbase roadmap updates driving significant price movements. On July 25, the exchange added ResearchCoin (RSC) to its roadmap, triggering an approximately 82% price surge. 

Earlier last week, Coinbase included BankrCoin (BNKR), Jito Staked SOL (JITOSOL), and Metaplex (MPLX) in its roadmap, with similar market reactions reported. Notably, the exchange listed JITOSOL and MPLX shortly after. However, BNKR trading is yet to be announced.

The current roadmap now features QCAD (QCAD), BIO, EUL, BNKR, and RSC. 

“This is not an exhaustive list of all assets which we have decided to list. Any asset not referenced in the above lists does not preclude any such asset from potential listing,” Coinbase noted.

The exchange also emphasized that assets may be delayed or removed from consideration for listing due to various factors. Thus, the roadmap should not be relied upon as a guarantee or promise of listing.

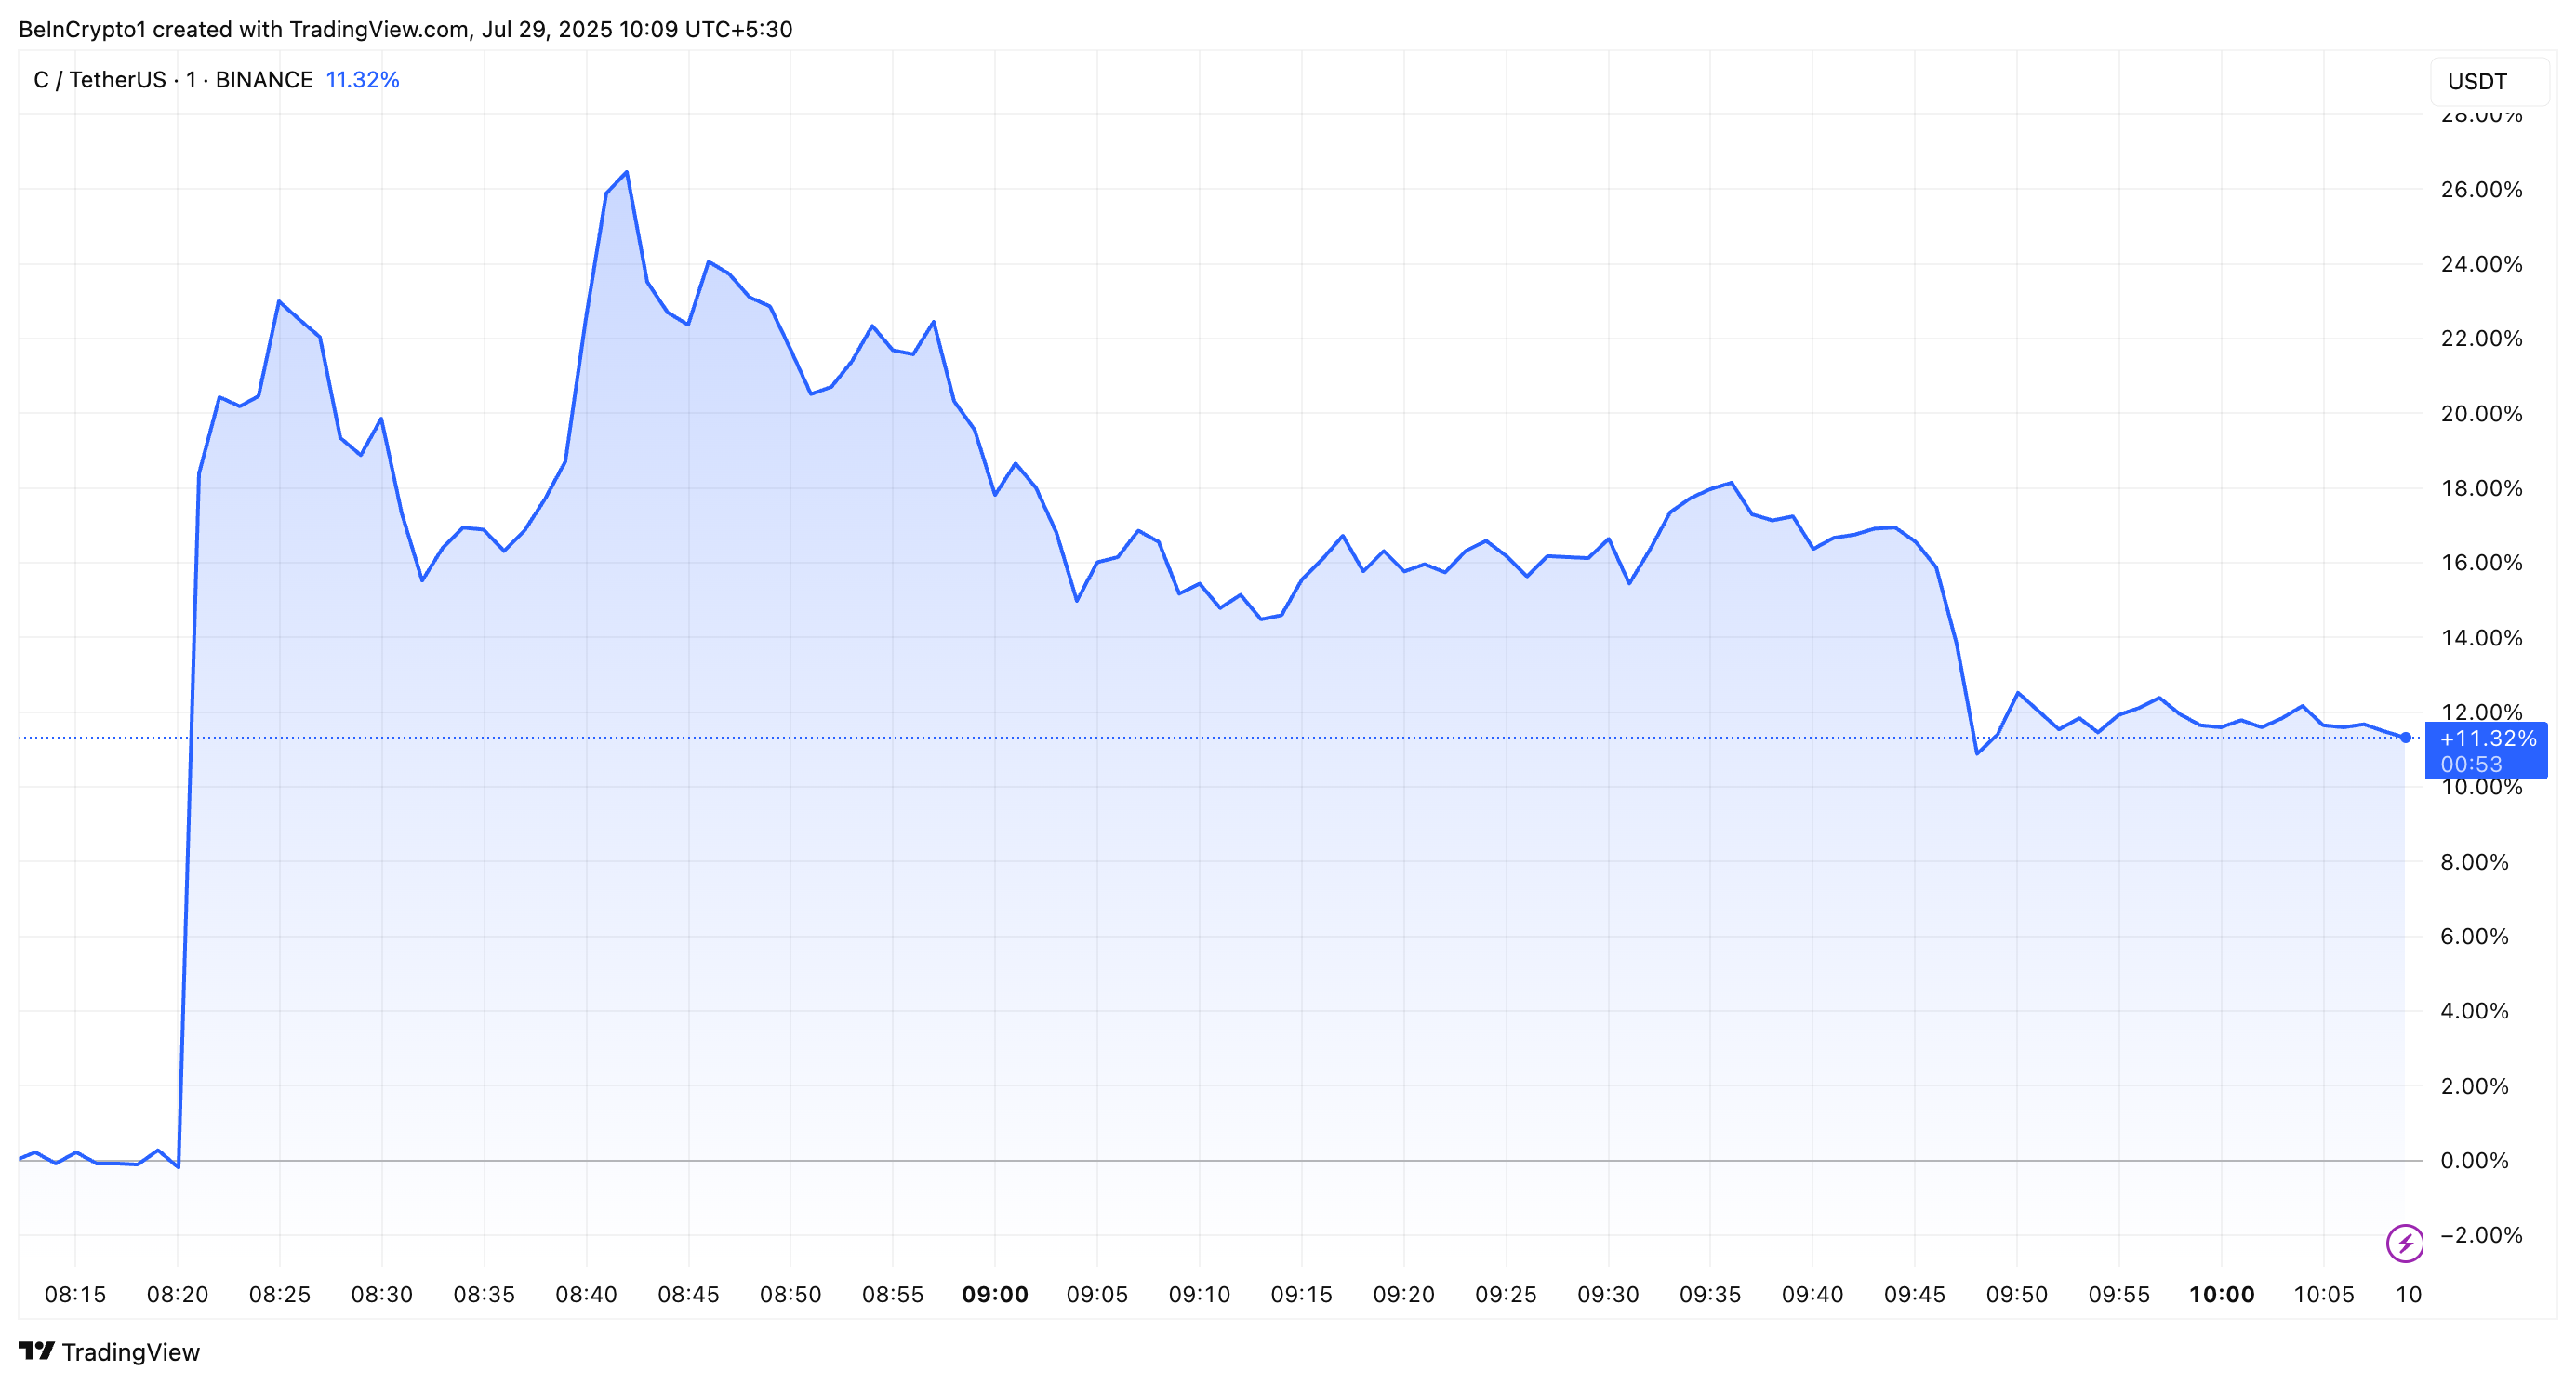
Bithumb Announces Chainbase (C) Listing

Notably, Coinbase isn’t the only exchange influencing prices. South Korean exchanges have also been significant drivers of price movements. For instance, in an official announcement today, Bithumb revealed that it will be listing Chainbase (C).

In the aftermath of this news, the price quickly rose by approximately 26.03%, increasing from $0.365 to $0.465. As of the latest update, the altcoin was trading at $0.404, reflecting an 11.3% gain.

Chainbase (C) Price Performance
Chainbase (C) Price Performance. Source: TradingView

The exchange confirmed that trading for C will begin on July 29 at 5:00 PM (KST), with the altcoin available for trading against the Korean Won (KRW). The base price is set at 526 KRW.

The post Coinbase’s Roadmap Update Sparks Price Gains for 2 Altcoins appeared first on BeInCrypto.
Bitcoin Price Poised To Form New Highs in August as Sell-Side Risk Remains Low

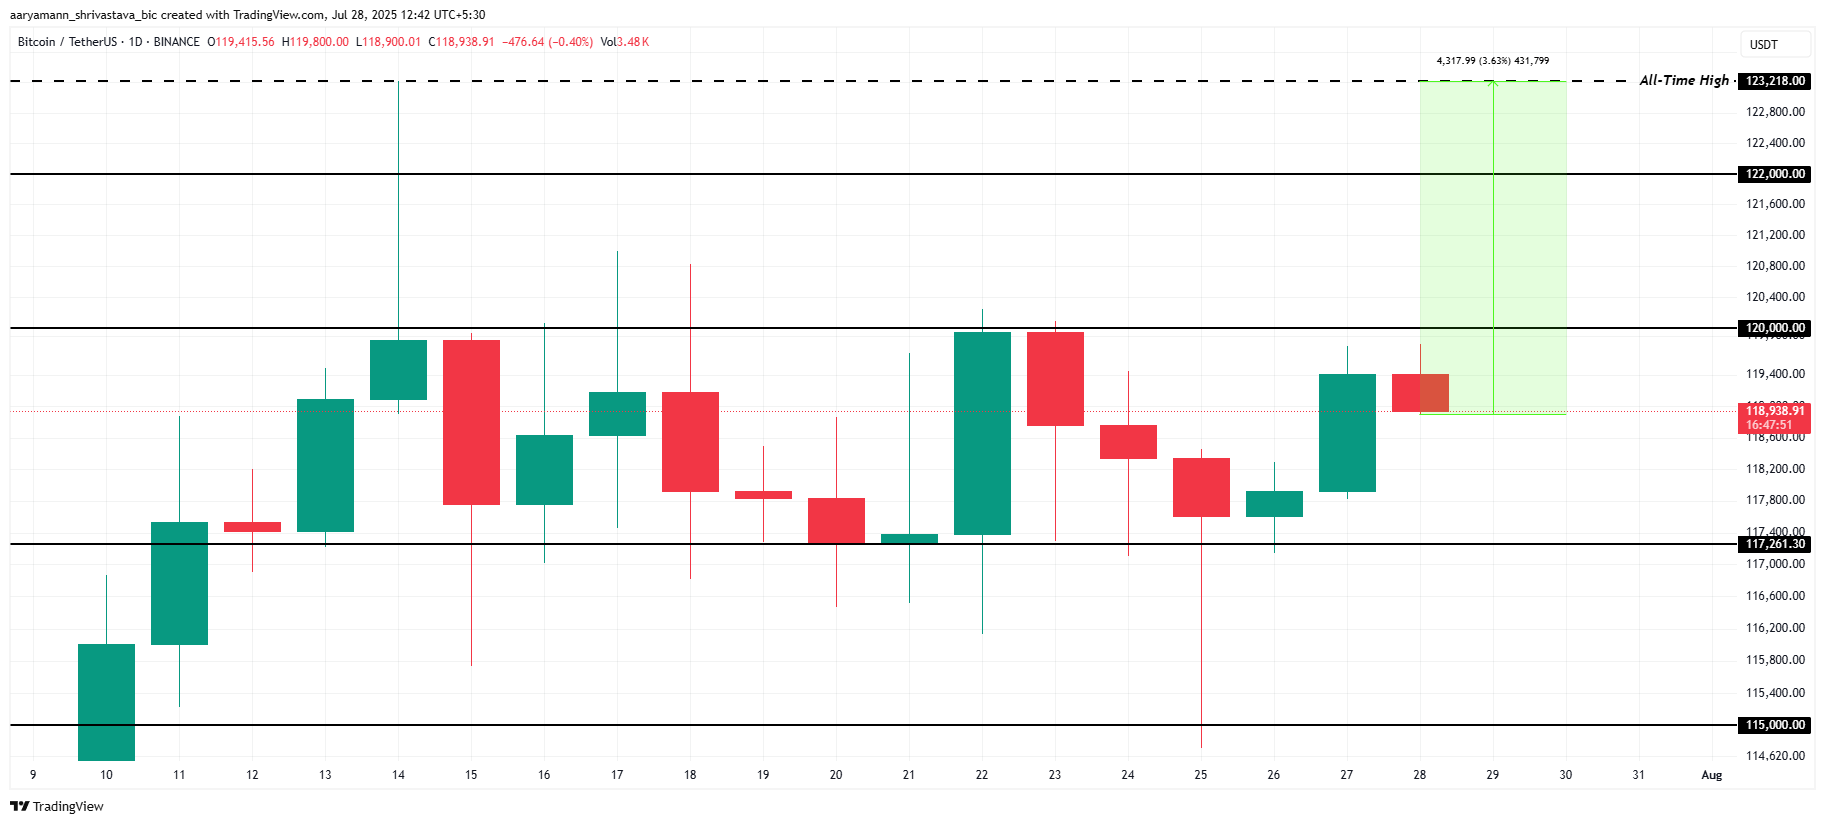
Bitcoin has experienced recent consolidation, with the cryptocurrency holding steady between $117,261 and $120,000 over the last two weeks. This stagnant price action has kept Bitcoin from reaching a new all-time high (ATH). 

However, signals in investor behavior suggest that the upcoming month could lead to a significant shift, potentially rewriting Bitcoin’s historical price patterns in August.

Bitcoin Investors Are Sending Positive Signals

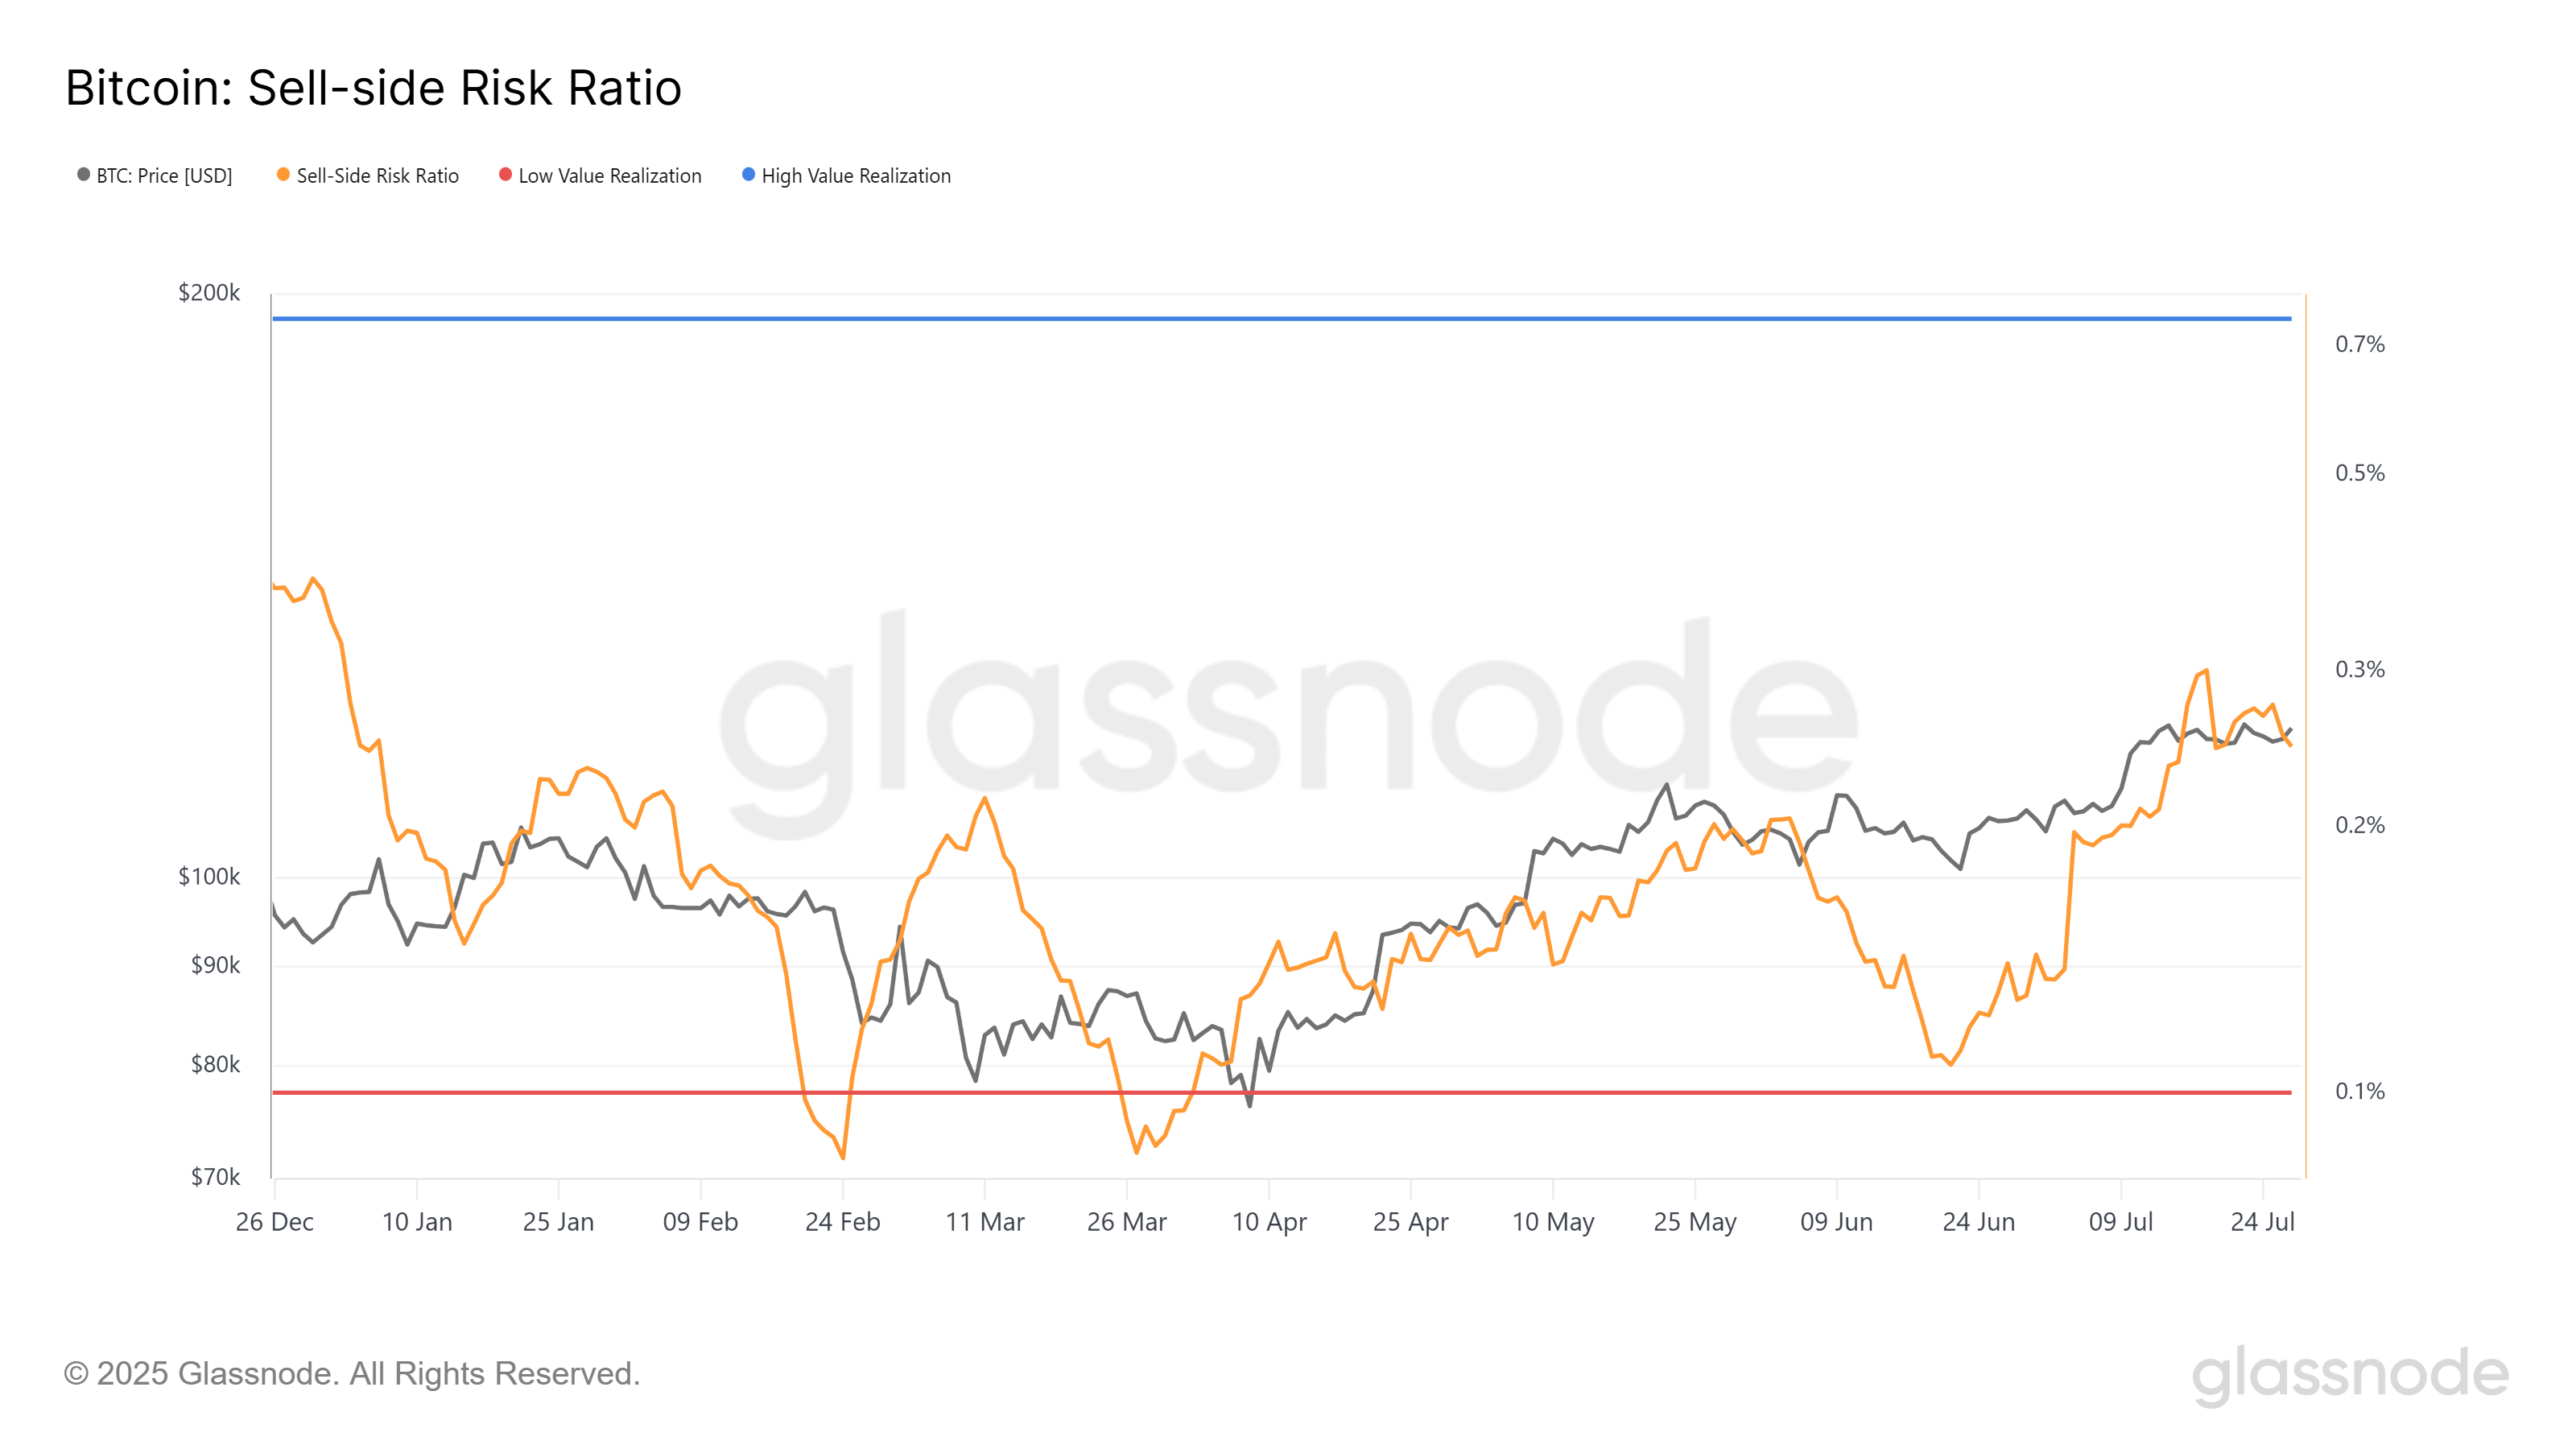
The current sell-side risk ratio for Bitcoin is at 0.24, marking a 6-month high. Nevertheless, it is well below the neutral threshold of 0.4 and closer to the low-value realization threshold of 0.1. This suggests that the market is experiencing consolidation, with investor behavior indicating a pause in large sell-offs. 

Historically, periods of low sell-side risk have signaled market bottoms or accumulation phases, where investors wait for a favorable moment to drive prices higher. This accumulation is important because it suggests that Bitcoin’s price may be primed for a shift.

For token TA and market updates: Want more token insights like this? Sign up for Editor Harsh Notariya’s Daily Crypto Newsletter here.

Bitcoin Sell-Side Risk Ratio
Bitcoin Sell-Side Risk Ratio. Source: Glassnode

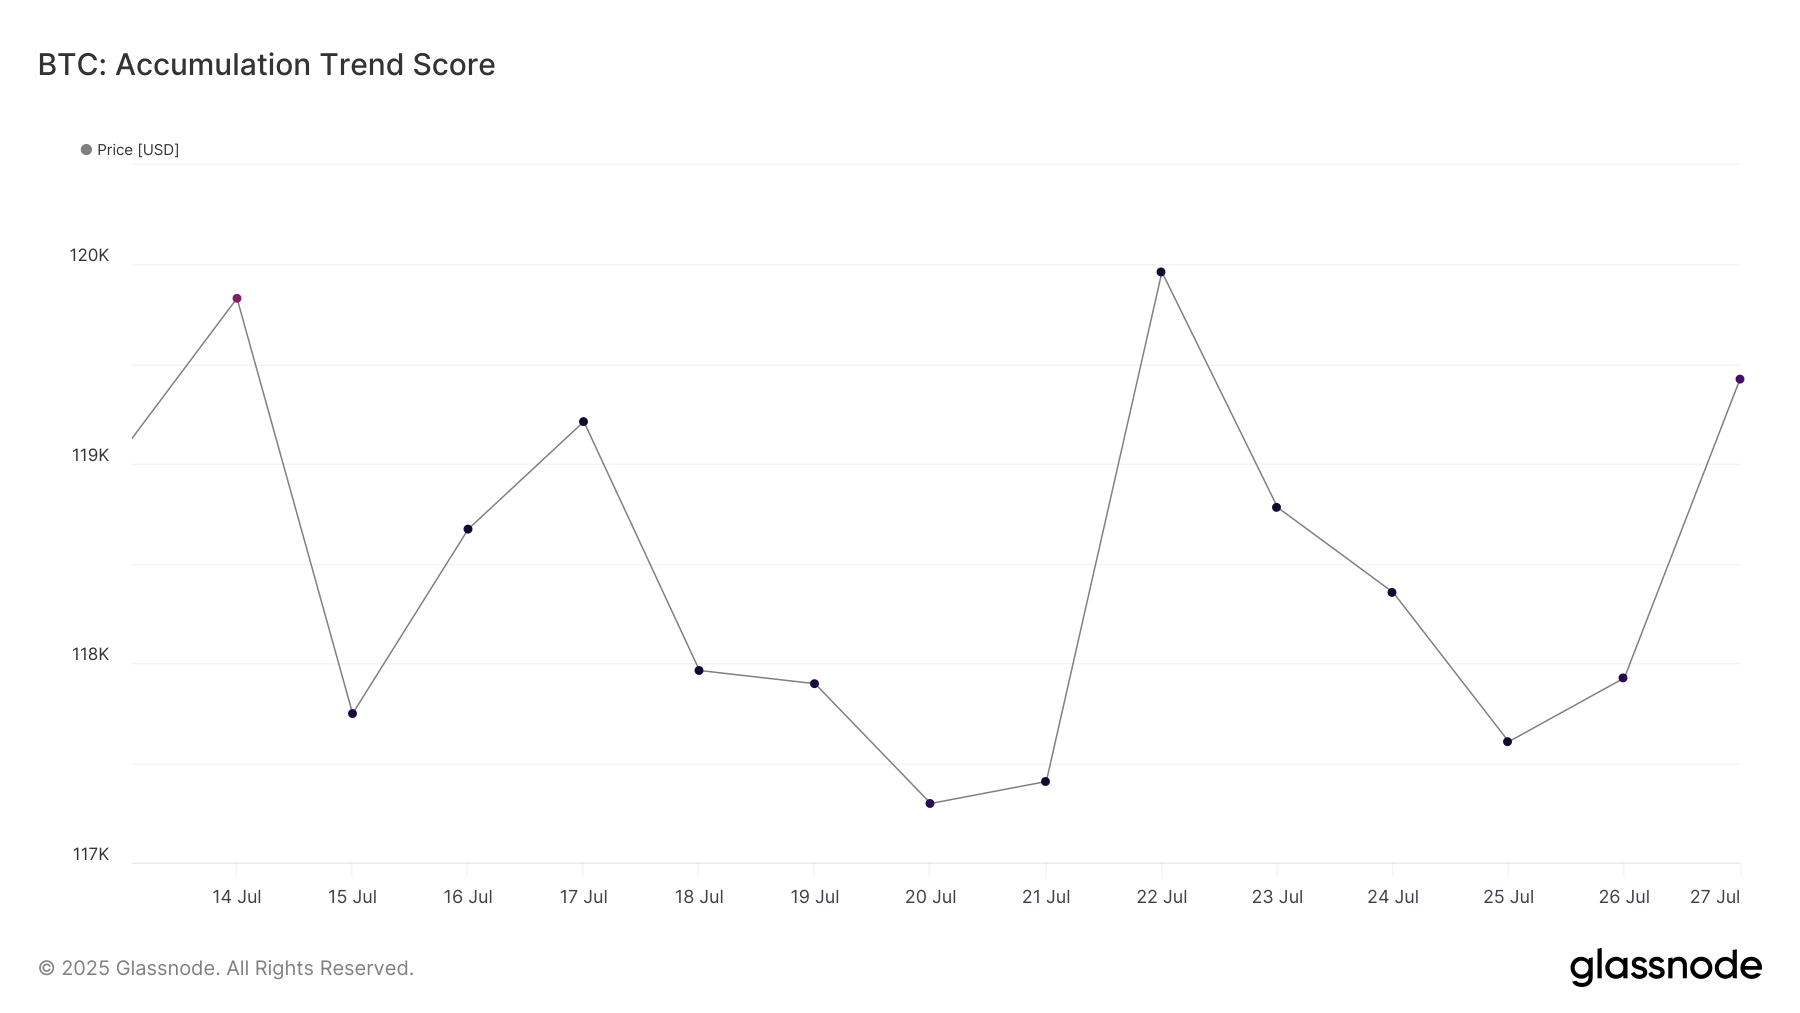
Bitcoin’s accumulation trend score is currently near 1.0 for the past two weeks, indicating that large holders, including whales, are actively accumulating Bitcoin. This trend is essential as these whales have significant influence over the price of the cryptocurrency. 

An accumulation score closer to 1 suggests a solid bullish momentum among institutional and high-net-worth investors. This could provide a solid base for Bitcoin to break through the resistance levels it has struggled with recently.

The steady accumulation by larger entities implies that there is growing confidence in Bitcoin’s long-term value. This could lead to an increase in Bitcoin’s price as more capital is injected into the market by investors.

Bitcoin Trend Accumulation Score
Bitcoin Trend Accumulation Score. Source: Glassnode

BTC Price Can Find Its Way To The ATH

Bitcoin’s price is currently hovering at $118,938, within a consolidation range between $117,261 and $120,000. While this range has held steady, the possibility of breaking through $120,000 is high if investor sentiment remains strong.

Historically, August has been a bearish month for Bitcoin, with the median monthly return sitting at -8.3%. However, given the current accumulation trend and the low sell-side risk, Bitcoin may defy its historical trend this year. If Bitcoin can secure $120,000 as support, it would likely push past $122,000 and move toward the ATH.

Bitcoin Price Analysis.
Bitcoin Price Analysis. Source: TradingView

However, there remains a risk that the market could turn bearish if investors shift their stance due to unforeseen market factors. In this case, Bitcoin could lose support at $117,261 and slide to $115,000, reversing the bullish thesis.

The post Bitcoin Price Poised To Form New Highs in August as Sell-Side Risk Remains Low appeared first on BeInCrypto.

US Economic Signals with Crypto Implications This Week

As July ends, traders and investors will keep an eye on August. They will watch several US economic signals that could influence their portfolios.

This week’s US economic signals are particularly important with Bitcoin (BTC) eyeing the $120,000 threshold.

US Economic Indicators That Could Impact Bitcoin This Week

The crypto market is up today, with Bitcoin leading the charge as it closes in on $120,000. However, whether this optimism is sustainable depends on how this week’s US economic signals unfold.

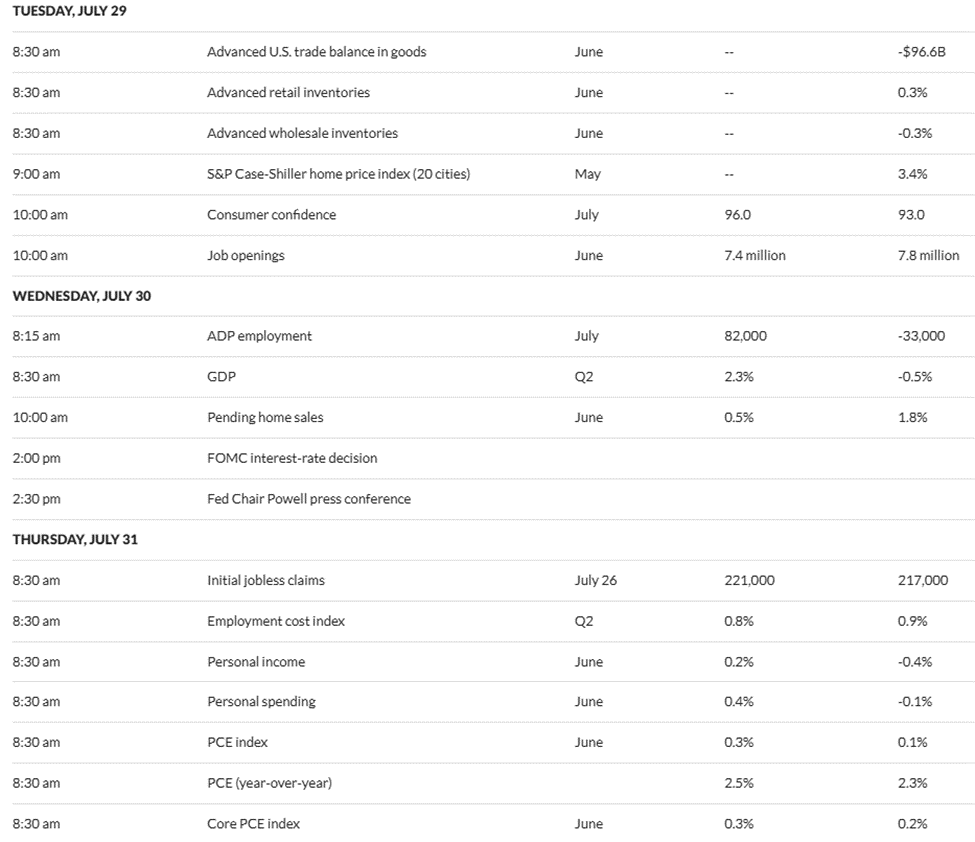
US Economic Signals this week
US Economic Signals this week. Source: MarketWatch

Consumer Confidence

The consumer confidence report is starting this week’s US economic signals, which are due on Tuesday. The Conference Board’s Consumer Confidence Index plummeted to 93.0 in June 2025, a 5.0-point drop from May (98.0).

According to data on MarketWatch, the median forecast is 96.0, suggesting economists are more optimistic for July. However, consumers express growing concerns amid Trump’s tariffs

“Consumers are unlikely to regain their confidence in the economy unless they feel assured that inflation is unlikely to worsen, for example if trade policy stabilizes for the foreseeable future,” Reuters reported, citing Joanne Hsu, the director of the Surveys of Consumers. 

This erosion of confidence suggests a reduced risk appetite. Pessimistic consumers are less likely to invest in speculative assets like Bitcoin, favoring safer options like bonds or cash. 

If the July consumer confidence rises above expectations, it could bolster risk appetite, potentially boosting crypto.

Jobs Reports

US labor data is one of Bitcoin’s most significant macro factors in 2025. This week’s US economic signals will feature several jobs reports, positioning Bitcoin for volatility.

The Job Openings and Labor Turnover Survey (JOLTS) report and Job Openings are due on Tuesday and will be released by the US Bureau of Labor Statistics (BLS).

JOLTS

The June JOLTS report, due on Tuesday, is projected to come in lower than the 7.8 million recorded in May. According to economists surveyed by MarketWatch, data on job openings, hires, and separations in the US could come in at 7.4 million.

Despite the projected drop, a 7.4 million reading would still exceed the multi-month low of 7.192 million recorded in March. Notwithstanding, it remains the key highlight of this week’s US economic indicators.

ADP Employment

Another labor market data point to watch this week is the July ADP employment report. The BLS report, which is more comprehensive and widely regarded as the official measure, indicated that private-sector employment dropped by 33,000 jobs in June 2025.

The figure was significantly lower than economists’ expectations of a 95,000 job increase, with the decline suggesting a slowdown in hiring. Data on MarketWatch shows that economists projected 82,000 job increases in July, which would still be lower than the previous reading.

Initial Jobless Claims

Another labor market data feature among US economic signals this week is the initial jobless claims, due on Thursday. This weekly jobs data highlights the number of US citizens who filed for unemployment insurance the previous week.

Initial jobless claims came in at 217,000 in the week ending July 19, but economists anticipate better prospects for the week ending July 26 and anticipate up to 221,000 applications.

An uptick in jobless claims may signal economic weakness. This would increase the likelihood of the Fed adopting a more accommodative monetary stance.

Such a shift could lead to a weaker dollar, enhancing Bitcoin’s attractiveness as an alternative asset. However, if the rise in claims is viewed as a temporary fluctuation, the impact on Bitcoin may be limited.

Meanwhile, analysts say a resilient labor market, coupled with sticky inflation, could allow interest rates to remain elevated. However, signs of a cooling job sector could temper the Fed’s path.

Non-Farm Payrolls

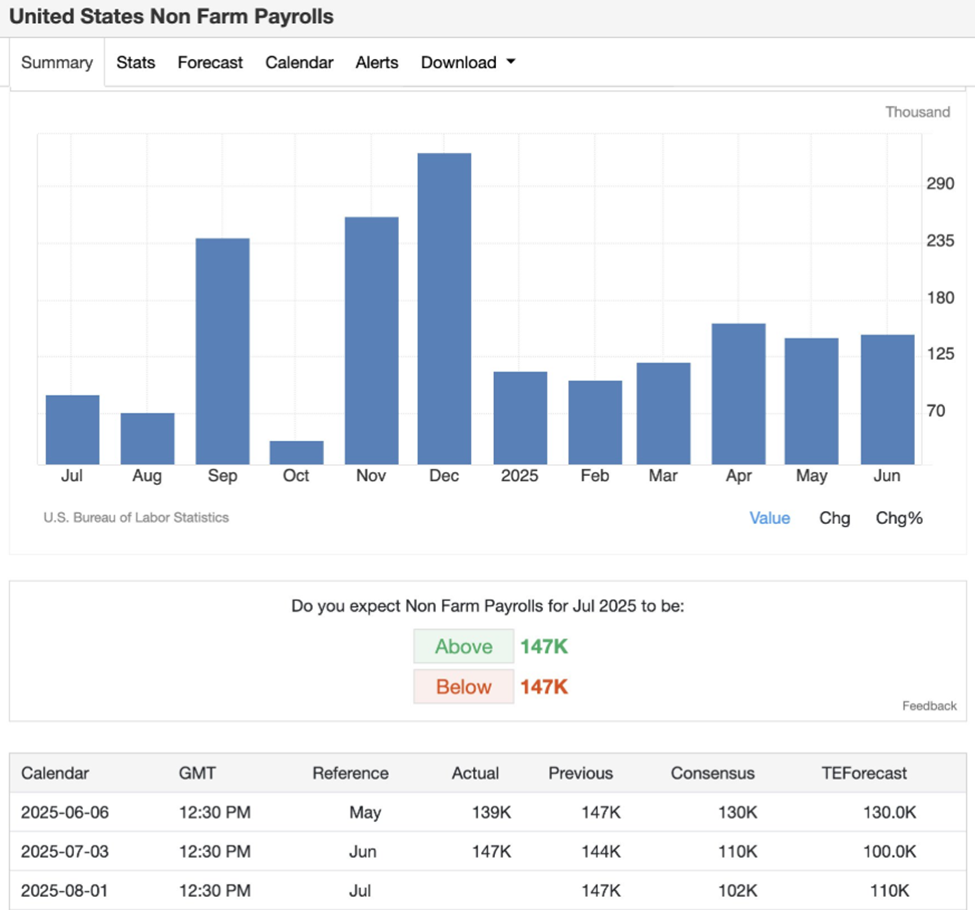
The US Employment report, or Non-Farm Payrolls (NFP) for July 2025, is scheduled for release on Friday. The economy added 147,000 jobs in June after 139,000 jobs in April. Meanwhile, the unemployment rate dropped to 4.1% in June after 4.2% in May.

Non-farm payroll and unemployment US
Non-farm payroll and unemployment in the US. Source: Trading Economics

Data on MarketWatch shows that economists anticipate an increase of 4.2% in the US unemployment rate against a slowdown in jobs to 102,000.  This drop or slowdown reflects potential economic impacts from President Trump’s tariffs.

Strong job growth may lead the Fed to maintain its current monetary policy stance or even consider tightening, which could strengthen the US dollar and potentially suppress Bitcoin.

However, if underlying economic concerns prompt the Fed to adopt a more dovish approach, Bitcoin could benefit as investors seek alternative stores of value.

Analysts say tough employment conditions in the US come as employers seeking clarity around the White House’s trade policy progressively having to deal with frequent adjustments to timelines and schedules.

FOMC Interest Rate Decision

Meanwhile, this week’s US economic signals highlight the FOMC interest rate decision on Wednesday. This economic indicator comes after the US CPI (Consumer Price Index) showed inflation rose to 2.7% in June.

The FOMC minutes on July 9 suggested rate cuts this year, with policymakers agreeing inflation had eased but remained “somewhat elevated.” Additionally, uncertainty around the outlook had diminished, though not disappeared.

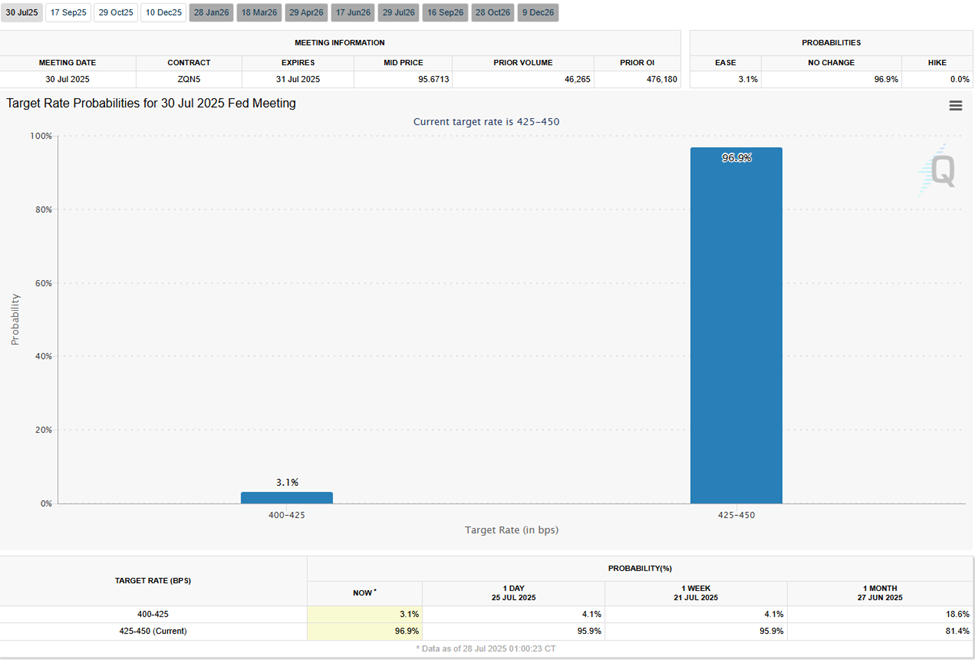
However, whether the Fed will cut interest rates on July 30 remains to be seen. Data on the CME FedWatch Tool shows that interest bettors see a 96.9% probability that the Fed will keep interest rates unchanged between 4.25% and 4.50%.

Fed Interest Rate Probabilities
Fed Interest Rate Probabilities. Source: CME FedWatch Tool

“What’s more interesting is the Powell press conference. A few days ago, Trump met Powell, and he’s expecting the Fed to be dovish. A few other Fed governors are also calling for low interest rates, so this press conference will be pivotal,” one user observed.

Indeed, beyond the FOMC interest rate decision, traders and investors will closely examine Fed chair Jerome Powell’s speech for signals into the Fed’s future outlook.

If Powell hints at rate cuts in September, it could inspire optimism in the market. However, if he sounds just like the last FOMC meetings, the crypto market might see a sharp correction.

The post US Economic Signals with Crypto Implications This Week appeared first on BeInCrypto.
How PancakeSwap (CAKE) Benefits from BNB Reaching a New All-Time High

CAKE, the native token of decentralized exchange (DEX) PancakeSwap, surged to a 5-month high amidst a broader market rally.

Analysts are growing increasingly optimistic that the altcoin could see further gains, driven by BNB’s (BNB) latest uptrend, which propelled it to a new peak just hours ago.

Analysts Predict PancakeSwap (CAKE) Growth Amid BNB’s All-Time High 

BeInCrypto reported that BNB has been on a remarkable rally lately. The coin’s value has apprecaited 31.4% over the past month. In fact, BeInCrypto price data revealed that BNB hit an all-time high of $860 today.

The increase in the altcoin’s value has sparked growing optimism about what some are calling a ‘BNB Season,’ which could spur growth across the BNB ecosystem. In fact, many believe that PancakeSwap, a leading multi-chain DEX originally built on the BNB Chain (formerly Binance Smart Chain), could benefit significantly.

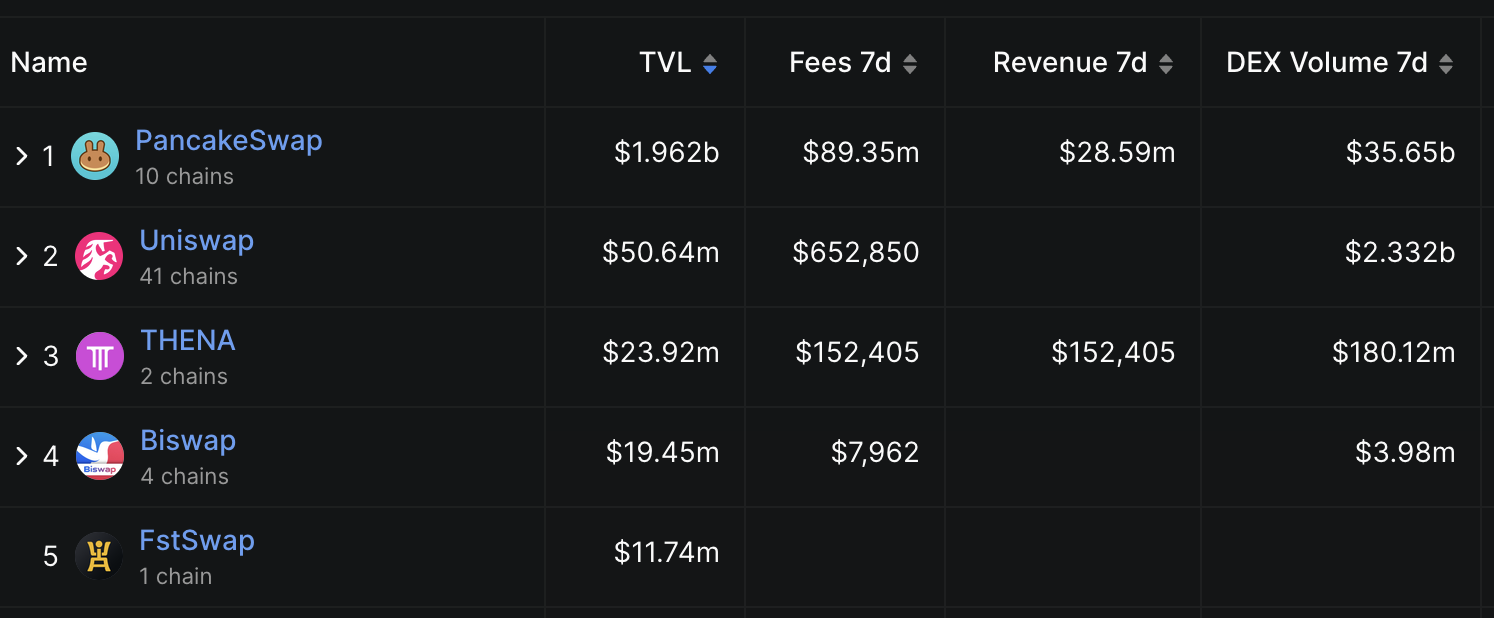
But why would a rise in BNB impact PancakeSwap? According to data from DefiLlama, PancakeSwap is currently the top DEX in terms of total value locked (TVL) and trading volume on the chain. This strong position within the ecosystem makes the platform a key beneficiary of BNB’s growth.

PancakeSwap TVL and DEX volume
PancakeSwap TVL and DEX volume. Source: DefiLlama

PancakeSwap also leads DEX activity across the broader ecosystem. Over the past month, the platform has recorded a trading volume of $185.329 billion, outpacing competitors like Uniswap, Raydium, and Meteora. This highlights PancakeSwap’s strong position in the market.

Notably, the BNB Chain accounts for the majority of users and trading volume on PancakeSwap. Data from Dune Analytics shows that the BNB Chain contributed significantly to PancakeSwap’s activity, with a cumulative user count reaching 54.59 million and a total volume of $1.90 trillion. 

This deep integration with the BNB Chain further solidifies PancakeSwap’s role as a leading platform in this growing ecosystem. However, a factor that stands out the most is the impact of BNB’s rally on CAKE’s price. 

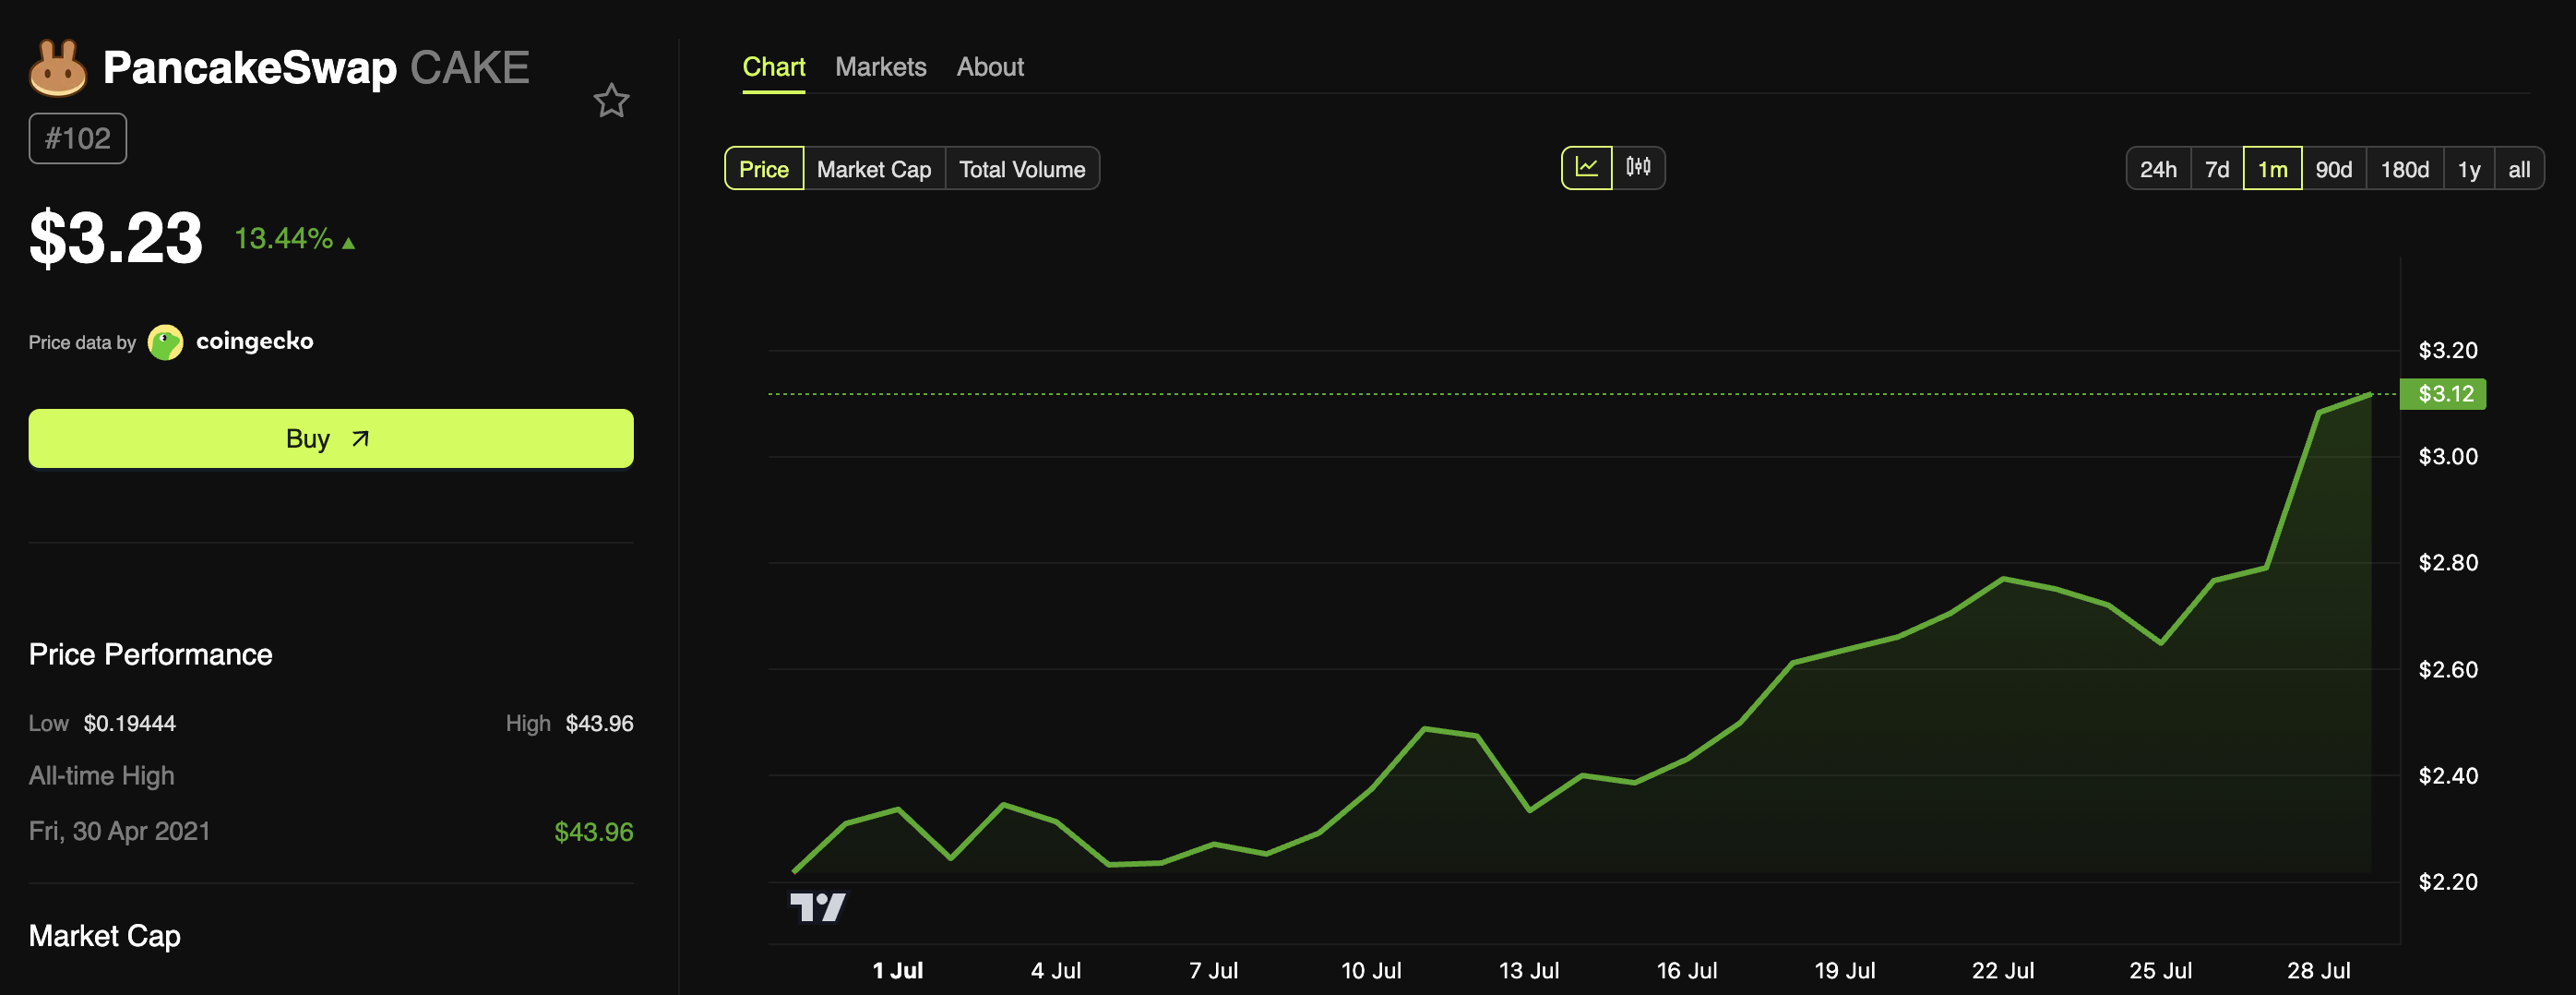
After BNB recorded new highs yesterday, CAKE’s value surged to surpass $3 for the first time since mid-February. BeInCrypto data showed that the token’s price has increased 13.4% over the past day. At the time of writing, CAKE was trading at $3.23.

PancakeSwap (CAKE) Price Performance
PancakeSwap (CAKE) Price Performance. Source: BeInCrypto

While the growth is remarkable, analysts believe that there’s still scope for more.

“When BNB hits a new high, the BNB ecosystem will recover strongly,  starting with CAKE, followed by memes and tech tokens on BNB Chain,” an analyst wrote.

Meanwhile, another analyst claimed that CAKE is ‘undervalued.’ He forecasted that the DEX token has a lot of room to grow and could reclaim its previous peak.

“BNB is trading at all-time highs, while the main DEX token on BSC still has 15x potential just to reclaim its previous ATH,” the post read.

As BNB Season gains traction, PancakeSwap stands to benefit from the heightened interest in the ecosystem. Whether CAKE actually rises as analysts predict remains speculative, but the alignment of fundamental factors positions it as a key player in the unfolding DeFi narrative.

The post How PancakeSwap (CAKE) Benefits from BNB Reaching a New All-Time High appeared first on BeInCrypto.
3 Altcoins at Risk of Major Liquidations in the Last Week of July

In the final week of July, the total open interest in the crypto derivatives market remains historically high, exceeding $200 billion. Any significant price movement now could trigger massive losses for both long and short positions.

However, a few altcoins are showing signs of potential large-scale liquidations this week. Let’s take a closer look at which ones.

1. Ethereum

Ethereum has been surrounded by positive news about institutional accumulation in recent months. At times, its inflows even outperformed those of Bitcoin ETFs. More recently, SharpLink Gaming acquired 77,206 ETH worth $296 million last week, raising its total holdings to 438,000 ETH.

These bullish developments pushed ETH close to the $4,000 mark in the last week of July. Many analysts expect ETH to hit $4,000 soon—or even surpass it. But this level also acts as a strong psychological resistance, where profit-taking could emerge at any moment.

“A key resistance level ahead for Ethereum $ETH is $3,980. Breaking above it could ignite a major bull rally!” crypto analyst Ali Martinez commented.

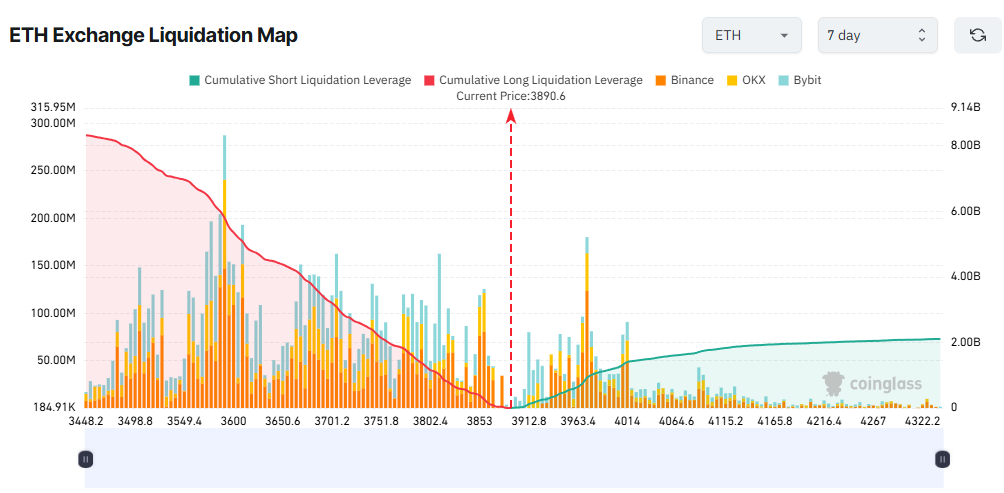
Regardless of direction, the liquidation map shows that potential liquidations could reach billions of dollars if ETH moves significantly.

ETH Exchange Liquidation Map. Source: Coinglass

According to Coinglass data, if ETH breaks above $4,000, total accumulated short liquidations could reach $1.2 billion. On the other hand, if ETH faces strong profit-taking and drops to $3,500, long liquidations could soar to $7.8 billion.

The map also reveals an imbalance between longs and shorts, indicating that many traders are betting more money and leverage on a downward correction.

2. Solana

Although Solana still needs to rise over 50% to revisit its early-year high of nearly $300, its open interest has already exceeded $11 billion. That’s over 25% higher than when SOL peaked in January.

This suggests that traders are more exposed to Solana now than in the past. However, most of this exposure comes from derivatives rather than spot trading.

CoinMarketCap data shows that SOL’s current daily spot trading volume is just over $6 billion. That’s far below the tens of billions seen in January.

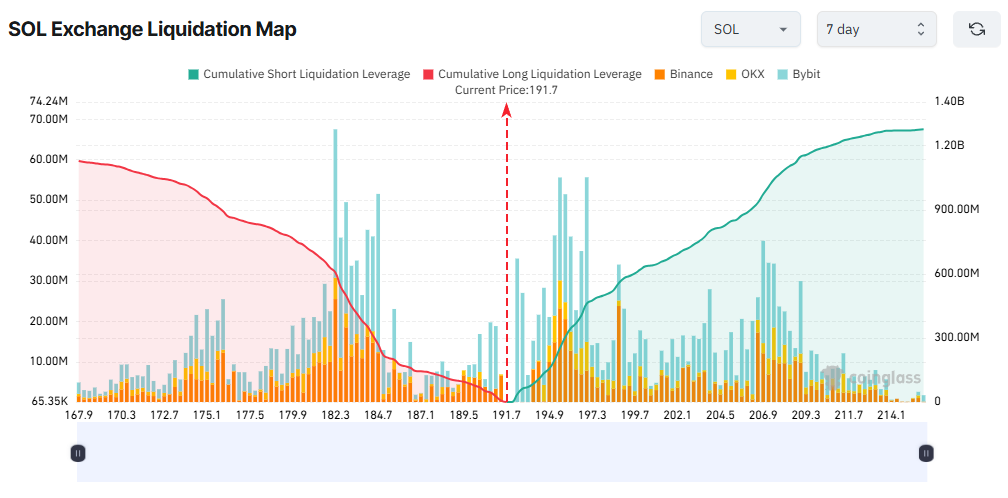
This wide gap between derivatives and spot volume reflects that Solana traders are leaning toward short-term bets. As a result, the token is prone to sharp swings and potential liquidations.

SOL Exchange Liquidation Map. Source: Coinglass

The liquidation map shows a balance between long and short positions. With SOL trading around $191, a move above $200 could trigger more than $600 million in liquidations. Conversely, a drop to $181 could liquidate over $700 million in long positions.

3. BNB

Entering the last week of July, BNB hit a new all-time high of $859. This rally was fueled by growing activity on BNB Chain and increased interest from companies in the BNB treasury.

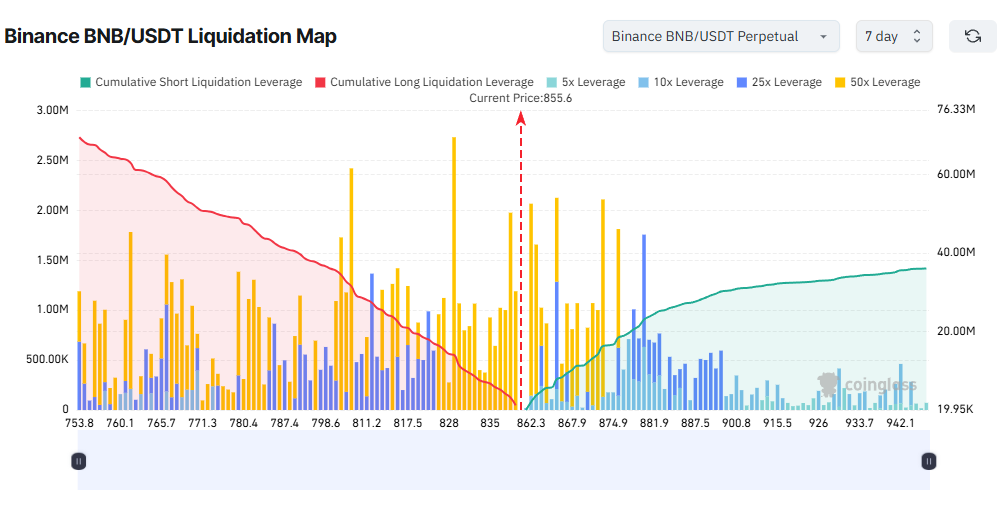
While BNB hasn’t shown signs of a pullback yet, the BNB/USDT liquidation map on Binance reveals heavy leverage—up to 50x.

The map is almost entirely covered in yellow (indicating 50x leverage), especially around the $753 to $875 range.

Binance BNB/USDT Liquidation Map. Source: Coinglass

On Binance alone, total long liquidations outweigh shorts. If BNB surpasses $875, short positions worth $18.5 million could be liquidated. On the other hand, if BNB drops below the psychological $800 mark, more than $36 million in long positions would be wiped out.

Ignoring short-term noise, many analysts believe BNB could soon reach $1,000. However, some offer a more detailed view, suggesting that the price might first fall below $800 before resuming its uptrend.

The post 3 Altcoins at Risk of Major Liquidations in the Last Week of July appeared first on BeInCrypto.
3 Altcoins That Could Hit All-Time Highs in The Final Week Of July 2025

The crypto market has been fluctuating between bullish and bearish sentiment throughout the past week. As July draws to a close, a clear trend remains elusive. While some altcoins struggle to gain traction, others are already reaching new all-time highs.

BeInCrypto has analysed three such altcoins that could reach a new all-time high in the coming days.

Sky Protocol (SKY)

SKY is currently trading at $0.0994, just 6% away from its all-time high (ATH) of $0.1054. Investors have been eagerly awaiting this level for over seven months. The altcoin is showing signs of upward momentum, with the ATH now within reach if current trends continue.

The broader market’s bullish sentiment supports the expectation that SKY could soon reach its ATH. If the altcoin can successfully flip $0.1000 into a strong support level, it will likely surge to the ATH of $0.1054 and potentially exceed this price, further fueling investor optimism.

For token TA and market updates: Want more token insights like this? Sign up for Editor Harsh Notariya’s Daily Crypto Newsletter here.

SKY Price Analysis.
SKY Price Analysis. Source: TradingView

On the other hand, if investors begin to cash in on their gains, SKY could face selling pressure. This may lead to a pullback towards $0.0920. If the support at this level fails to hold, it would invalidate the bullish outlook, potentially triggering a deeper decline.

Hyperliquid (HYPE)

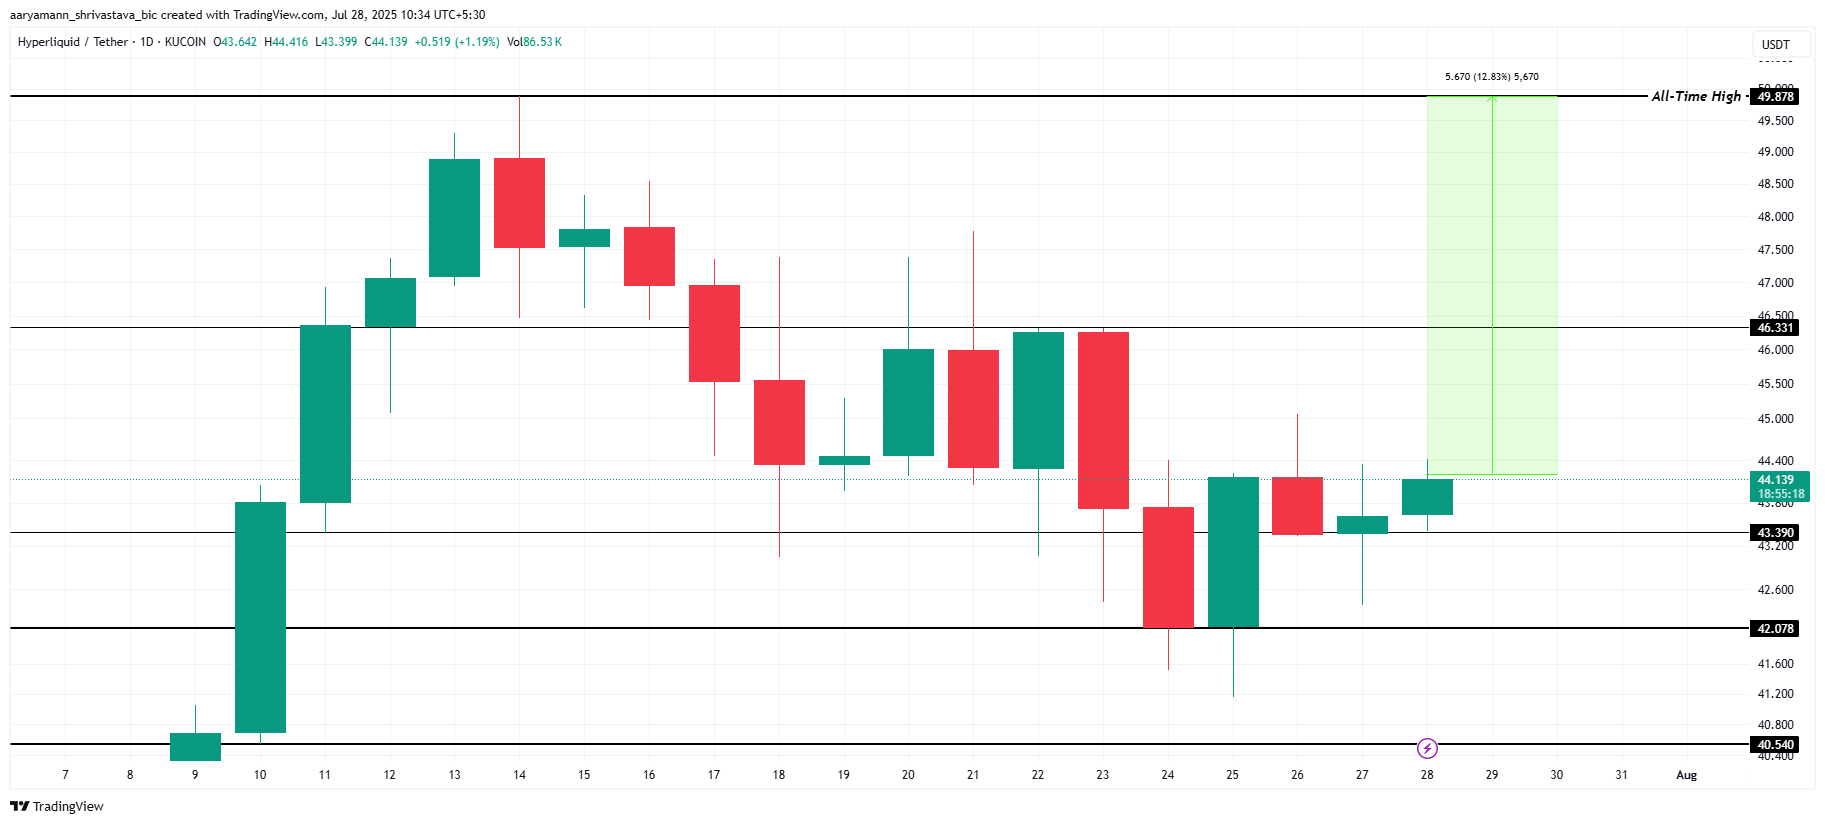
HYPE has shown some stability in recent days after a decline to $42. The altcoin is currently trading at $44, which leaves it approximately 12% away from its all-time high (ATH) of $49. This recovery signals a potential for growth if the broader market remains favorable.

For HYPE to reach its ATH, it must first flip $46 into a strong support level. The performance of the broader market will play a crucial role in this. If HYPE can maintain upward momentum and secure $46, a rise to the ATH is within reach.

HYPE Price Analysis.
HYPE Price Analysis. Source: TradingView

However, if HYPE fails to secure $46 and faces selling pressure, it could slip back to the support at $42 or lower. Such a drop would invalidate any bullish outlook for the altcoin and could lead to a further decline in price.

Saros (SAROS)

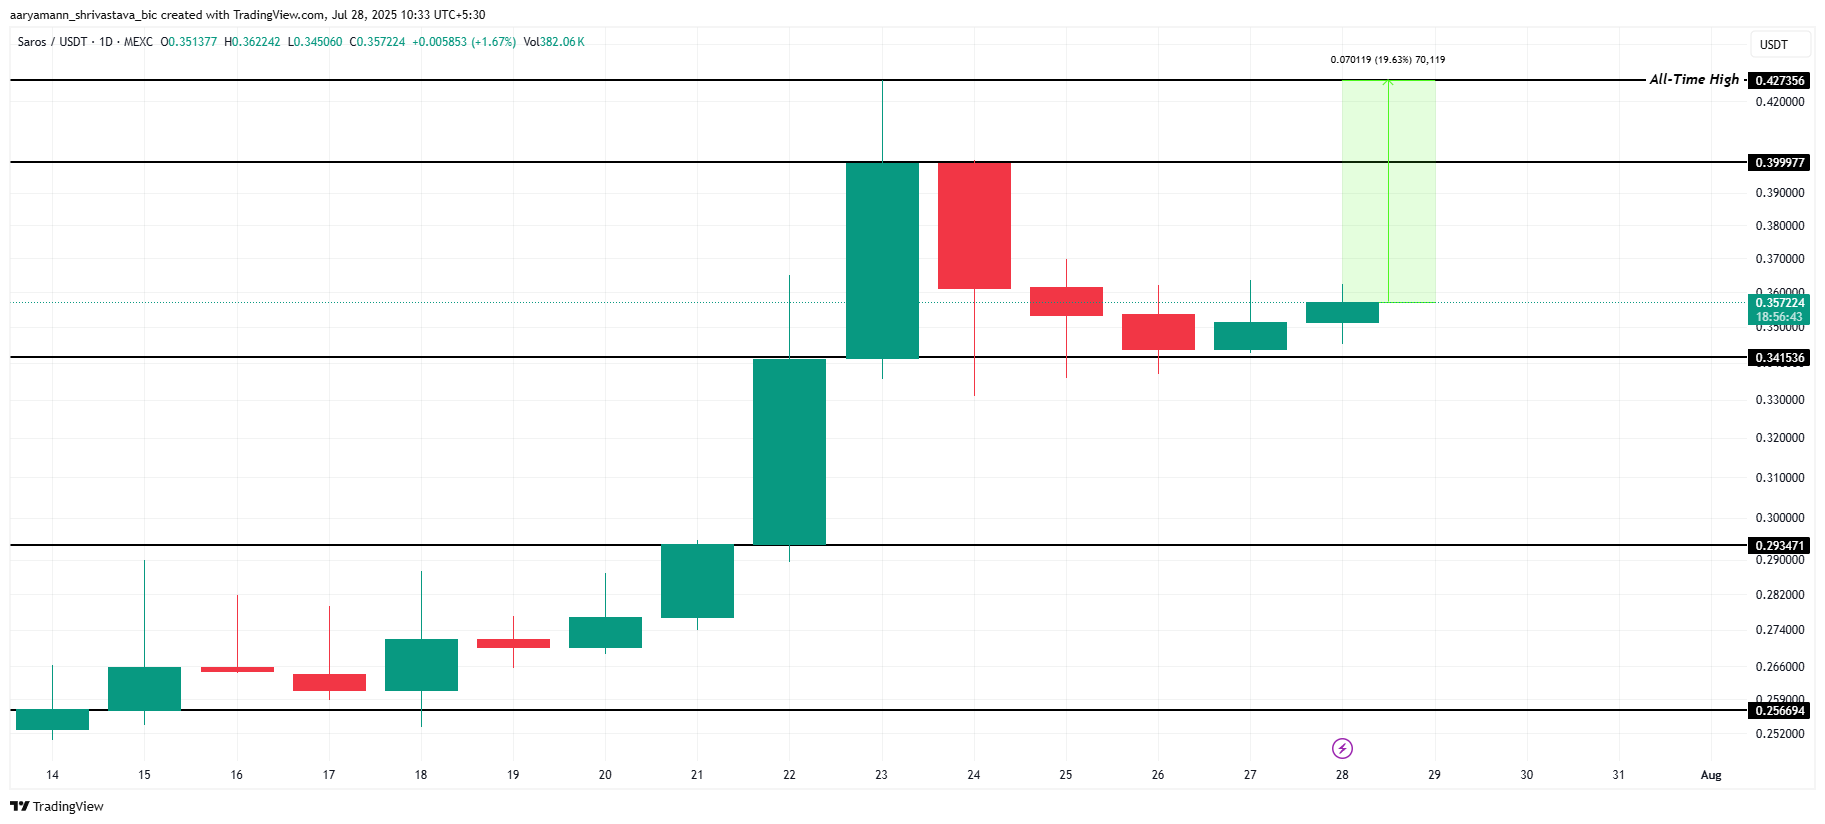
SAROS price is currently at $0.357, showing upward momentum after bouncing off the support at $0.341. The altcoin is roughly 20% away from its all-time high (ATH) of $0.427. This suggests that SAROS has the potential for further gains if the current trend continues.

During uptrends, SAROS has historically risen by 10-12% within a day. Given the current market conditions, if SAROS can secure $0.399 as support, the altcoin could likely reach its ATH of $0.427.

SAROS Price Analysis.
SAROS Price Analysis. Source: TradingView

However, if selling pressure intensifies and SAROS falls below the support at $0.341, the price could drop to $0.293. Such a decline would invalidate the bullish thesis and suggest a deeper downtrend, reversing recent gains.

The post 3 Altcoins That Could Hit All-Time Highs in The Final Week Of July 2025 appeared first on BeInCrypto.

Pump.Fun (PUMP) Faces Increased Volatility, Price Drop Looms

Pump.fun (PUMP) has faced a sharp decline recently, driven largely by investor withdrawals. The altcoin, which surged initially, is now stuck in a downward trajectory as many traders pull out. 

This bearish sentiment is likely to intensify, possibly leading to further price drops in the near future.

Pump.fun Faces A Decline

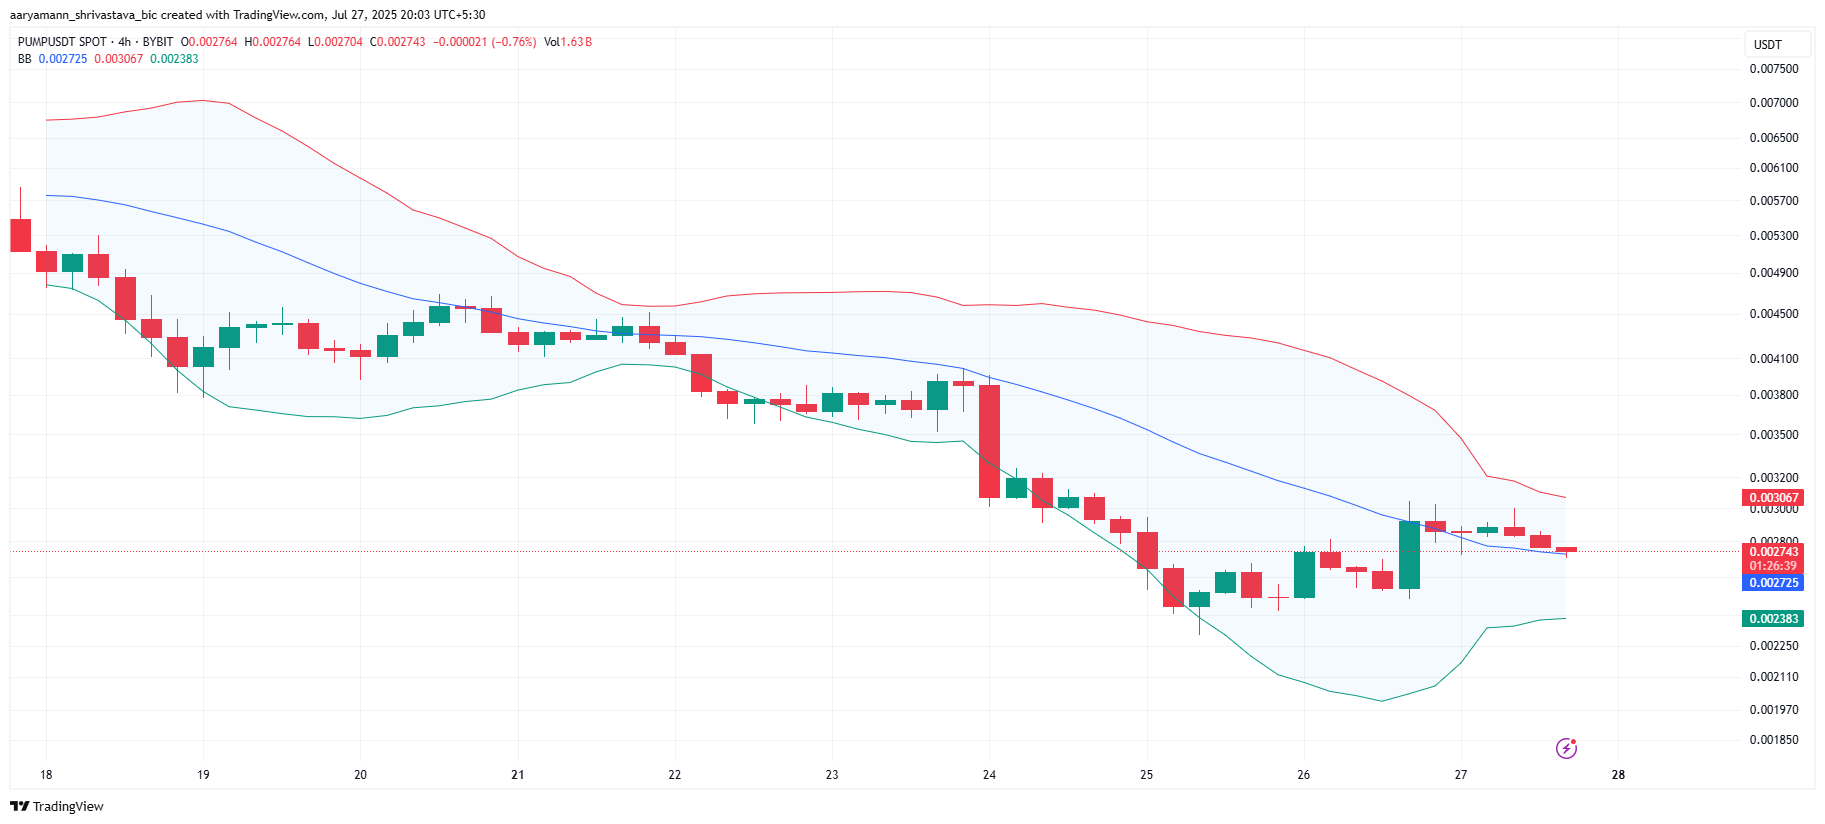
The Bollinger Bands on PUMP are currently converging, signaling an impending volatility explosion. This pattern often precedes a major price movement, but given the current market conditions, it is concerning for PUMP holders. 

With candlesticks sitting above the basis line, this suggests the likelihood of a decline, setting the stage for additional selling pressure. This dynamic suggests that investors may experience significant losses if the market sentiment continues to shift negatively in the coming days.

PUMP Bollinger Bands
PUMP Bollinger Bands. Source: TradingView

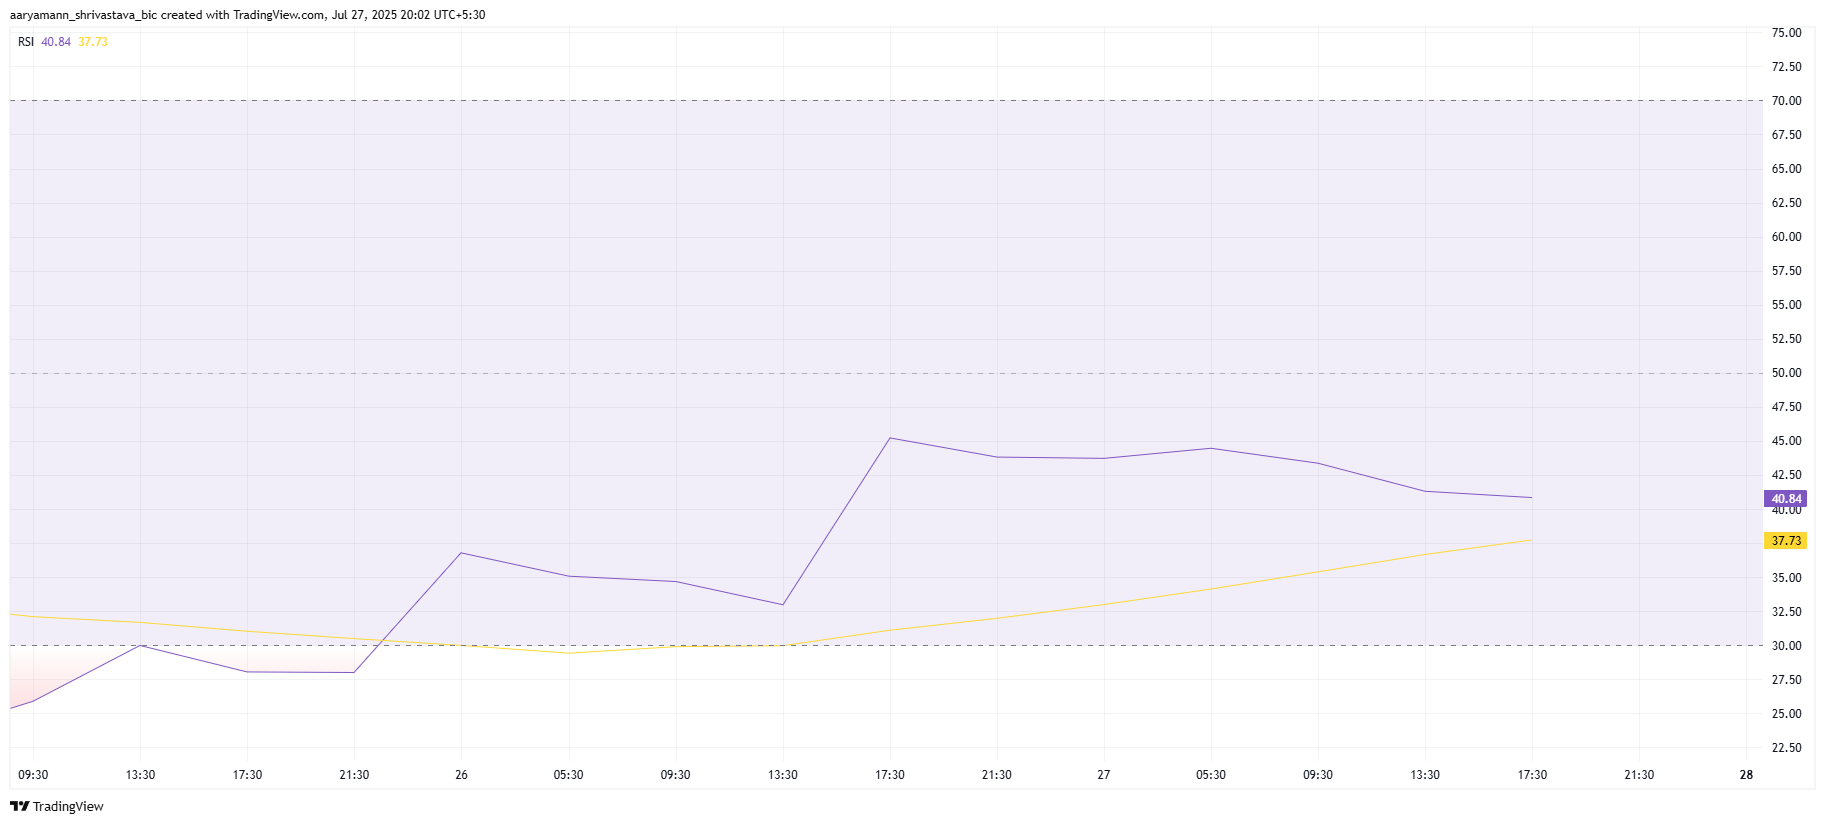
The Relative Strength Index (RSI) for PUMP is currently in the bearish zone, remaining below the neutral 50.0 mark. This indicates that selling pressure is dominating, and there is little to no bullish momentum at this time.

The RSI’s positioning reinforces the notion that the market is not yet ready to turn positive for PUMP.

With the volatility expected to increase, the RSI further confirms that the outlook for PUMP is bleak. As the altcoin’s momentum remains strongly bearish, it could be set for even deeper declines.

The lack of bullish signals makes it difficult for investors to expect a recovery in the short term.

PUMP RSI
PUMP RSI. Source: TradingView

Can PUMP Price Bounce Back?

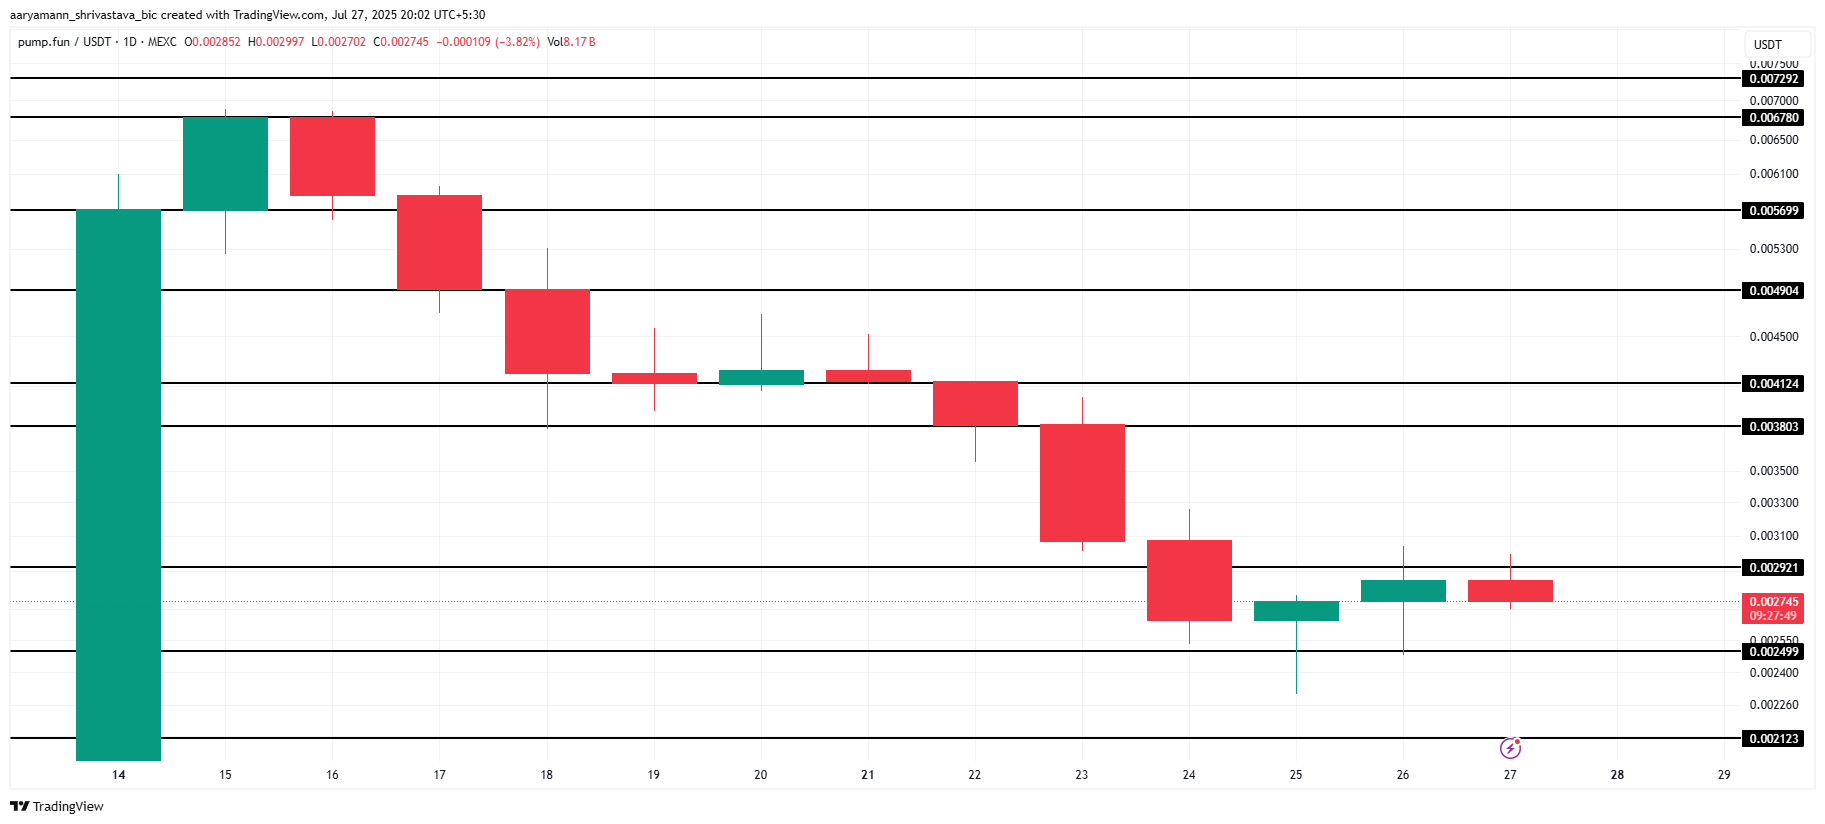
PUMP is currently trading at $0.0027, just below the resistance level of $0.0029 and holding above the support level of $0.0024. This consolidation phase, while it may provide temporary stability, still leaves the altcoin vulnerable to further declines. 

If the altcoin fails to maintain its current support, it could drop to $0.0024 and potentially fall to $0.0021. Such a move would deepen the losses that investors have already endured, confirming the prevailing bearish sentiment.

PUMP Price Analysis.
PUMP Price Analysis. Source: TradingView

However, should the market unexpectedly turn around, and PUMP successfully secures $0.0029 as support, a potential rally could follow. In this case, the altcoin might push towards $0.0038, invalidating the bearish outlook and providing hope for a price reversal.

The post Pump.Fun (PUMP) Faces Increased Volatility, Price Drop Looms appeared first on BeInCrypto.
China Busts $20 Million Bitcoin Laundering Ring Tied to TikTok-Style App

Chinese authorities dismantled a Bitcoin (BTC) laundering operation involving employees of Kuaishou, the country’s second-largest TikTok-style video-sharing platform.

China remains one of the most stringent regulatory environments for cryptocurrencies globally. Its near-total ban is driven by concerns over financial stability, capital flight, crime, and environmental impact.

Kuaishou Employees Imprisoned for $20 Million Bitcoin Scheme

The Haidian District People’s Procuratorate in Beijing reported that company insiders embezzled nearly 140 million yuan (around $20 million).

Reportedly, they used Bitcoin to conceal and move the funds through a sophisticated network of crypto exchanges and mixers.

The case revealed how the group funneled the stolen funds through eight overseas cryptocurrency exchanges, leveraging coin mixing services to obfuscate the transaction trail.

Despite their efforts, investigators tracked down the flows and ultimately recovered 92 BTC, worth approximately 89 million yuan ($11.7 million), which was returned to the company. A prosecutor from the Haidian Procuratorate described the case as emblematic of new trends in digital corruption.

“This case highlights three notable features of modern digital-era corruption: Small officials with big corruption, money laundering with virtual currency, and weak corporate risk management awareness,” local media reported, citing prosecutor Li Tao.

Feng, the main perpetrator, and seven co-conspirators were convicted of occupational embezzlement. Their sentences ranged from three to fourteen years in prison, along with financial penalties.

The verdict, delivered by the Haidian District People’s Court, emphasizes China’s growing capacity to trace digital assets even through layers of anonymizing tools.

This case is significant beyond the size of the funds, reflecting a rising trend where commercial corruption is intertwined with emerging technologies like crypto. This allows perpetrators to conduct high-tech laundering beyond traditional regulatory reach.
Recently, a Beijing court sentenced former financial official Hao Gang to 11 years in prison for bribery and Bitcoin-related money laundering.

The Haidian Procuratorate recently released a white paper on commercial corruption, documenting 1,253 related cases between 2020 and 2024.

Authorities highlighted how many schemes are now coordinated with external actors and depend heavily on digital tools to evade scrutiny.

This case signals the need for tech companies and crypto platforms to strengthen monitoring systems amid rising enforcement efforts.

Meanwhile, China’s stance on crypto remains contentious. The National Development and Reform Commission of China (NDRC) categorized the digital assets market as an undesirable industry. Against this backdrop, provinces shut down mining operations.

Similarly, the Chinese government declared all crypto-related transactions illegal, solidifying the ban and prohibiting overseas exchanges from serving Chinese citizens. BeInCrypto reported a Chinese court ruling that crypto futures trading constitutes gambling, convicting BKEX employees for “opening a casino.”

Notwithstanding, the country possesses a proven capacity to adjust to geopolitical shifts to sustain its economic dominance. Two such endeavors include a recent $138 billion stimulus and reverse repo rate adjustments.

The post China Busts $20 Million Bitcoin Laundering Ring Tied to TikTok-Style App appeared first on BeInCrypto.